Evaluation of the water conservation function in the Ili River Delta of Central Asia based on the InVEST model
|
Evaluation of the water conservation function in the Ili River Delta of Central Asia based on the InVEST model |
| CAO Yijie, MA Yonggang, BAO Anming, CHANG Cun, LIU Tie |
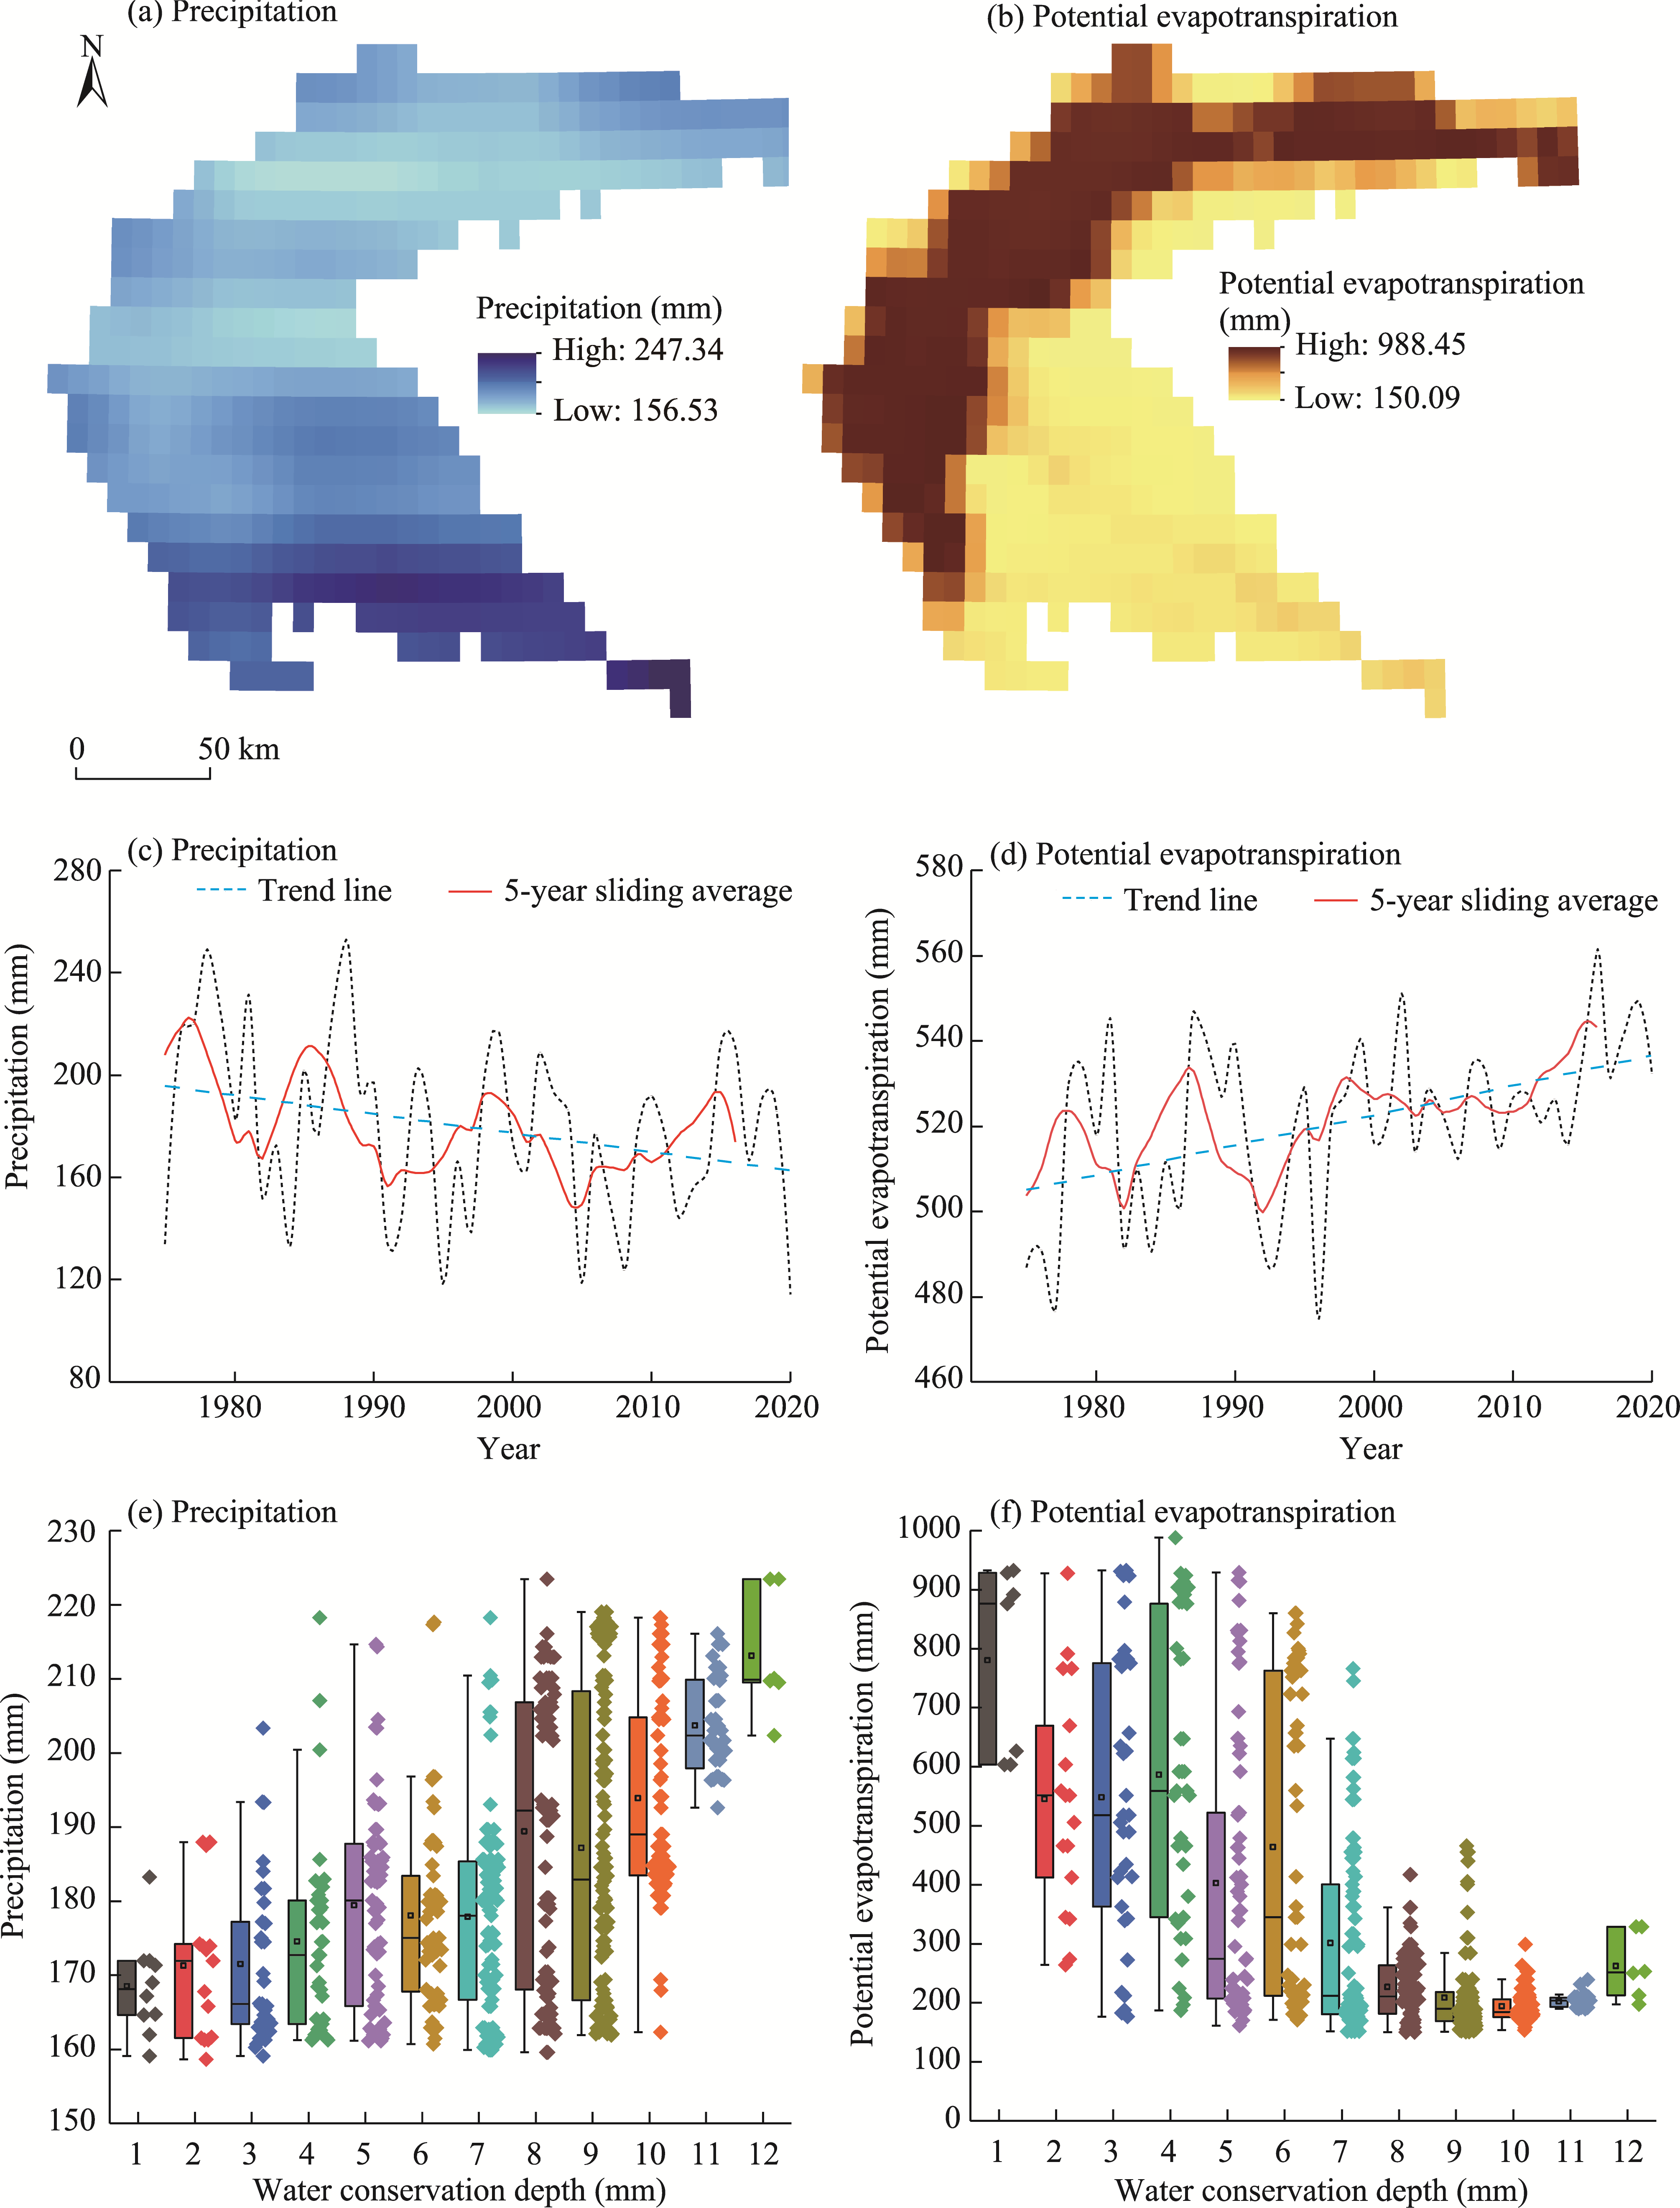
| Fig. 6 Spatial distribution of average annual precipitation (a) and average annual potential evapotranspiration (b), temporal changes in annual precipitation (c) and annual potential evapotranspiration (d), and variations of precipitation (e) and potential evapotranspiration (f) at different water conservation depths in the IRD during 1975-2020. The different colors in |
|
|