| Research article |
|


|
|
|
| Spatiotemporal variations in the growth status of declining wild apple trees in a narrow valley in the western Tianshan Mountains, China |
QIU Dong1,2, TAO Ye2, ZHOU Xiaobing2, Bagila MAISUPOVA3, YAN Jingming2, LIU Huiliang2, LI Wenjun2, ZHUANG Weiwei1,*( ), ZHANG Yuanming2,*() ), ZHANG Yuanming2,*() |
1Xinjiang Key Laboratory of Special Species Conservation and Regulatory Biology/Key Laboratory of Special Environment Biodiversity Application and Regulation in Xinjiang/Key Laboratory of Plant Stress Biology in Arid Land/College of Life Sciences, Xinjiang Normal University, Urumqi 830054, China
2State Key Laboratory of Desert and Oasis Ecology, Xinjiang Institute of Ecology and Geography, Chinese Academy of Sciences, Urumqi 830011, China
3Kazakh Scientific Research Institute of Forestry and Agroforestry, Astana 010000, Kazakhstan |
|
|
|
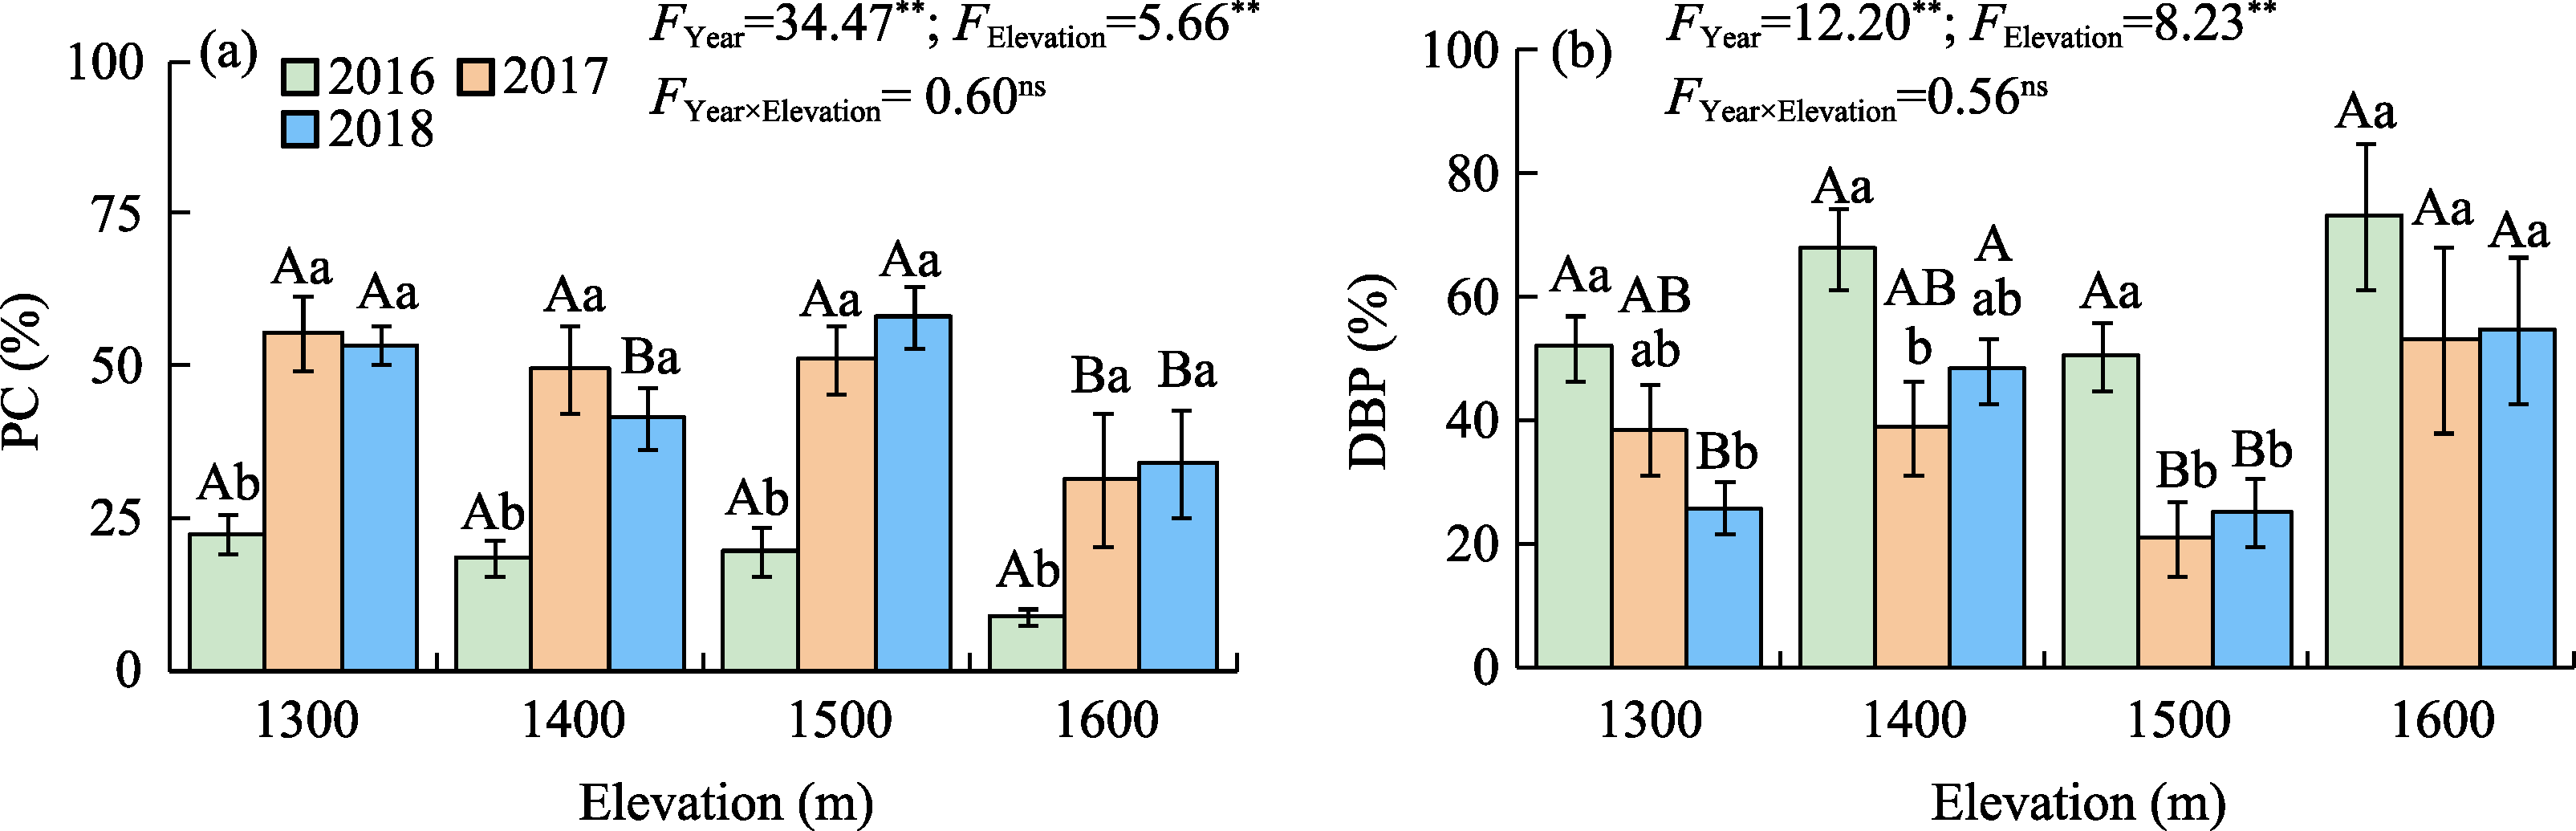
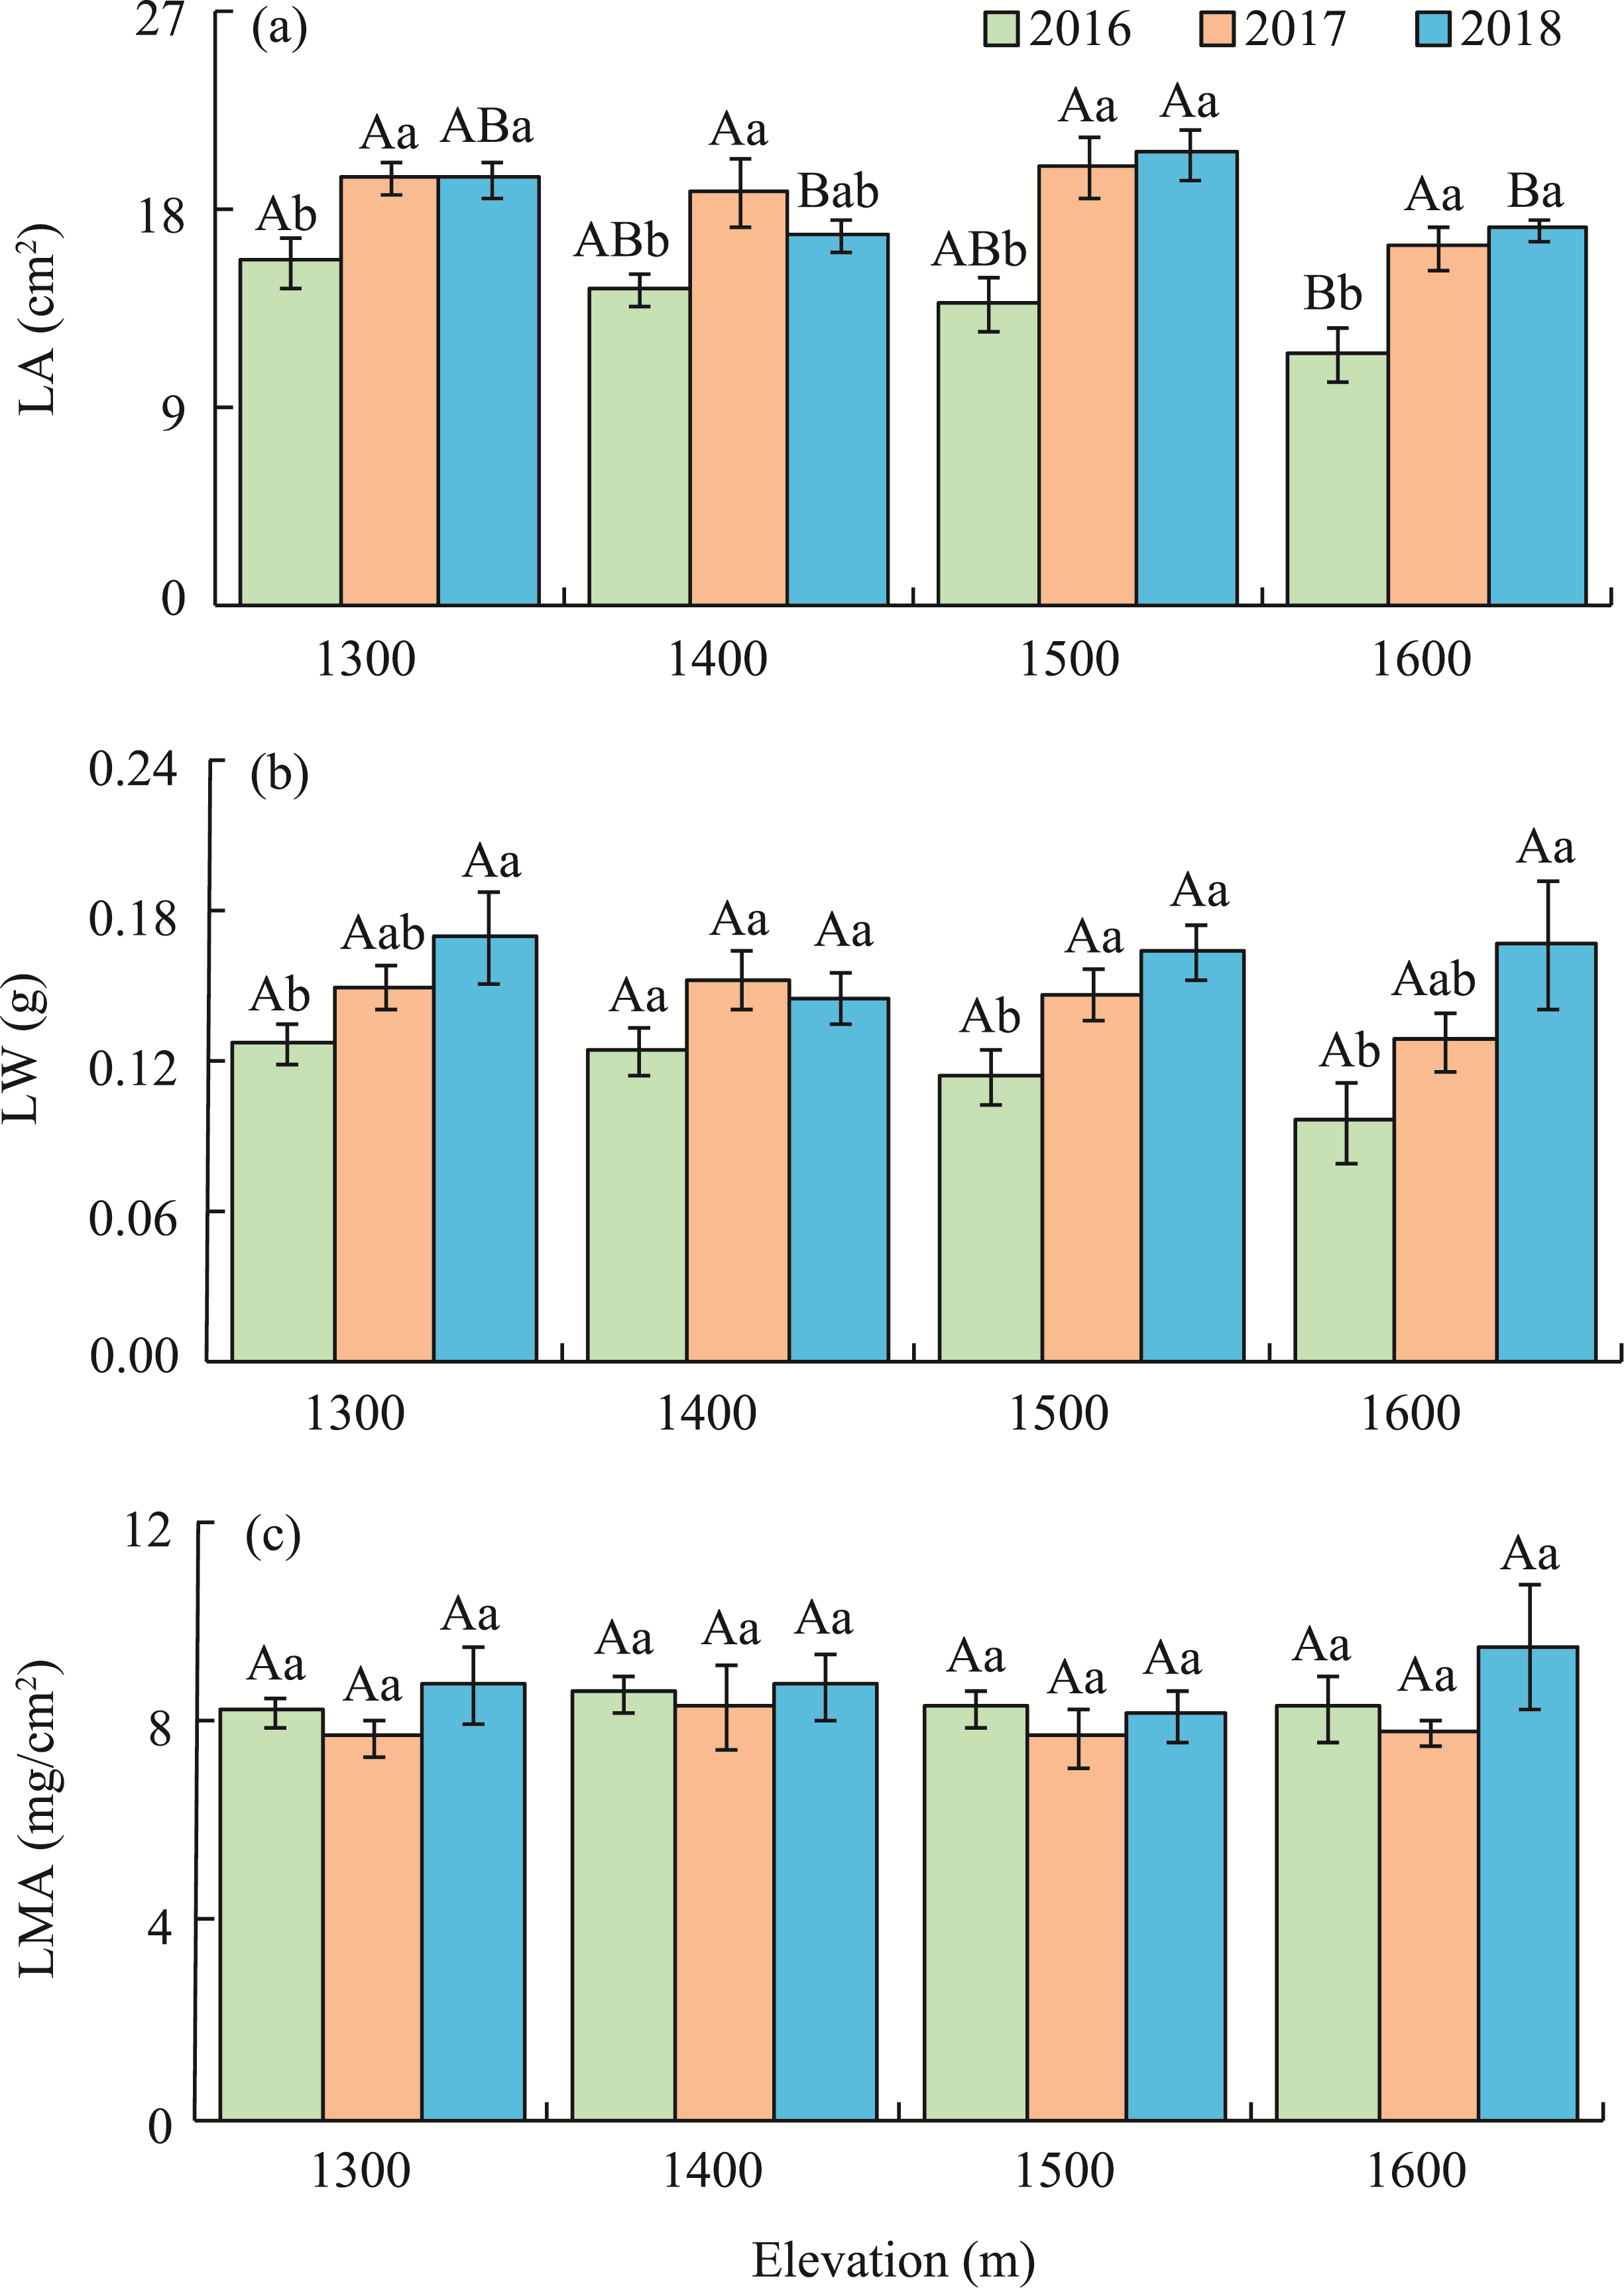
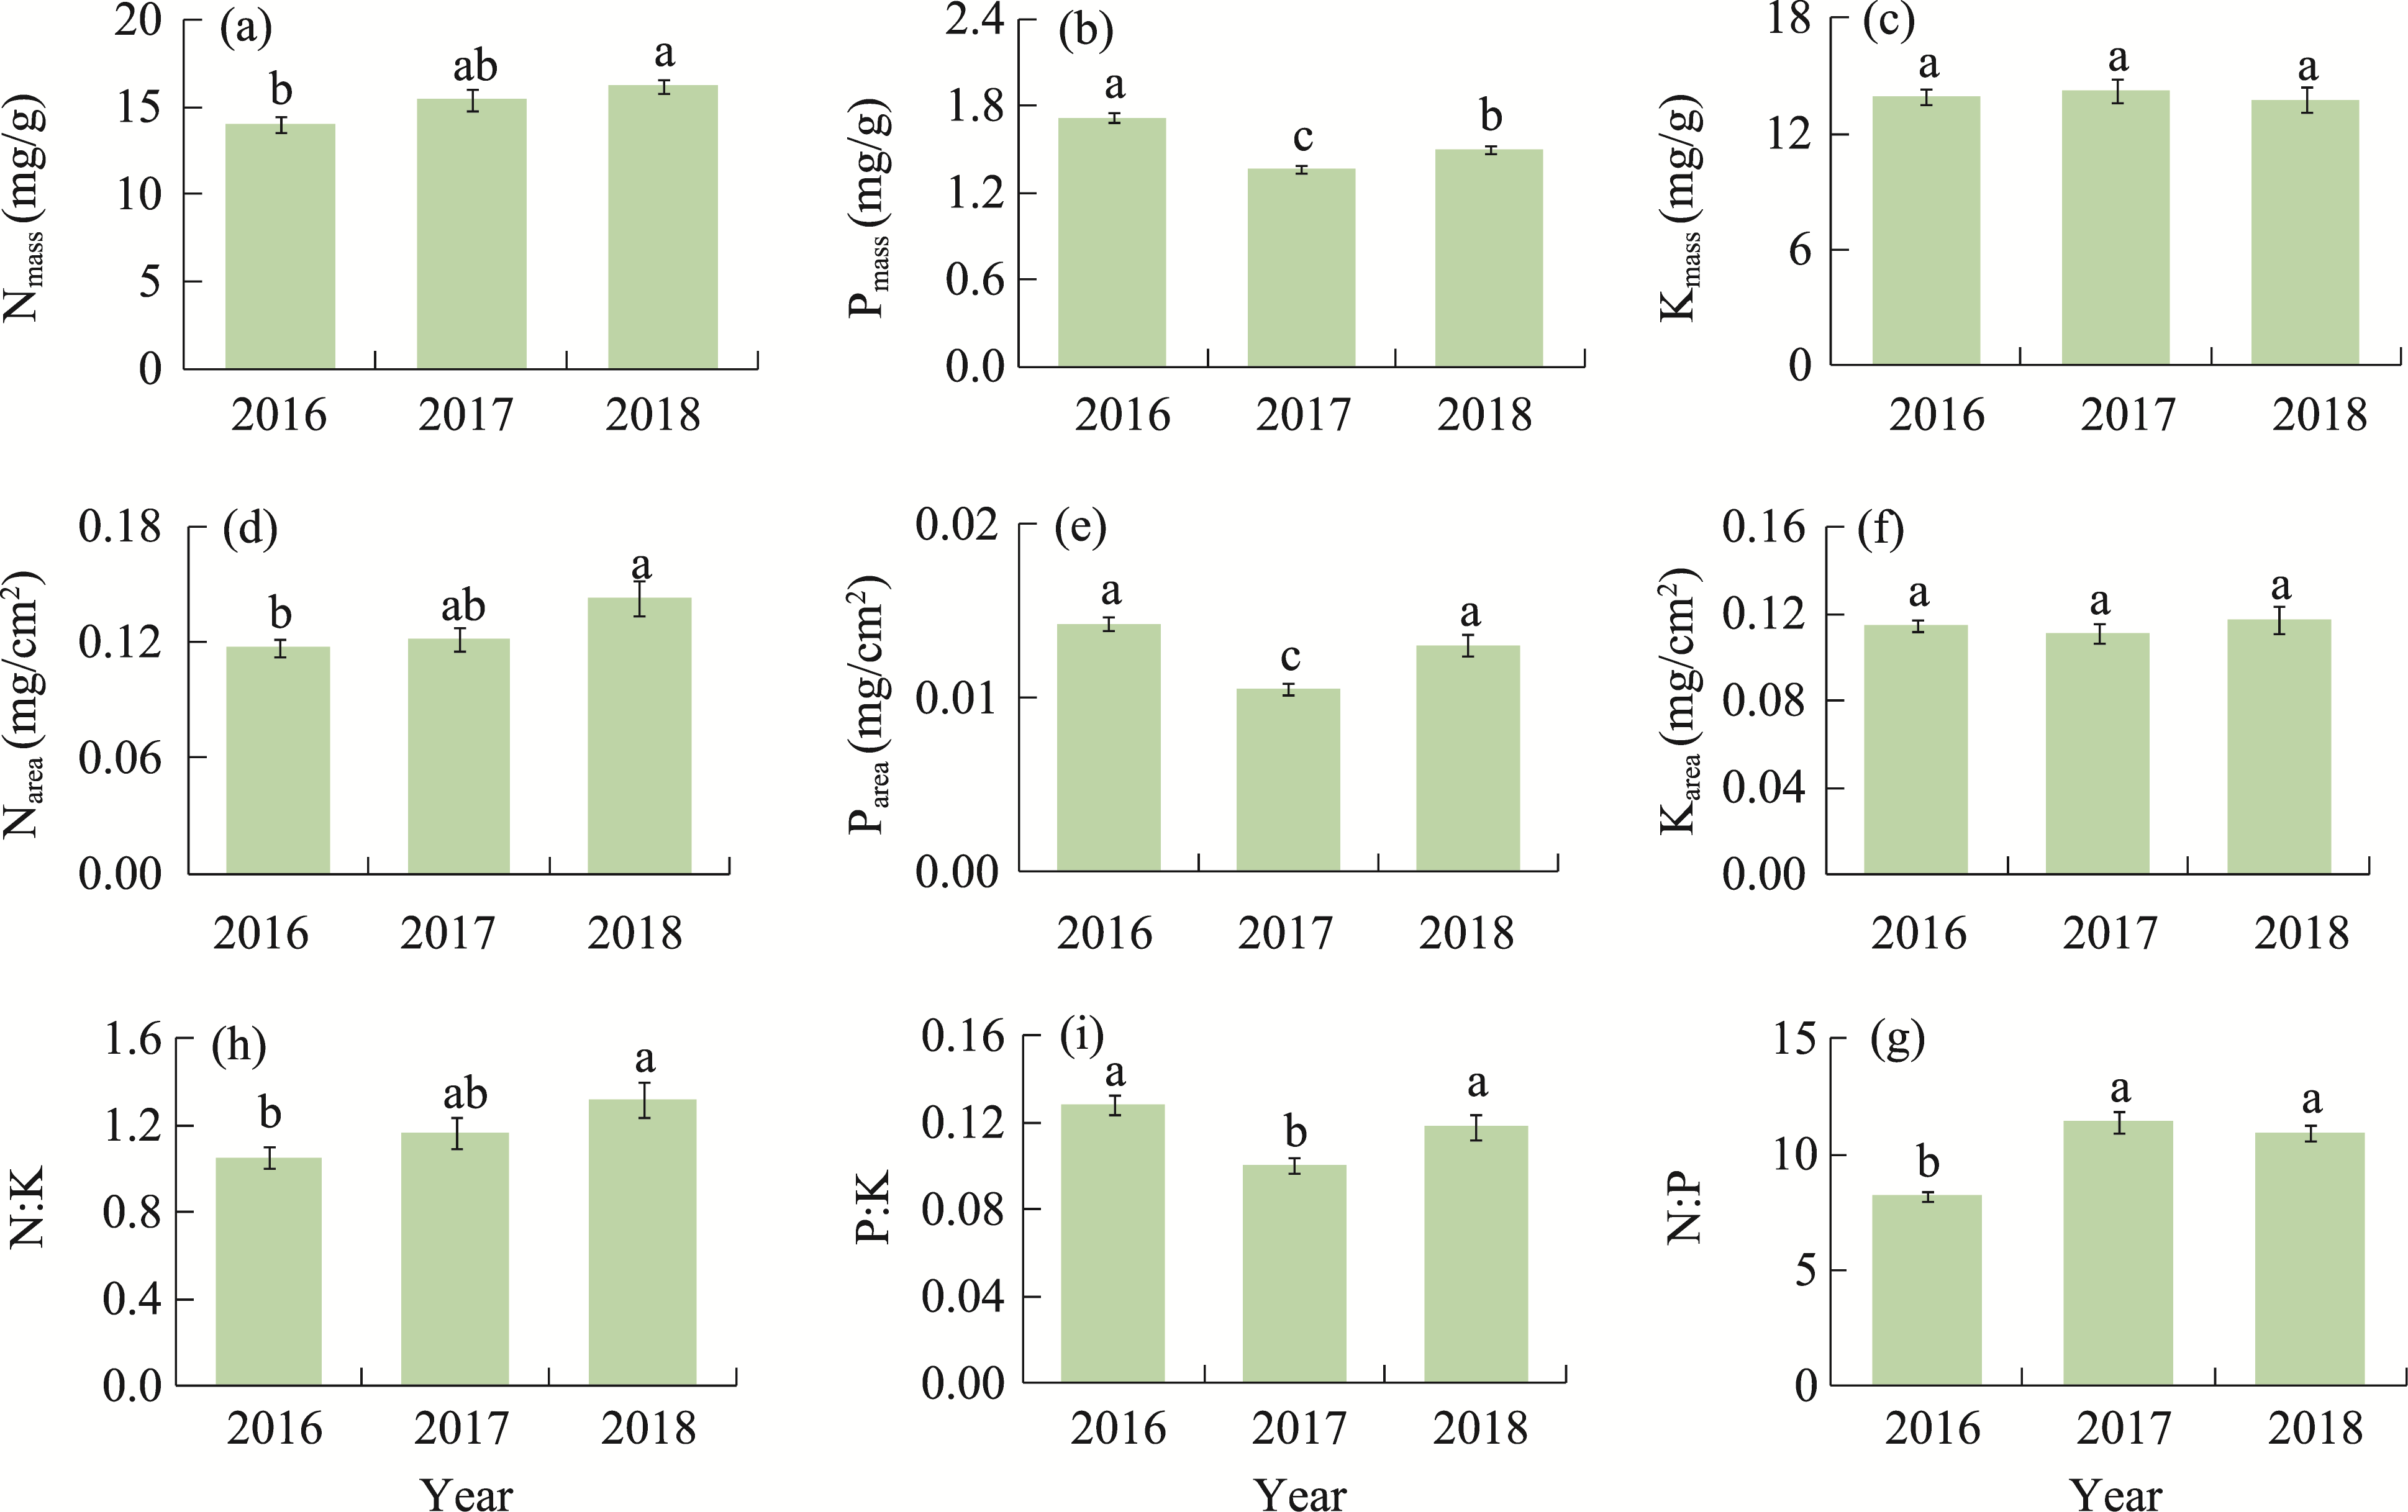
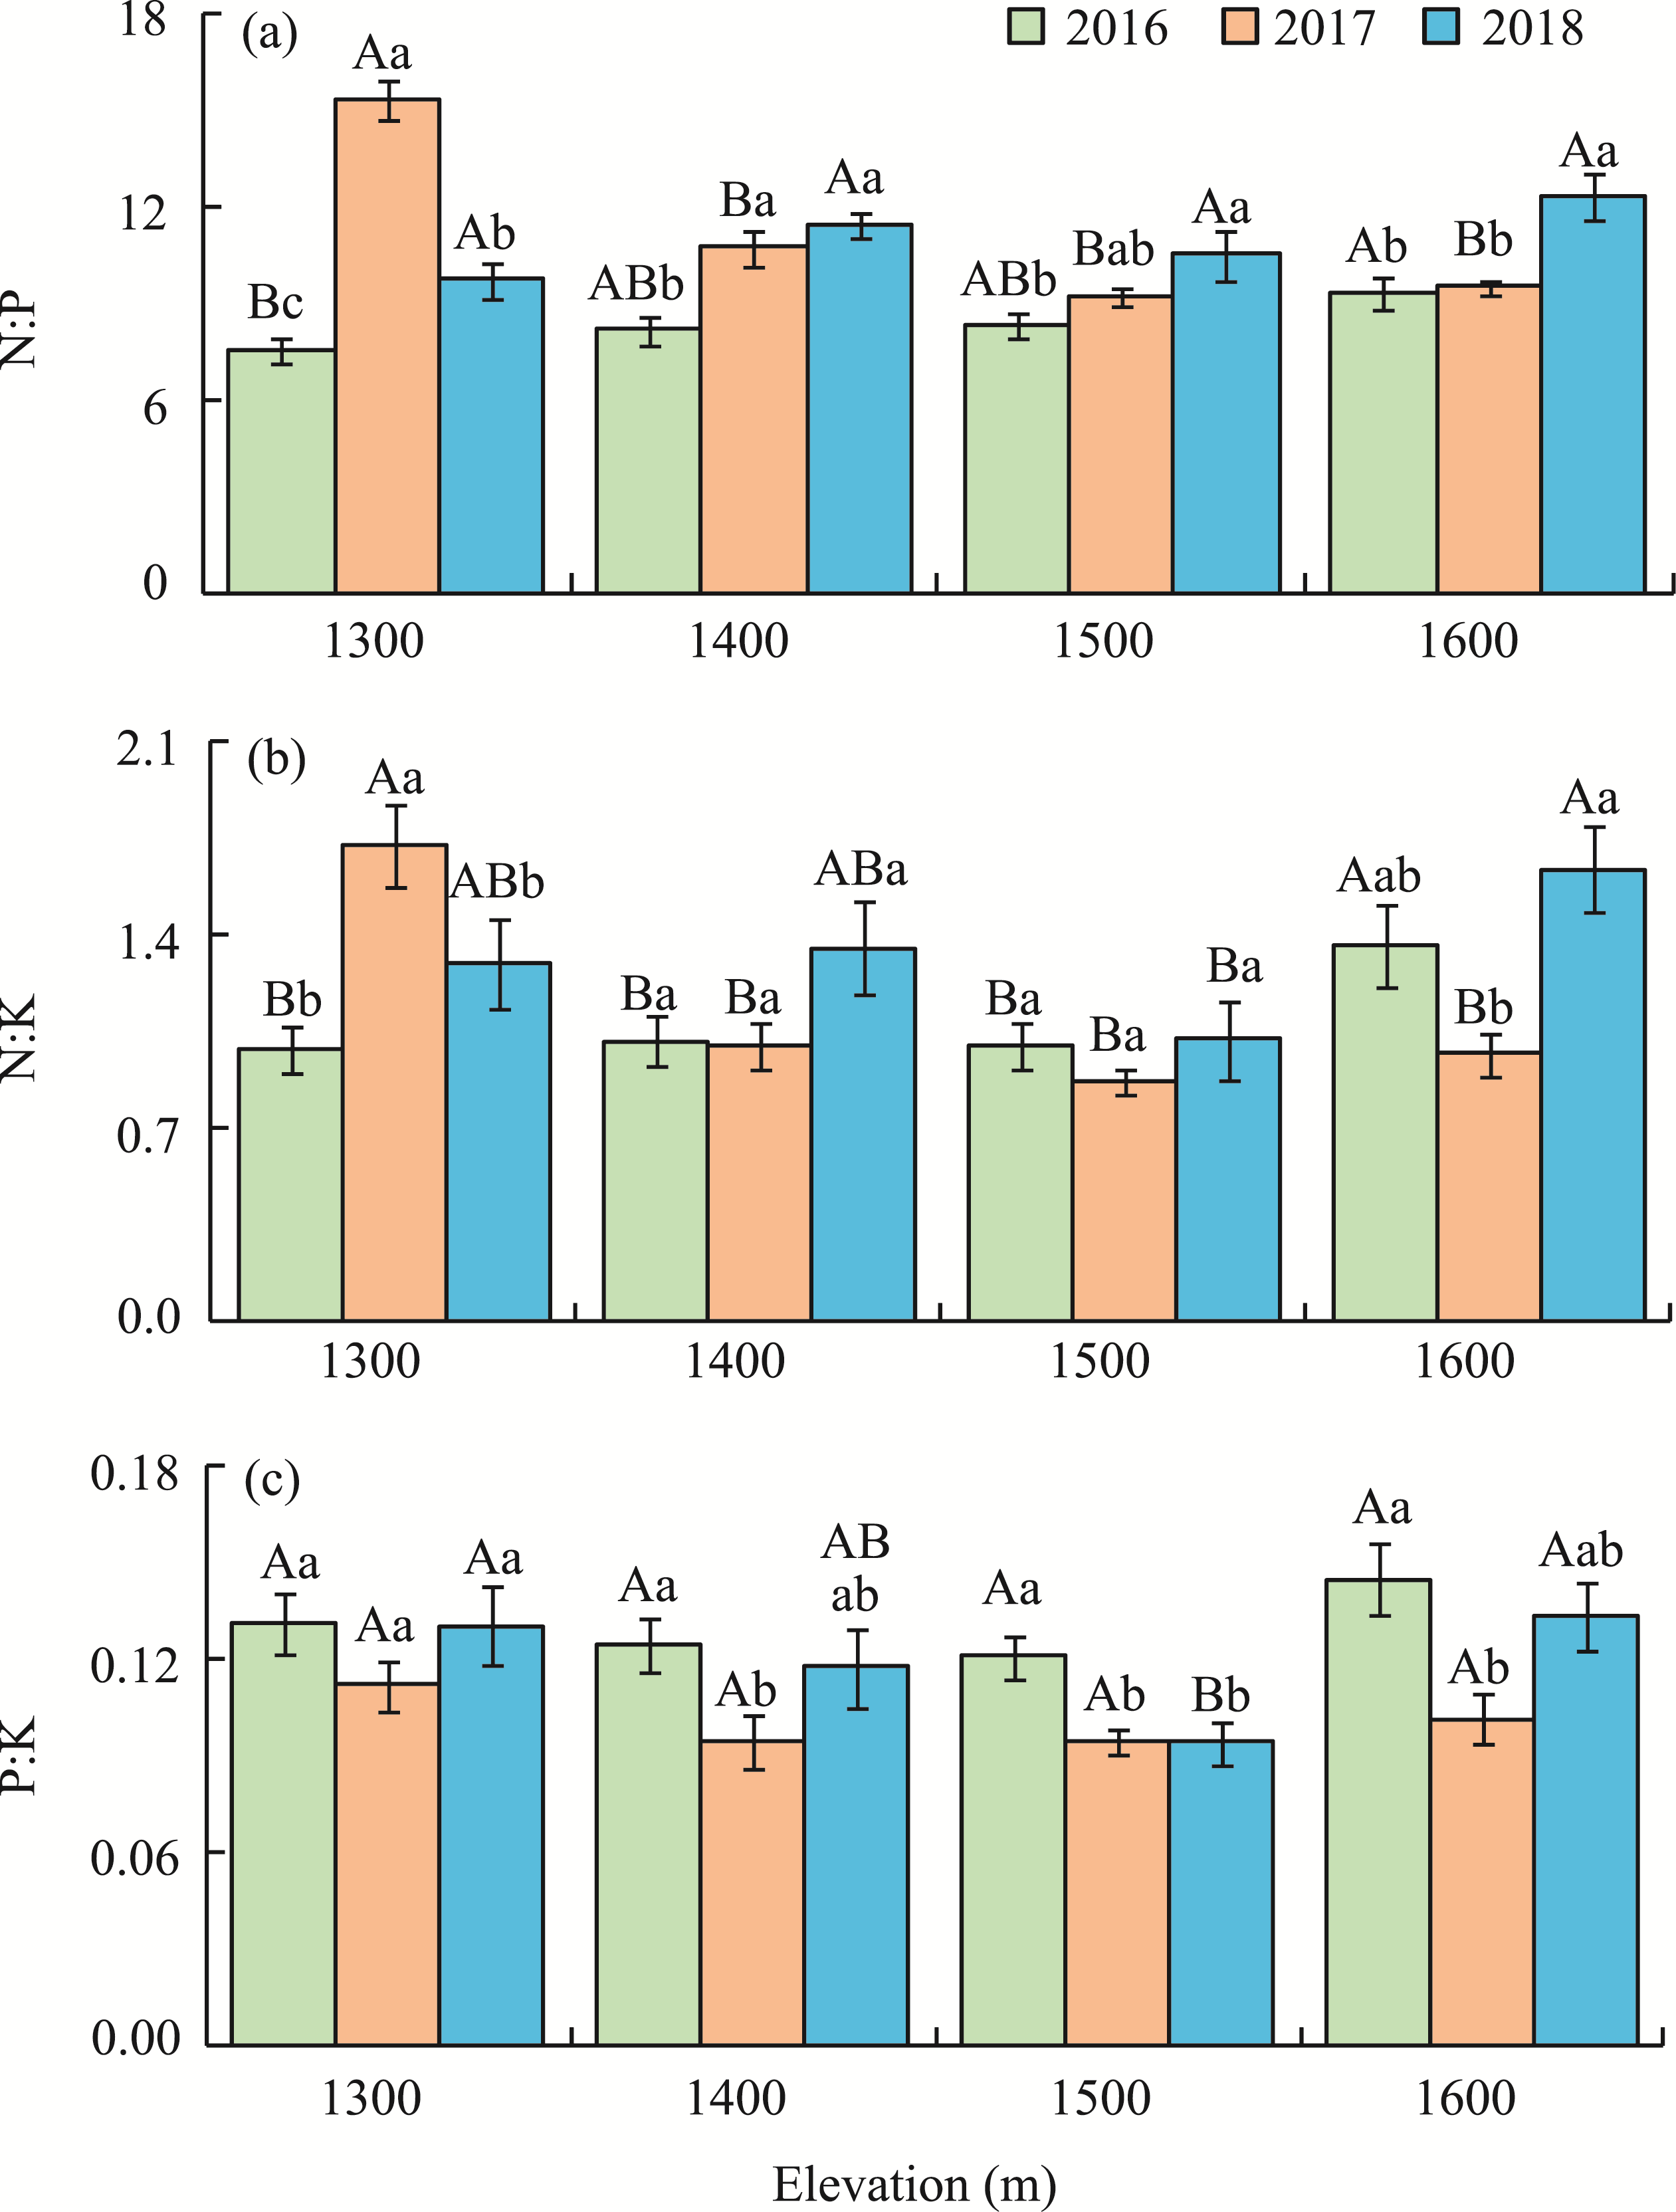
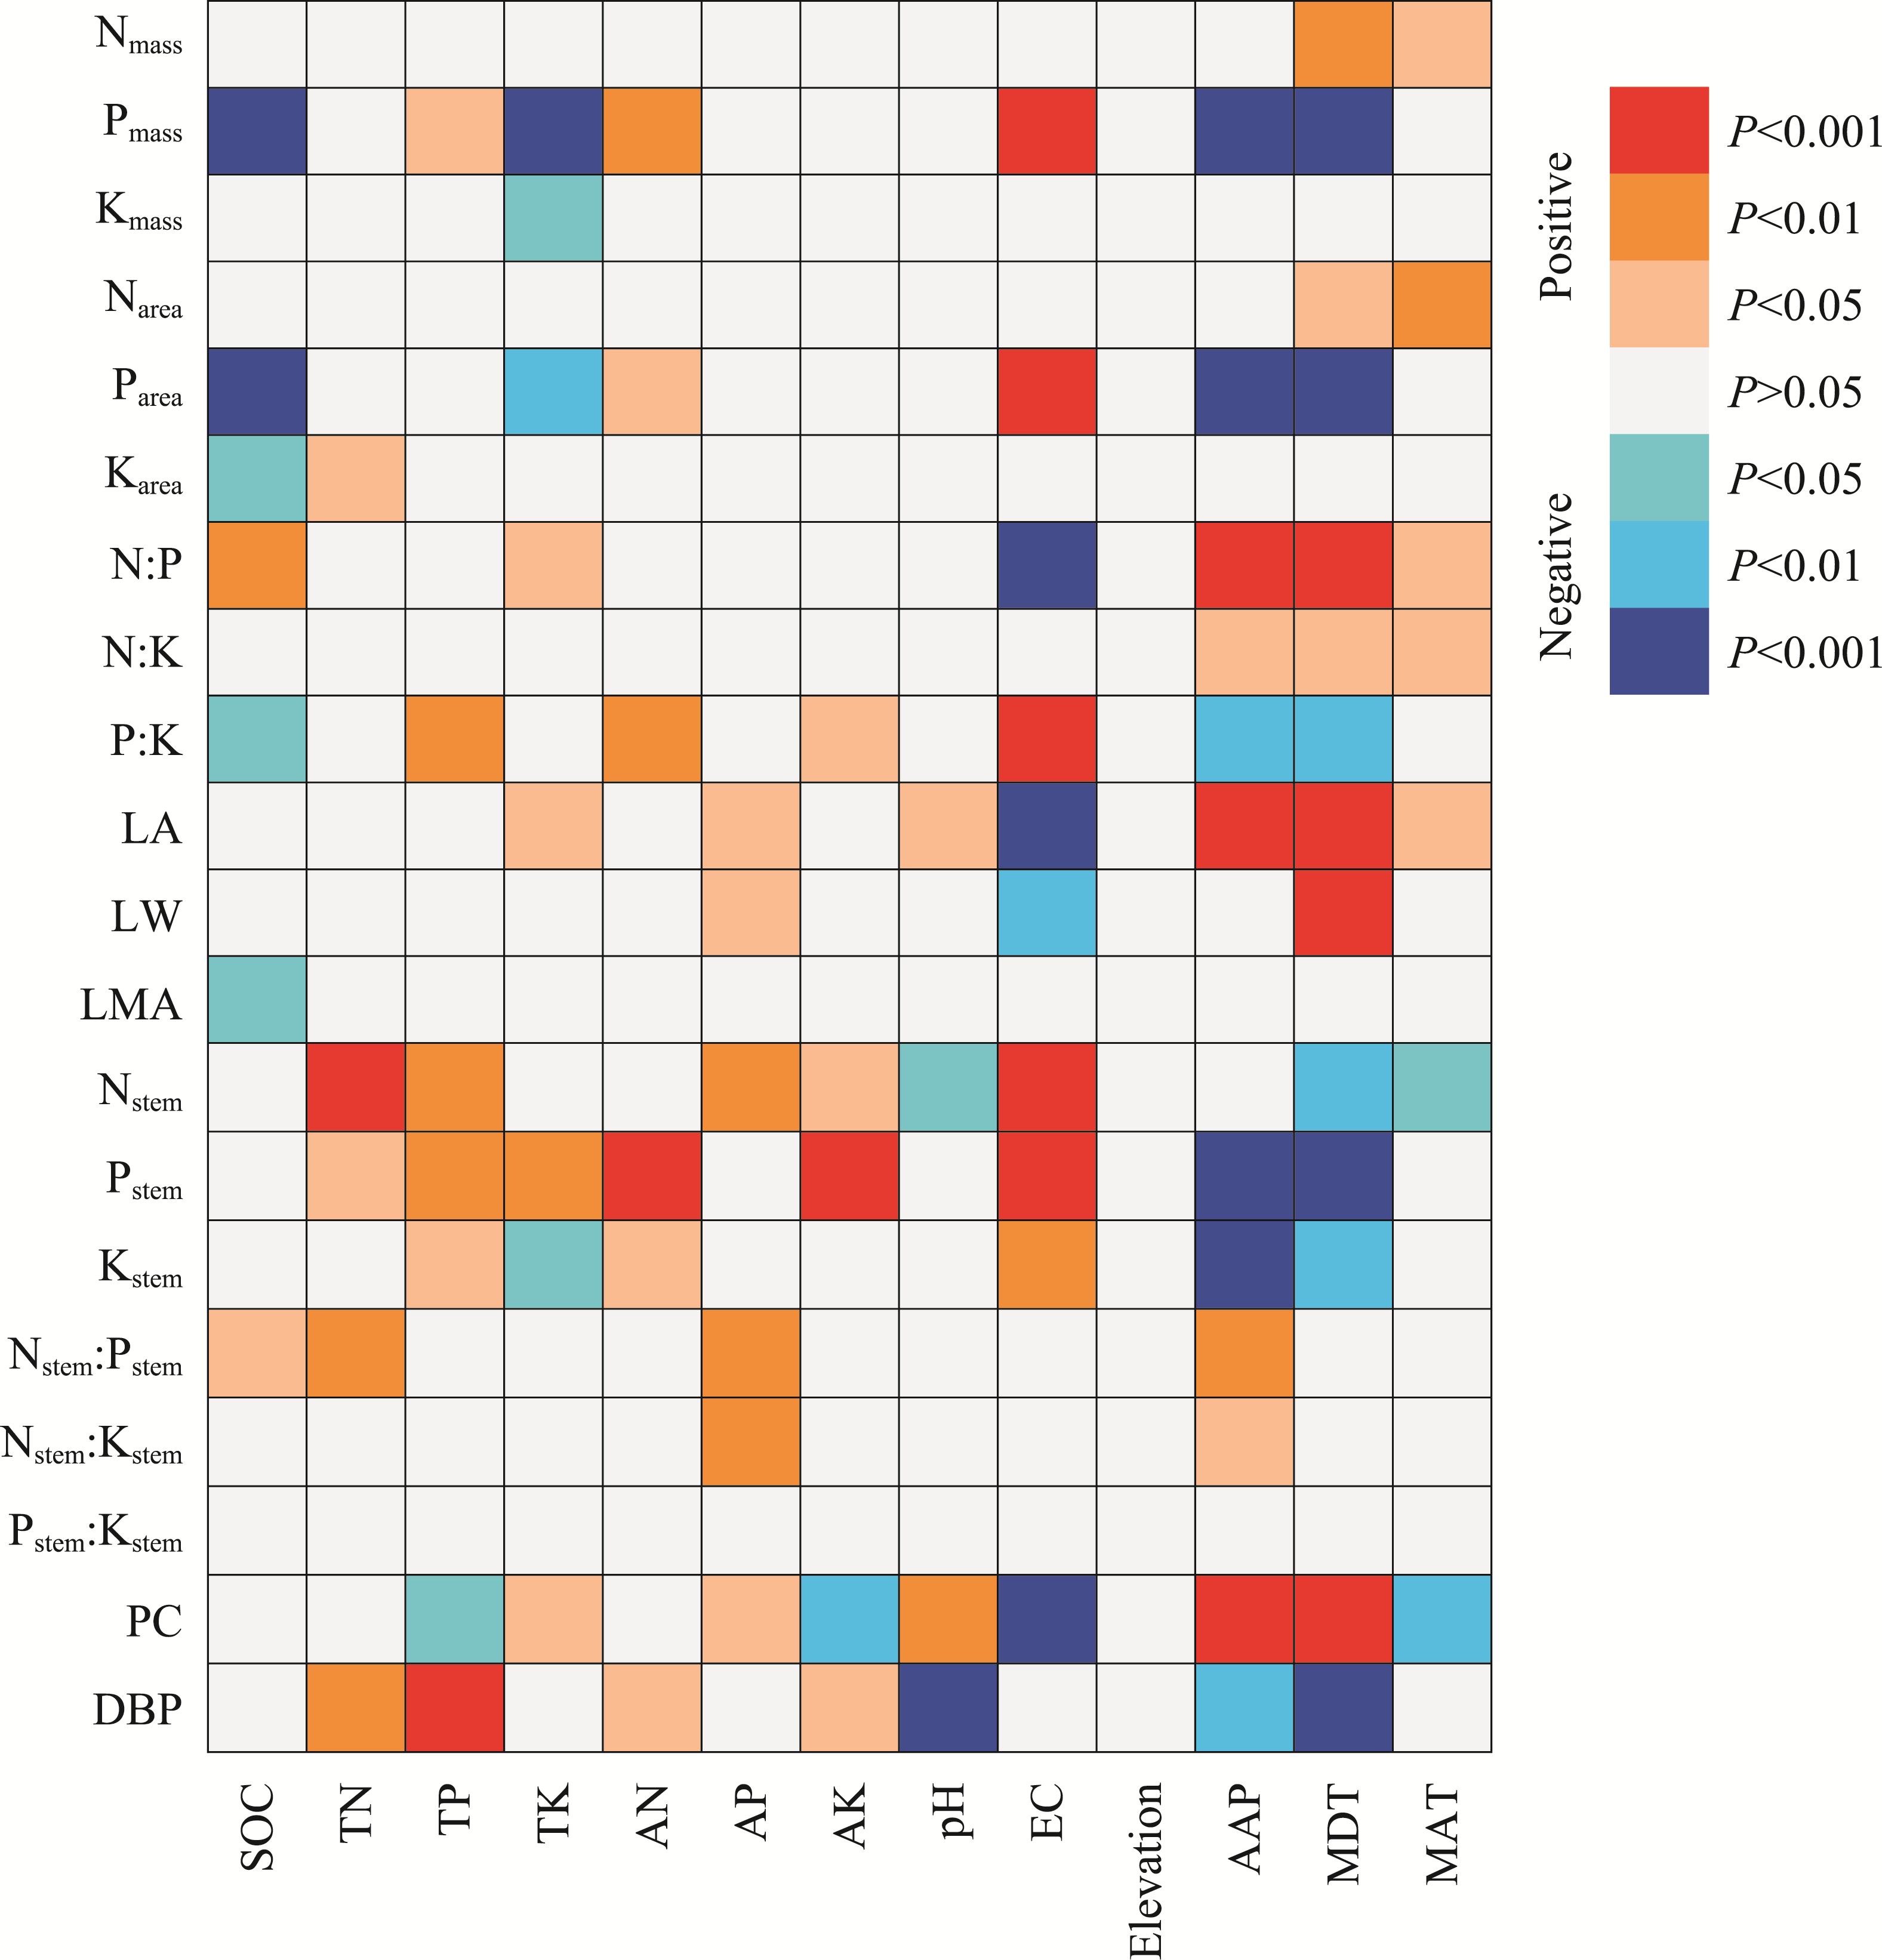
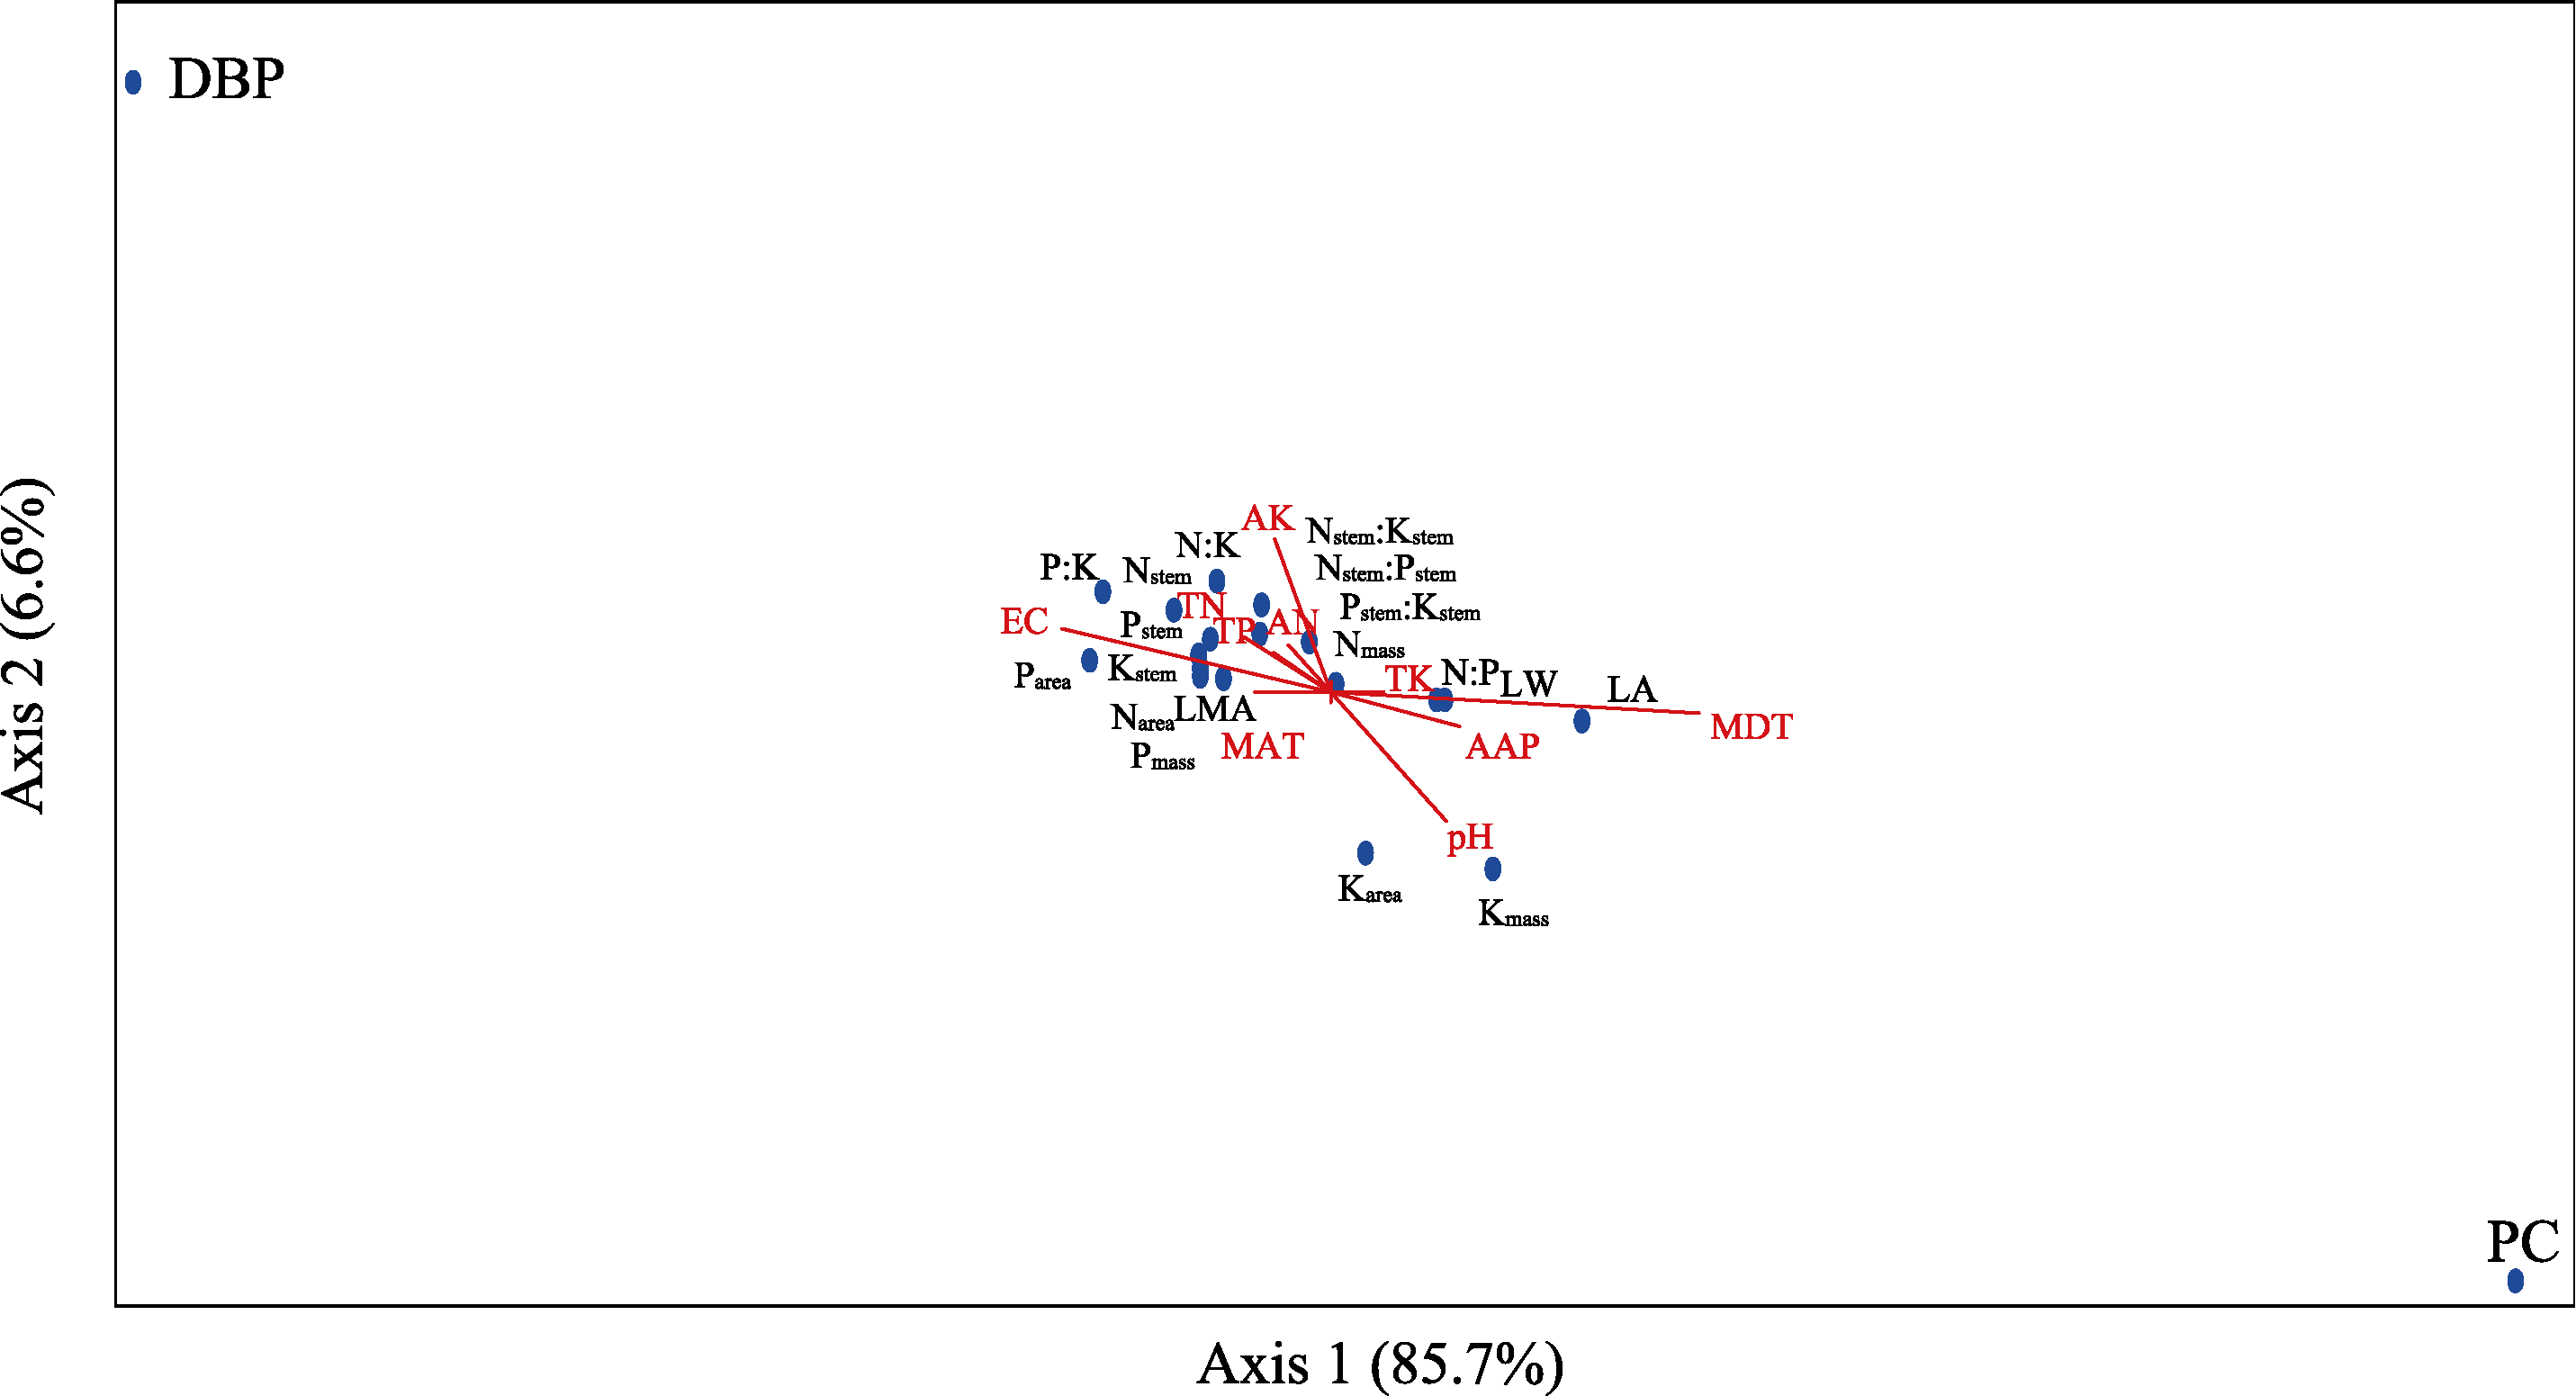
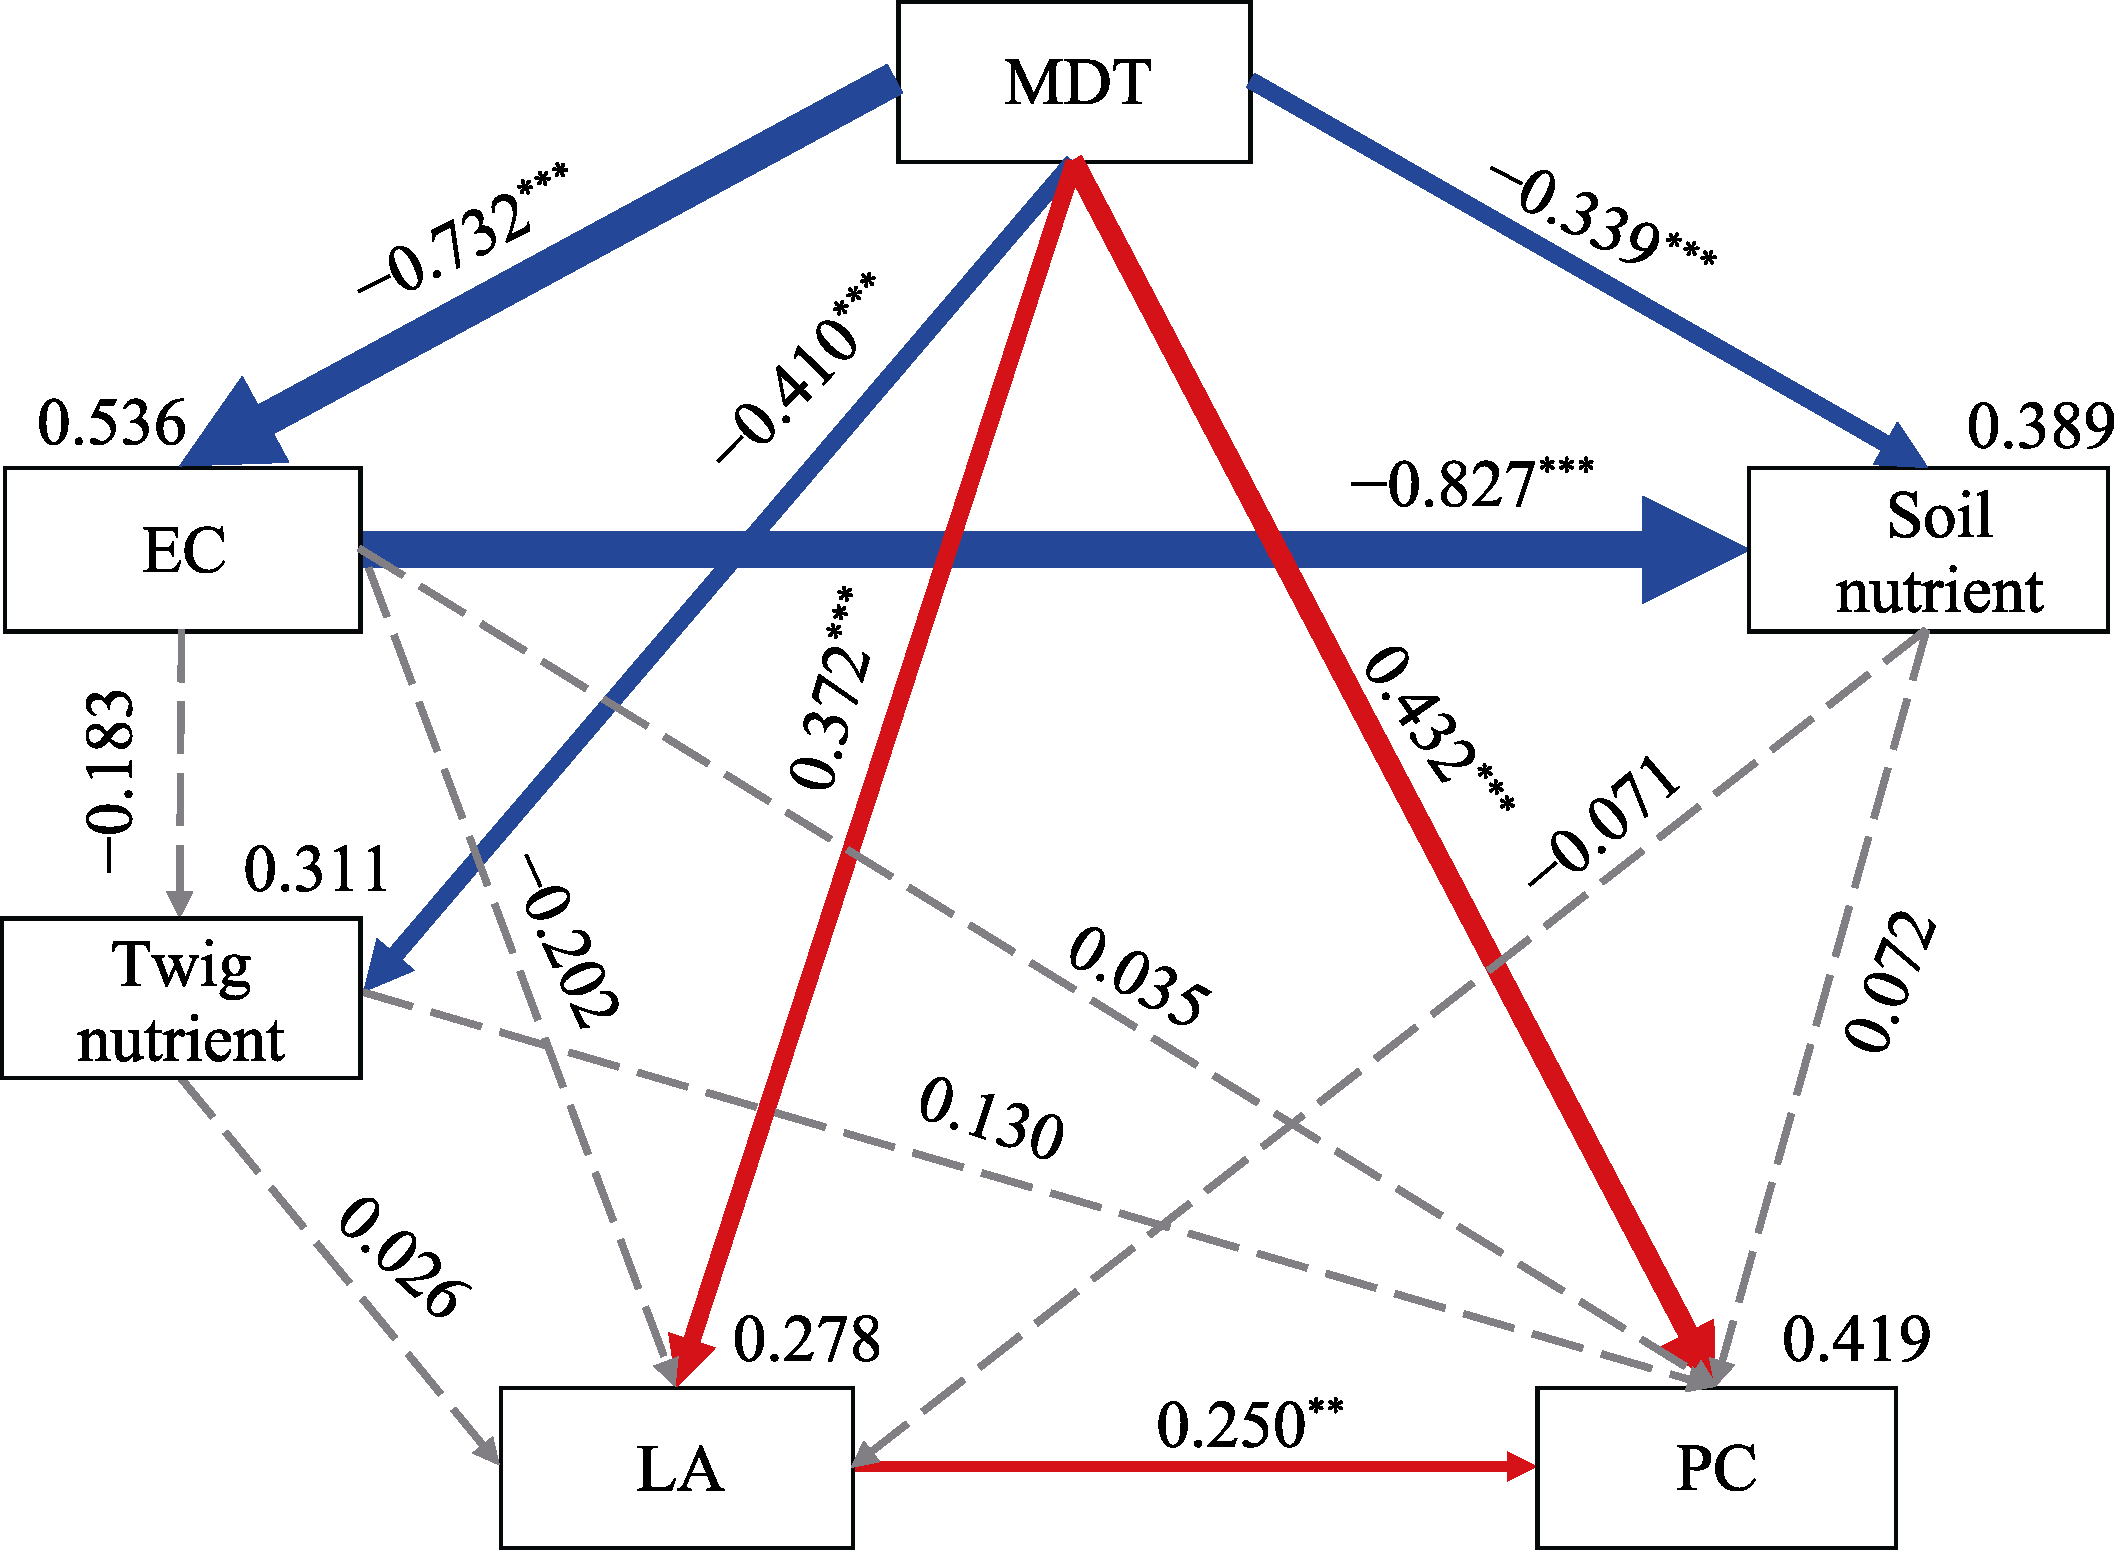
Abstract Malus sieversii (wild apple tree), only distributed in the Tianshan Mountains in Central Asia, is a tertiary relic species and an ancestral species of cultivated apples. However, existing natural populations of wild apple trees have been declining. To date, spatiotemporal variations in the growth status of declining wild apple trees and influencing factors in the narrow valley areas in the Tianshan Mountains remain unclear. In this study, field investigation and sampling were carried out in three years (2016-2018) at four elevations (1300, 1400, 1500, and 1600 m) in the Qiaolakesai Valley (a typical longitudinal narrow valley in the Yili River Valley) of the western Tianshan Mountains in Xinyuan County, Xinjiang Uygur Autonomous Region, China. Projective coverage, dead branch percentage, and 18 twig traits (these 20 parameters were collectively referred to as plant traits) were determined to comprehensively reflect the growth status of declining wild apple trees. The values of dead branch percentage ranged from 36% to 59%, with a mean of 40%. Year generally showed higher impact on plant traits than elevation. In 2017 and 2018, projective coverage, leaf size, leaf nitrogen concentration, and nitrogen to phosphorous ratio were markedly higher than those in 2016. However, dead branch percentage and leaf and stem phosphorous concentrations showed the opposite trend. Most of the topological parameters of plant trait networks differed in the three years, but the strength of trait-trait association increased year by year. The mean difference between day and night temperatures (MDT), annual accumulative precipitation, soil electrical conductivity, and soil pH had the greatest impact on the plant trait matrix. The growth status of declining wild apple trees was directly and positively affected by MDT and leaf size. In conclusion, the growth of declining wild apple trees distributed in the narrow valley areas was more sensitive to interannual environmental changes than elevation changes. The results are of great significance for further revealing the decline mechanism of wild apple trees in the Tianshan Mountains.
|
|
Received: 14 March 2022
Published: 31 December 2022
|
|
Corresponding Authors:
*ZHUANG Weiwei (E-mail: zww8611@sina.com);ZHANG Yuanming (E-mail: ymzhang@ms.xjb.ac.cn)
|
| About author: First author contact:The first and second authors contributed equally to this work. |
| Cite this article:
QIU Dong, TAO Ye, ZHOU Xiaobing, Bagila MAISUPOVA, YAN Jingming, LIU Huiliang, LI Wenjun, ZHUANG Weiwei, ZHANG Yuanming. Spatiotemporal variations in the growth status of declining wild apple trees in a narrow valley in the western Tianshan Mountains, China. Journal of Arid Land, 2022, 14(12): 1413-1439.
URL:
http://jal.xjegi.com/10.1007/s40333-022-0087-8 OR http://jal.xjegi.com/Y2022/V14/I12/1413
|
|
|
| [1] |
Bao S D. 2000. Analysis of Soil and Agrochemistry (3rd ed.). Beijing: China Agriculture Press,25-144. (in Chinese)
|
|
|
| [2] |
Cai J H, Wei X Y, Li J F, et al. 2018. The regulation and control of ambient temperature on growth rhythm of Lycoris radiata. Acta Agriculturae Universitatis Jiangxiensis, 40(1): 24-31. (in Chinese)
|
|
|
| [3] |
Chen C, Wang G J, Zhao Y, et al. 2016. Seasonal dynamics and allometric growth relationships of C, N, and P stoichiometry in the organs of Cunninghamia lanceolata from Huitong. Acta Ecologica Sinica, 36(23): 7614-7623. (in Chinese)
|
|
|
| [4] |
Chen F H, Huang W, Jin L Y, et al. 2011. Spatiotemporal precipitation variations in the arid Central Asia in the context of global warming. Science China-Earth Sciences, 54(12): 1812-1821.
doi: 10.1007/s11430-011-4333-8
|
|
|
| [5] |
Chen X S, Mao Z Q, Wang N, et al. 2021. Progress on evaluation, mining and utilization of germplasm resource of deciduous fruit trees in Xinjiang. Journal of Plant Genetic Resources, 2(6): 1483-1490. (in Chinese)
|
|
|
| [6] |
Cordell S, Goldstein G, Meinzer F C, et al. 1999. Allocation of nitrogen and carbon in leaves of Metrosideros polymorpha regulates carboxylation capacity and δ13C along an altitudinal gradient. Functional Ecology, 13(6): 811-818.
doi: 10.1046/j.1365-2435.1999.00381.x
|
|
|
| [7] |
Cui Z J, Zhang Y L, Zhang X, et al. 2019. Life history and mortality factors of Agrilus mali Matsumura (Coleoptera: Buprestidae) in wild apples in Northwestern China. Agricultural and Forest Entomology, 21(3): 309-317.
doi: 10.1111/afe.12333
|
|
|
| [8] |
Du B M, Ji H W, Liu C J. 2021. Nutrient resorption strategies of three oak tree species in response to interannual climate variability. Forest Ecosystems, 8: 70, doi: 10.1186/s40663-021-00350-8.
doi: 10.1186/s40663-021-00350-8
|
|
|
| [9] |
Duan N B, Bai Y, Sun H H, et al. 2017. Genome re-sequencing reveals the history of apple and supports a two-stage model for fruit enlargement. Nature Communications, 8: 249, doi: 10.1038/s41467-017-00336-7.
doi: 10.1038/s41467-017-00336-7
pmid: 28811498
|
|
|
| [10] |
Duursma R A, Falster D S, Valladares F, et al. 2012. Light interception efficiency explained by two simple variables: A test using a diversity of small- to medium-sized woody plants. New Phytologist, 193(2): 397-408.
doi: 10.1111/j.1469-8137.2011.03943.x
pmid: 22066945
|
|
|
| [11] |
Falster D S, Duursma R A, FitzJohn R G. 2018. How functional traits influence plant growth and shade tolerance across the life cycle. Proceedings of the National Academy of Sciences, 115(29): E6789-E6798.
|
|
|
| [12] |
Fang J Y, Shen Z H, Cui H T. 2004. Ecological characteristics of mountains and research issues of mountain ecology. Biodiversity Science, 12(1): 10-19. (in Chinese)
doi: 10.17520/biods.2004003
|
|
|
| [13] |
Flores-Moreno H, Fazayeli F, Banerjee A, et al. 2019. Robustness of trait connections across environmental gradients and growth forms. Global Ecology and Biogeography, 28(12): 1806-1826.
doi: 10.1111/geb.12996
|
|
|
| [14] |
Gong H D, Li Y Y, Yu T, et al. 2020. Soil and climate effects on leaf nitrogen and phosphorus stoichiometry along elevational gradients. Global Ecology and Conservation, 23: e01138, doi: 10.1016/j.gecco.2020.e01138.
doi: 10.1016/j.gecco.2020.e01138
|
|
|
| [15] |
Han W X, Fang J Y, Reich P, et al. 2011. Biogeography and variability of eleven mineral elements in plant leaves across gradients of climate, soil and plant functional type in China. Ecology Letters, 14 (8): 788-796.
doi: 10.1111/j.1461-0248.2011.01641.x
pmid: 21692962
|
|
|
| [16] |
He N P, Liu C C, Zhang J H, et al. 2018. Perspectives and challenges in plant traits: From organs to communities. Acta Ecologica Sinica, 38(19): 6787-6796. (in Chinese)
|
|
|
| [17] |
He N P, Li Y, Liu C C, et al. 2020. Plant trait networks: improved resolution of the dimensionality of adaptation. Trends Ecology and Evolution, 35(10): 908-918.
doi: 10.1016/j.tree.2020.06.003
|
|
|
| [18] |
He Y Y, Guo S L, Wang Z. 2019. Research progress of trade-off relationships of plant functional traits. Chinese Journal of Plant Ecology, 43(12): 1021-1035.
doi: 10.17521/cjpe.2019.0122
|
|
|
| [19] |
Hölscher D, Schmitt S, Kupfer K. 2002. Growth and leaf traits of four broad-leaved tree species along a hillside gradient. Forstwiss Centralbl, 121(5): 229-239.
doi: 10.1046/j.1439-0337.2002.02031.x
|
|
|
| [20] |
Hu R J. 2004. Physical Geography of the Tianshan Mountains in China. Beijing: China Environmental Publishing House,52-101. (in Chinese)
|
|
|
| [21] |
Kleyer M, Trinogga J, Cebrián-Piqueras M A, et al. 2019. Trait correlation network analysis identifies biomass allocation traits and stem specific length as hub traits in herbaceous perennial plants. Journal of Ecology, 107(2): 829-842.
doi: 10.1111/1365-2745.13066
|
|
|
| [22] |
Kline R B. 2010. Principles and Practice of Structural Equation Modeling (3rd ed.). New York: Guilford Press,231-365.
|
|
|
| [23] |
Koerselman W, Meuleman A F. 1996. The vegetation N:P ratio: A new tool to detect the nature of nutrient limitation. Journal of Applied Ecology, 33(6): 1441-1450.
doi: 10.2307/2404783
|
|
|
| [24] |
Lambers H, Chapin F S, Pons T L. 2008. Plant Physiological Ecology (2nd ed.). New York: Springer,11-90.
|
|
|
| [25] |
Lambers H. 2022. Phosphorus acquisition and utilization in plants. Annual Review of Plant Biology, 73: 17-42.
doi: 10.1146/annurev-arplant-102720-125738
|
|
|
| [26] |
Lebrija-Trejos E, Pérez-García E A, Meave J A, et al. 2010. Functional traits and environmental filtering drive community assembly in a species-rich tropical system. Ecology, 91(2): 386-398.
pmid: 20392004
|
|
|
| [27] |
Li H W, Li Z, Chen Y N, et al. 2021. Projected meteorological drought over Asian drylands under different CMIP6 scenarios. Remote Sensing, 13(21): 4409, doi: 10.3390/rs13214409.
doi: 10.3390/rs13214409
|
|
|
| [28] |
Li X, Pei K, Kéry M, et al. 2017. Decomposing functional trait associations in a Chinese subtropical forest. PLoS ONE, 12(4): e0175727, doi: 10.1371/journal.pone.0175727.
doi: 10.1371/journal.pone.0175727
|
|
|
| [29] |
Li X F, Li L, Chang Y P, et al. 2019. Stoichiometric characteristics of leaf C and N and their correlation with soil physicochemical factors in Picea Schrenkiana forests. Arid Land Geography, 42(3): 599-605. (in Chinese)
|
|
|
| [30] |
Li Y, Liu C C, Xu L, et al. 2021. Leaf trait networks based on global data: representing variation and adaptation in plants. Frontiers in Plant Science, 12: 2728, doi: 10.3389/fpls.2021.710530.
doi: 10.3389/fpls.2021.710530
|
|
|
| [31] |
Li Y, Liu C C, Sack L, et al. 2022. Leaf trait network architecture shifts with species-richness and climate across forests at continental scale. Ecology Letters, 25(6): 1442-1457.
doi: 10.1111/ele.14009
|
|
|
| [32] |
Li Y Q, Wang Z H. 2021. Leaf morphological traits: Ecological function, geographic distribution and drivers. Chinese Journal of Plant Ecology, 45(10): 1154-1172.
doi: 10.17521/cjpe.2020.0405
|
|
|
| [33] |
Liao L, Zhang W H, Zhang B, et al. 2021. Unraveling a genetic roadmap for improved taste in the domesticated apple. Molecular Plant, 14(9): 1454-1471.
doi: 10.1016/j.molp.2021.05.018
pmid: 34022440
|
|
|
| [34] |
Liu X J, Ma K P. 2015. Plant functional traits-concepts, applications and future directions. Scientia Sinica Vitae, 45(4): 325-339.
doi: 10.1360/N052014-00244
|
|
|
| [35] |
Liu X Y, He P, Jin J Y. 2006. Advances in effect of potassium nutrition on plant disease resistance and its mechanism. Plant Nutrition and Fertilizer Science, 12(3): 445-450. (in Chinese)
|
|
|
| [36] |
Lo'ay A A, EL-Ezz S F A, Awadeen A A. 2021. Effect of different foliar potassium fertilization forms on vegetative growth, yield, and fruit quality of kaki trees grown in sandy soil. Scientia Horticulturae, 288: 110420, doi: 10.1016/j.scienta.2021.110420.
doi: 10.1016/j.scienta.2021.110420
|
|
|
| [37] |
Luo Y, Peng Q W, Li K H, et al. 2021. Patterns of nitrogen and phosphorus stoichiometry among leaf, stem and root of desert plants and responses to climate and soil factors in Xinjiang. CATENA, 199: 105100, doi: 10.1016/j.catena.2020.105100.
doi: 10.1016/j.catena.2020.105100
|
|
|
| [38] |
Lusk C H, Grierson E R P, Laughlin D C. 2019. Large leaves in warm, moist environments confer an advantage in seedling light interception efficiency. New Phytologit, 223(3): 1319-1327.
|
|
|
| [39] |
Maliníková E, Kukla J, Kuklová M, et al. 2013. Altitudinal variation of plant traits: Morphological characteristics in Fragaria vesca L. (Rosaceae). Annals of Forest Research, 56(1): 79-89.
|
|
|
| [40] |
McCune B, Mefford M J. 2011. PC-ORD. Multivariate Analysis of Ecological Data (Version 6). MjM Software, Gleneden Beach, Oregon, USA.
|
|
|
| [41] |
Mendes M R A, Silva Júnior M C, Castro A A J F, et al. 2014. Temporal change in species and functional plant traits in the moist grassland on the Sete Cidades National Park, Piauí, Brazil. Brazilian Journal of Biology, 74(1): 111-123.
doi: S1519-69842014000100111
pmid: 25055092
|
|
|
| [42] |
Milla R, Reich P B. 2007. The scaling of leaf area and mass: The cost of light interception increases with leaf size. Proceedings of the Royal Society B-Biological Sciences, 274(1622): 2109-2114.
|
|
|
| [43] |
Niinements U, Portsmuth A, Tobias M. 2006. Leaf size modifies support biomass distribution among stems, petioles and mid-ribs in temperate plants. New Phytologist, 171(1): 91-104.
pmid: 16771985
|
|
|
| [44] |
Pankova E I, Konyushkova M V. 2013. Climate and soil salinity in the deserts of Central Asia. Eurasian Soil Science, 46(7): 721-727.
doi: 10.1134/S1064229313070065
|
|
|
| [45] |
Pei Y, Zhang C S, Tian S J, et al. 2018. Effect of different diurnal temperature changes on bolting and flowering properties of radish (Raphanus sativus L.). Northern Horticulture, 42(11): 1-8. (in Chinese)
|
|
|
| [46] |
Pellissier L, Fournier B, Vittoz G P. 2010. Plant traits co-vary with altitude in grasslands and forests in the European Alps. Plant Ecology, 211(2): 351-365.
doi: 10.1007/s11258-010-9794-x
|
|
|
| [47] |
Pérez-Camacho L, Rebollo S, Hernández-Santana V, et al. 2012. Plant functional trait responses to interannual rainfall variability, summer drought and seasonal grazing in Mediterranean herbaceous communities. Functional Ecology, 26(3): 740-749.
doi: 10.1111/j.1365-2435.2012.01967.x
|
|
|
| [48] |
Rao Q Y, Su H J, Ruan L W, et al. 2022. Phosphorus enrichment affects trait network topologies and the growth of submerged macrophytes. Environmental Pollution, 292(Part A): 118331, doi: 10.1016/j.envpol.2021.118331.
doi: 10.1016/j.envpol.2021.118331
|
|
|
| [49] |
Reich P B, Oleksyn J. 2004. Global patterns of plant leaf N and P in relation to temperature and latitude. Proceedings of the National Academy of Sciences, 101(30): 11001-11006.
|
|
|
| [50] |
Richmond I C, Leroux S J, Heckford T R, et al. 2021. Temporal variation and its drivers in the elemental traits of four boreal plant species. Journal of Plant Ecology, 14(3): 398-413.
doi: 10.1093/jpe/rtaa103
|
|
|
| [51] |
Ru H L, Zhang H D, Jiao F, et al. 2016. Plant and soil C, N, P stoichiometric characteristics in relation to micro-topography in the Hilly Loess Plateau region, China. Journal of Natural Resources, 31(10): 1752-1763. (in Chinese)
|
|
|
| [52] |
Scheepens J F, Frei E S, Stöcklin J. 2010. Genotypic and environmental variation in specific leaf area in a widespread alpine plant after transplantation to different altitudes. Oecologia, 164(1): 141-150.
doi: 10.1007/s00442-010-1650-0
pmid: 20461412
|
|
|
| [53] |
Smith D D, Sperry J S, Adler F R. 2017. Convergence in leaf size versus twig leaf area scaling: Do plants optimize leaf area partitioning? Annuls of Botany, 119(3): 447-456.
|
|
|
| [54] |
Soethe N, Lehmann J, Engels C. 2008. Nutrient availability at different altitudes in a tropical montane forest in Ecuador. Journal of Tropical Ecology, 24(4): 397-406.
doi: 10.1017/S026646740800504X
|
|
|
| [55] |
Song L L, Fan J W, Wu S H. 2011. Research advances on changes of leaf traits along an altitude gradient. Progress in Geography, 30(11): 1431-1439. (in Chinese)
doi: 10.11820/dlkxjz.2011.11.014
|
|
|
| [56] |
Spengler R N. 2019. Origins of the apple: The role of megafaunal mutualism in the domestication of Malus and Rosaceous trees. Frontiers in Plant Science, 10: 617, doi: 10.3389/fpls.2019.00617.
doi: 10.3389/fpls.2019.00617
|
|
|
| [57] |
Sterner R W, Elser J J. 2002. Ecological Stoichiometry: The Biology of Elements from Molecules to the Biosphere. Princeton: Princeton University Press,44-78.
|
|
|
| [58] |
Su Z H, Li W J, Cao Q M, et al. 2019. Age composition and quantitative dynamic status of Malus sieversii population. Arid Zone Research, 36(5): 1153-1160. (in Chinese)
|
|
|
| [59] |
Sunoj V S J, Shroyer K J, Jagadish S V K, et al. 2016. Diurnal temperature amplitude alters physiological and growth response of maize (Zea mays L.) during the vegetative stage. Environmental and Experimental Botany, 130: 113-121.
doi: 10.1016/j.envexpbot.2016.04.007
|
|
|
| [60] |
Sunoj V S J, Prasad P V V, Ciampitti I A, et al. 2020. Narrowing diurnal temperature amplitude alters carbon tradeoff and reduces growth in C4 crop sorghum. Frontiers in Plant Science, 11: 1262, doi: 10.3389/fpls.2020.01262.
doi: 10.3389/fpls.2020.01262
pmid: 32973831
|
|
|
| [61] |
Tao Y, Nuerhailati M, Zhang Y M, et al. 2020. Influence of branch death on leaf nutrient status and stoichiometry of wild apple trees (Malus sieversii) in the Western Tianshan Mountains, China. Polish Journal of Ecology, 68(4): 296-312.
|
|
|
| [62] |
Tian D, Yan Z B, Niklas K J, et al. 2018. Global leaf nitrogen and phosphorus stoichiometry and their scaling exponent. National Science Review, 5(5): 728-739.
doi: 10.1093/nsr/nwx142
|
|
|
| [63] |
van de Weg M J, Meir P, Grace J, et al. 2009. Altitudinal variation in leaf mass per unit area, leaf tissue density and foliar nitrogen and phosphorus content along an Amazon-Andes gradient in Peru. Plant Ecology and Diversity, 2(3): 243-254.
doi: 10.1080/17550870903518045
|
|
|
| [64] |
Wang A, Xue W, Tognetti R, et al. 2018. Elevation alters carbon and nutrient concentrations and stoichiometry in Quercus aquifolioides in southwestern China. Science of the Total Environment, 622-623: 1463-1475.
|
|
|
| [65] |
Wang C S, Wang S P. 2015. A review of research on responses of leaf traits to climate change. Chinese Journal of Plant Ecology, 39(2): 206-216. (in Chinese)
doi: 10.17521/cjpe.2015.0020
|
|
|
| [66] |
Wang N, Jiang S H, Zhang Z Y, et al. 2018. Malus sieversii: the origin, flavonoid synthesis mechanism, and breeding of red-skinned and red-fleshed apples. Horticulture Research, 5: 70, doi: 10.1038/s41438-018-0084-4.
doi: 10.1038/s41438-018-0084-4
pmid: 30345062
|
|
|
| [67] |
Wang Y D, Wei I S, Zhou M, et al. 2021. Ecological of stoichiometric characteristics of Populus davidiana forests with different growth and decline degrees in southern Daxing'anling. Chinese Journal of Soil Science, 52(4): 854-864. (in Chinese)
|
|
|
| [68] |
Westoby M, Falster D S, Moles A T, et al. 2002. Plant ecological strategies: Some leading dimensions of variation between species. Annual Review of Ecology Evolution and Systematics, 33(1): 125-159.
|
|
|
| [69] |
Westoby M, Wright I J. 2003. The leaf size-twig size spectrum and its relationship to other important spectra of variation among species. Oecologia, 135(4): 621-628.
pmid: 16228258
|
|
|
| [70] |
Wright I J, Reich P B, Westoby M, et al. 2004. The world-wide leaf economics spectrum. Nature, 428(6985): 821-827.
doi: 10.1038/nature02403
|
|
|
| [71] |
Xiong J W. 2017. Comprehensive Scientific Investigation of the Western Tianshan Mountains in Xinjiang. Beijing: China Forestry Press,1-128. (in Chinese)
|
|
|
| [72] |
Yan G R, Xu Z. 2010. Study on the Wild Fruit Trees in Xinjiang, China. Beijing: China Forestry Publishing House,1-48. (in Chinese)
|
|
|
| [73] |
Yan J M, Zhou X B, Tao Y, et al. 2021. Variation in one-year-old branch stoichiometry of Malus sieversii at different altitudes and the influencing factors in Tianshan Mountains, China. Arid Zone Research, 38(2): 450-459. (in Chinese)
|
|
|
| [74] |
Yan J M, Li Y G, Maisupova B, et al. 2022. Effects of growth decline on twig functional traits of wild apple trees in two long-term monitoring plots in Yili Valley: Implication for their conservation. Global Ecology and Conservation, 33: e01998, doi: 10.1016/j.gecco.2021.e01998.
doi: 10.1016/j.gecco.2021.e01998
|
|
|
| [75] |
Yang D M, Niklas K J, Xiang S, et al. 2010. Size-dependent leaf area ratio in plant twigs: Implication for leaf size optimization. Annuals of Botany, 105(1): 71-77.
doi: 10.1093/aob/mcp262
|
|
|
| [76] |
Yang S Q, Zhao X J, Sen D, et al. 2017. Leaf C, N and P chemometries and their altitudinal variations in the central Tianshan Mountains. Arid Zone Research, 34(6): 1371-1379. (in Chinese)
|
|
|
| [77] |
Yao F Y, Chen Y H, Yan Z B, et al. 2015. Biogeographic patterns of structural traits and C:N:P stoichiometry of tree twigs in China's forests. PLoS ONE, 10: e0116391, doi: 10.1371/journal.pone.0116391.
doi: 10.1371/journal.pone.0116391
|
|
|
| [78] |
Zang Y X, Min X J, de Dios V R, et al. 2020. Extreme drought affects the productivity, but not the composition, of a desert plant community in Central Asia differentially across microtopographies. Science of the Total Environment, 717: 137251, doi: 10.1016/j.scitotenv.2020.137251.
doi: 10.1016/j.scitotenv.2020.137251
|
|
|
| [79] |
Zar J H. 2009. Biostatistical Analysis (5th ed.). Upper Saddle River, NJ: Prentice Hall, 91-293.
|
|
|
| [80] |
Zhang D, Wang C, Li X L, et al. 2017. Linking plant ecological stoichiometry with soil nutrient and bacterial communities in apple orchards. Applied Soil Ecology, 128: 1-10.
doi: 10.1016/j.apsoil.2018.03.015
|
|
|
| [81] |
Zhang D Y, Peng Y F, Li F, et al. 2021. Changes in above-/below-ground biodiversity and plant functional composition mediate soil respiration response to nitrogen input. Functinal Ecology, 35(5): 1171-1182.
|
|
|
| [82] |
Zhang H X, Zhang M L, Ma L N. 2015. Genetic structure and historical demography of Malus sieversii in the Yili Valley and the western mountains of the Junggar Basin, Xinjiang, China. Journal of Arid Land, 7(2): 264-271.
doi: 10.1007/s40333-014-0044-2
|
|
|
| [83] |
Zhang H X, Zheng T Y. 2020. Effects of elevation on population genetic characteristics of Malus sieversii. Chinese Journal of Ecology, 39(12): 4031-4037. (in Chinese)
|
|
|
| [84] |
Zhang H X, Li X S, Wang J C, et al. 2021. Insights into the aridification history of Central Asian Mountains and international conservation strategy from the endangered wild apple tree. Journal of Biogeography, 48(2): 332-344.
doi: 10.1111/jbi.13999
|
|
|
| [85] |
Zhang K Y, Yang D, Zhang Y B, et al. 2021. Differentiation in stem and leaf traits among sympatric lianas, scandent shrubs and trees in a subalpine cold temperate forest. Tree Physiology, 41(11): 1992-2003.
doi: 10.1093/treephys/tpab049
|
|
|
| [86] |
Zhang P, Lyu Z Z, Zhang X, et al. 2019. Age structure of Malus sieversii population in Ili of Xinjiang and Kazakhstan. Arid Zone Research, 36(4): 844-853. (in Chinese)
|
|
|
| [87] |
Zhang P, Cui Z J, Xu H, et al. 2020. Thirst or malnutrition: The impacts of invasive insect Agrilus mali on the physiological status of wild apple trees. Forests, 11(4): 440, doi: 10.3390/f11040440.
doi: 10.3390/f11040440
|
|
|
| [88] |
Zhang X, Zhang Y L, Zhang P, et al. 2021. Agrilus mali Matsumura (Coleoptera: Buprestidae) density and damage in wild apple Malus sieversii (Rosales: Rosaceae) forests in Central Eurasia under four different management strategies. Entomologia Generalis, 41(3): 257-266.
doi: 10.1127/entomologia/2021/0974
|
|
|
| [89] |
Zhang X F, Liu X D, Jing W M, et al. 2019. Characteristics of Leontopodium leontopodioides leaf stoichiometry with altitude and their relationship with soil nutrients in Qilian Mountains, Northwest China. Chinese Journal of Applied Ecology, 30(12): 4012-4020. (in Chinese)
|
|
|
| [90] |
Zhang X S. 1973. On the eco-geographical characters and the problems of classification of the wild fruit-tree forest in the Ili Valley of Sinkiang. Acta Botanica Sinica, 15(2): 239-253. (in Chinese)
|
|
|
| [91] |
Zhu J B, He H D, Zhang F W, et al. 2020. Effect of temperature difference between day and night on NEE and its variation charactristics in Alpine shrubland in Qinghai-Tibetan Plateau. Research of Soil and Water Conservation, 27(4): 232-238. (in Chinese)
|
|
|
| [92] |
Zhu Y K, Zhang J T, Zhang Y Q, et al. 2019. Responses of vegetation to climatic variations in the desert region of northern China. CATENA, 175: 27-36.
doi: 10.1016/j.catena.2018.12.007
|
|
|
|
Viewed |
|
|
|
Full text
|
|
|
|
|
Abstract
|
|
|
|
|
Cited |
|
|
|
|
| |
Shared |
|
|
|
|
| |
Discussed |
|
|
|
|