| Research article |
|


|
|
|
| Spatiotemporal distribution characteristics of clear-sky downward surface shortwave radiation in Xinjiang |
HUANG Guan1, CHEN Yonghang2, WANG Pengtao1,*( ), FAN Ting1, HE Qing3, SHAO Weiling4, SUN Linlin2 ), FAN Ting1, HE Qing3, SHAO Weiling4, SUN Linlin2 |
1College of Tourism, Xi'an International Studies University, Xi'an 710128, China
2College of Environmental Science and Engineering, Donghua University, Shanghai 201620, China
3Taklimakan Desert Meteorology Field Experiment Station of CMA, Institute of Desert Meteorology, China Meteorological Administration (CMA), Urumqi 830002, China
4Xinjiang Climate Center, Urumqi 830002, China |
|
|
|
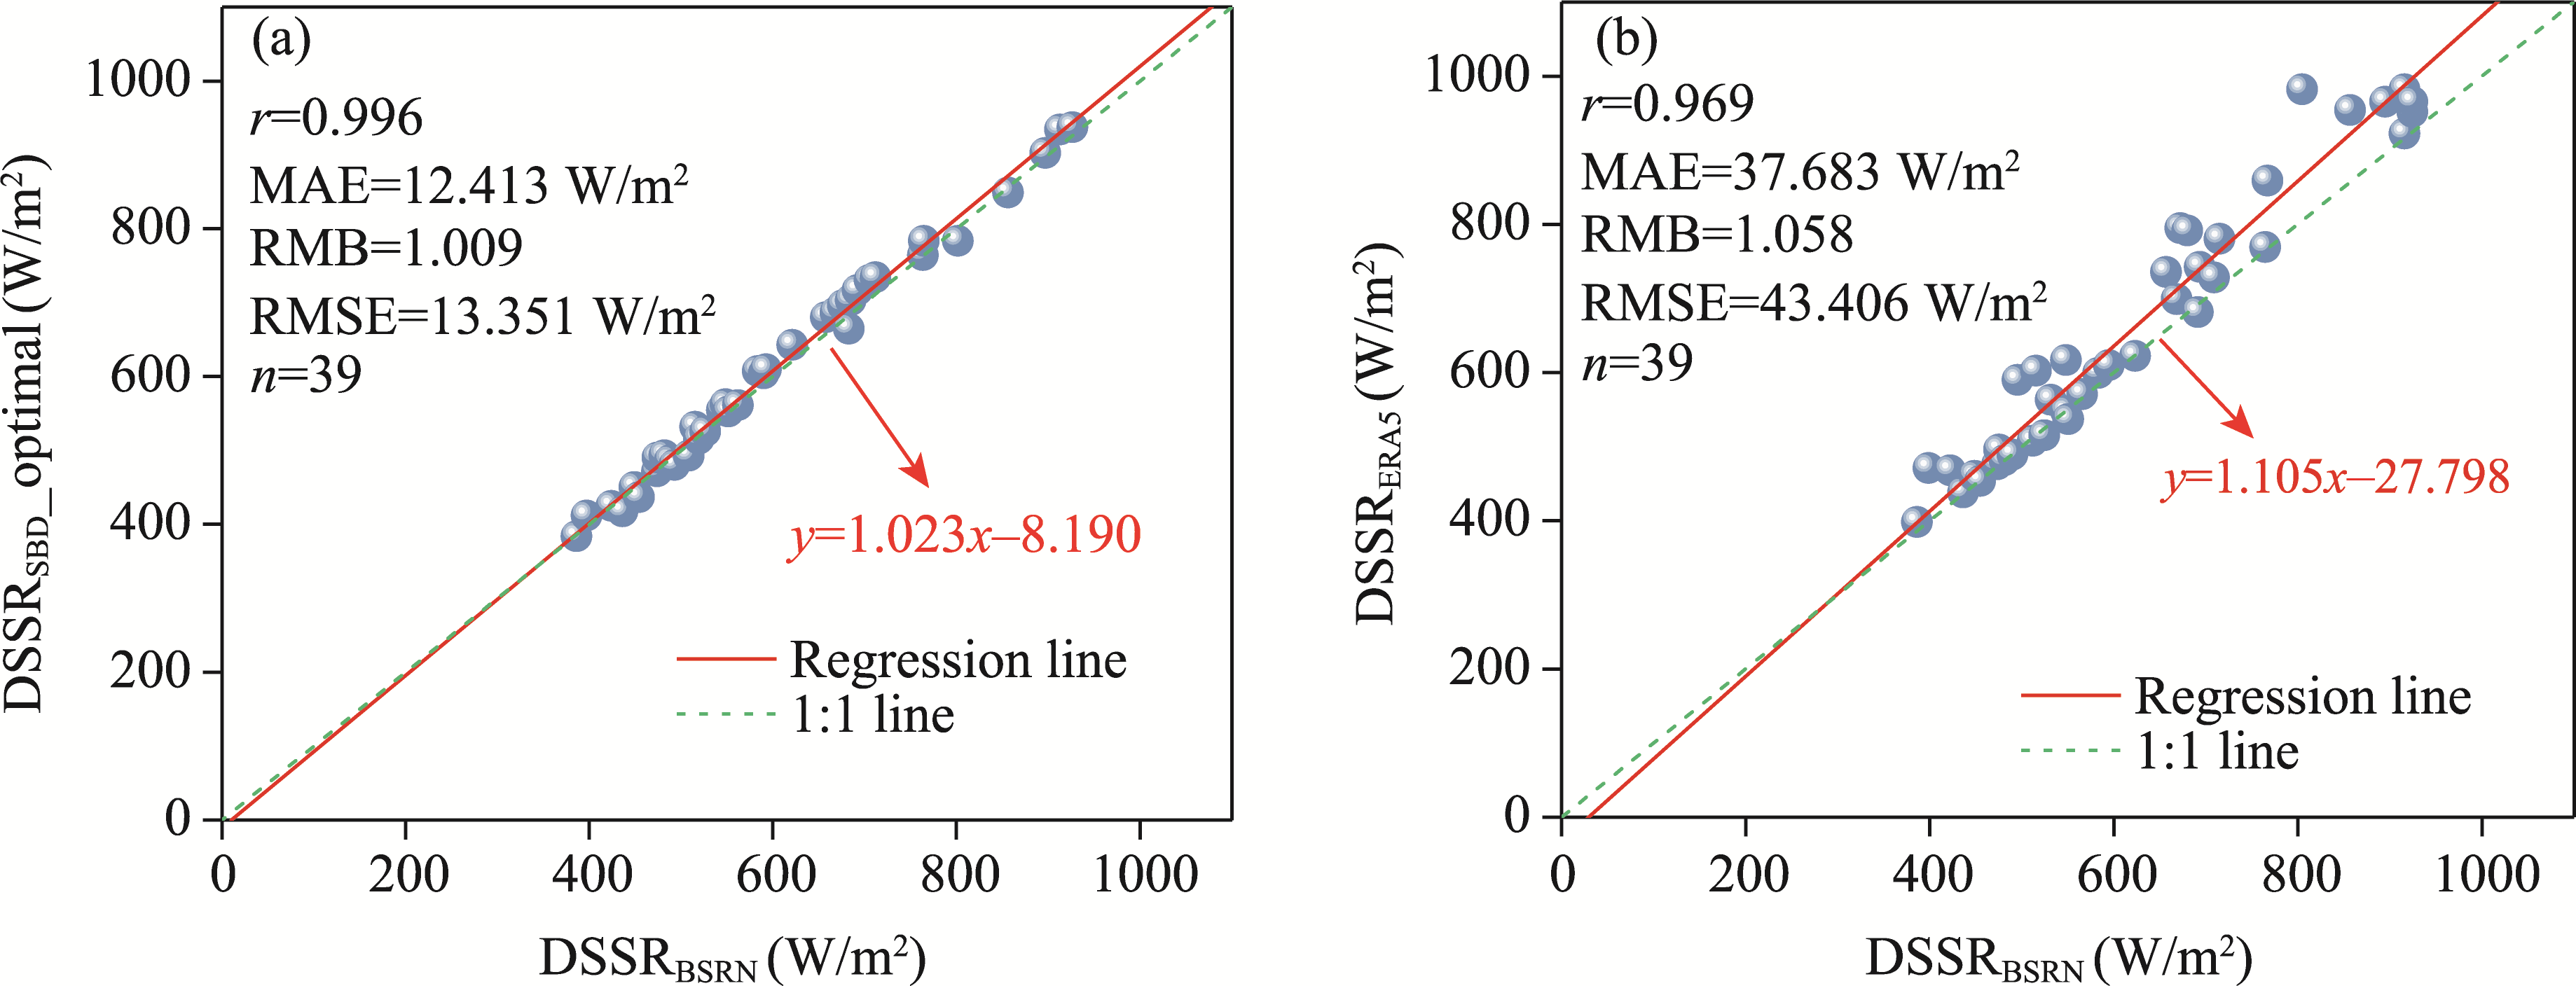
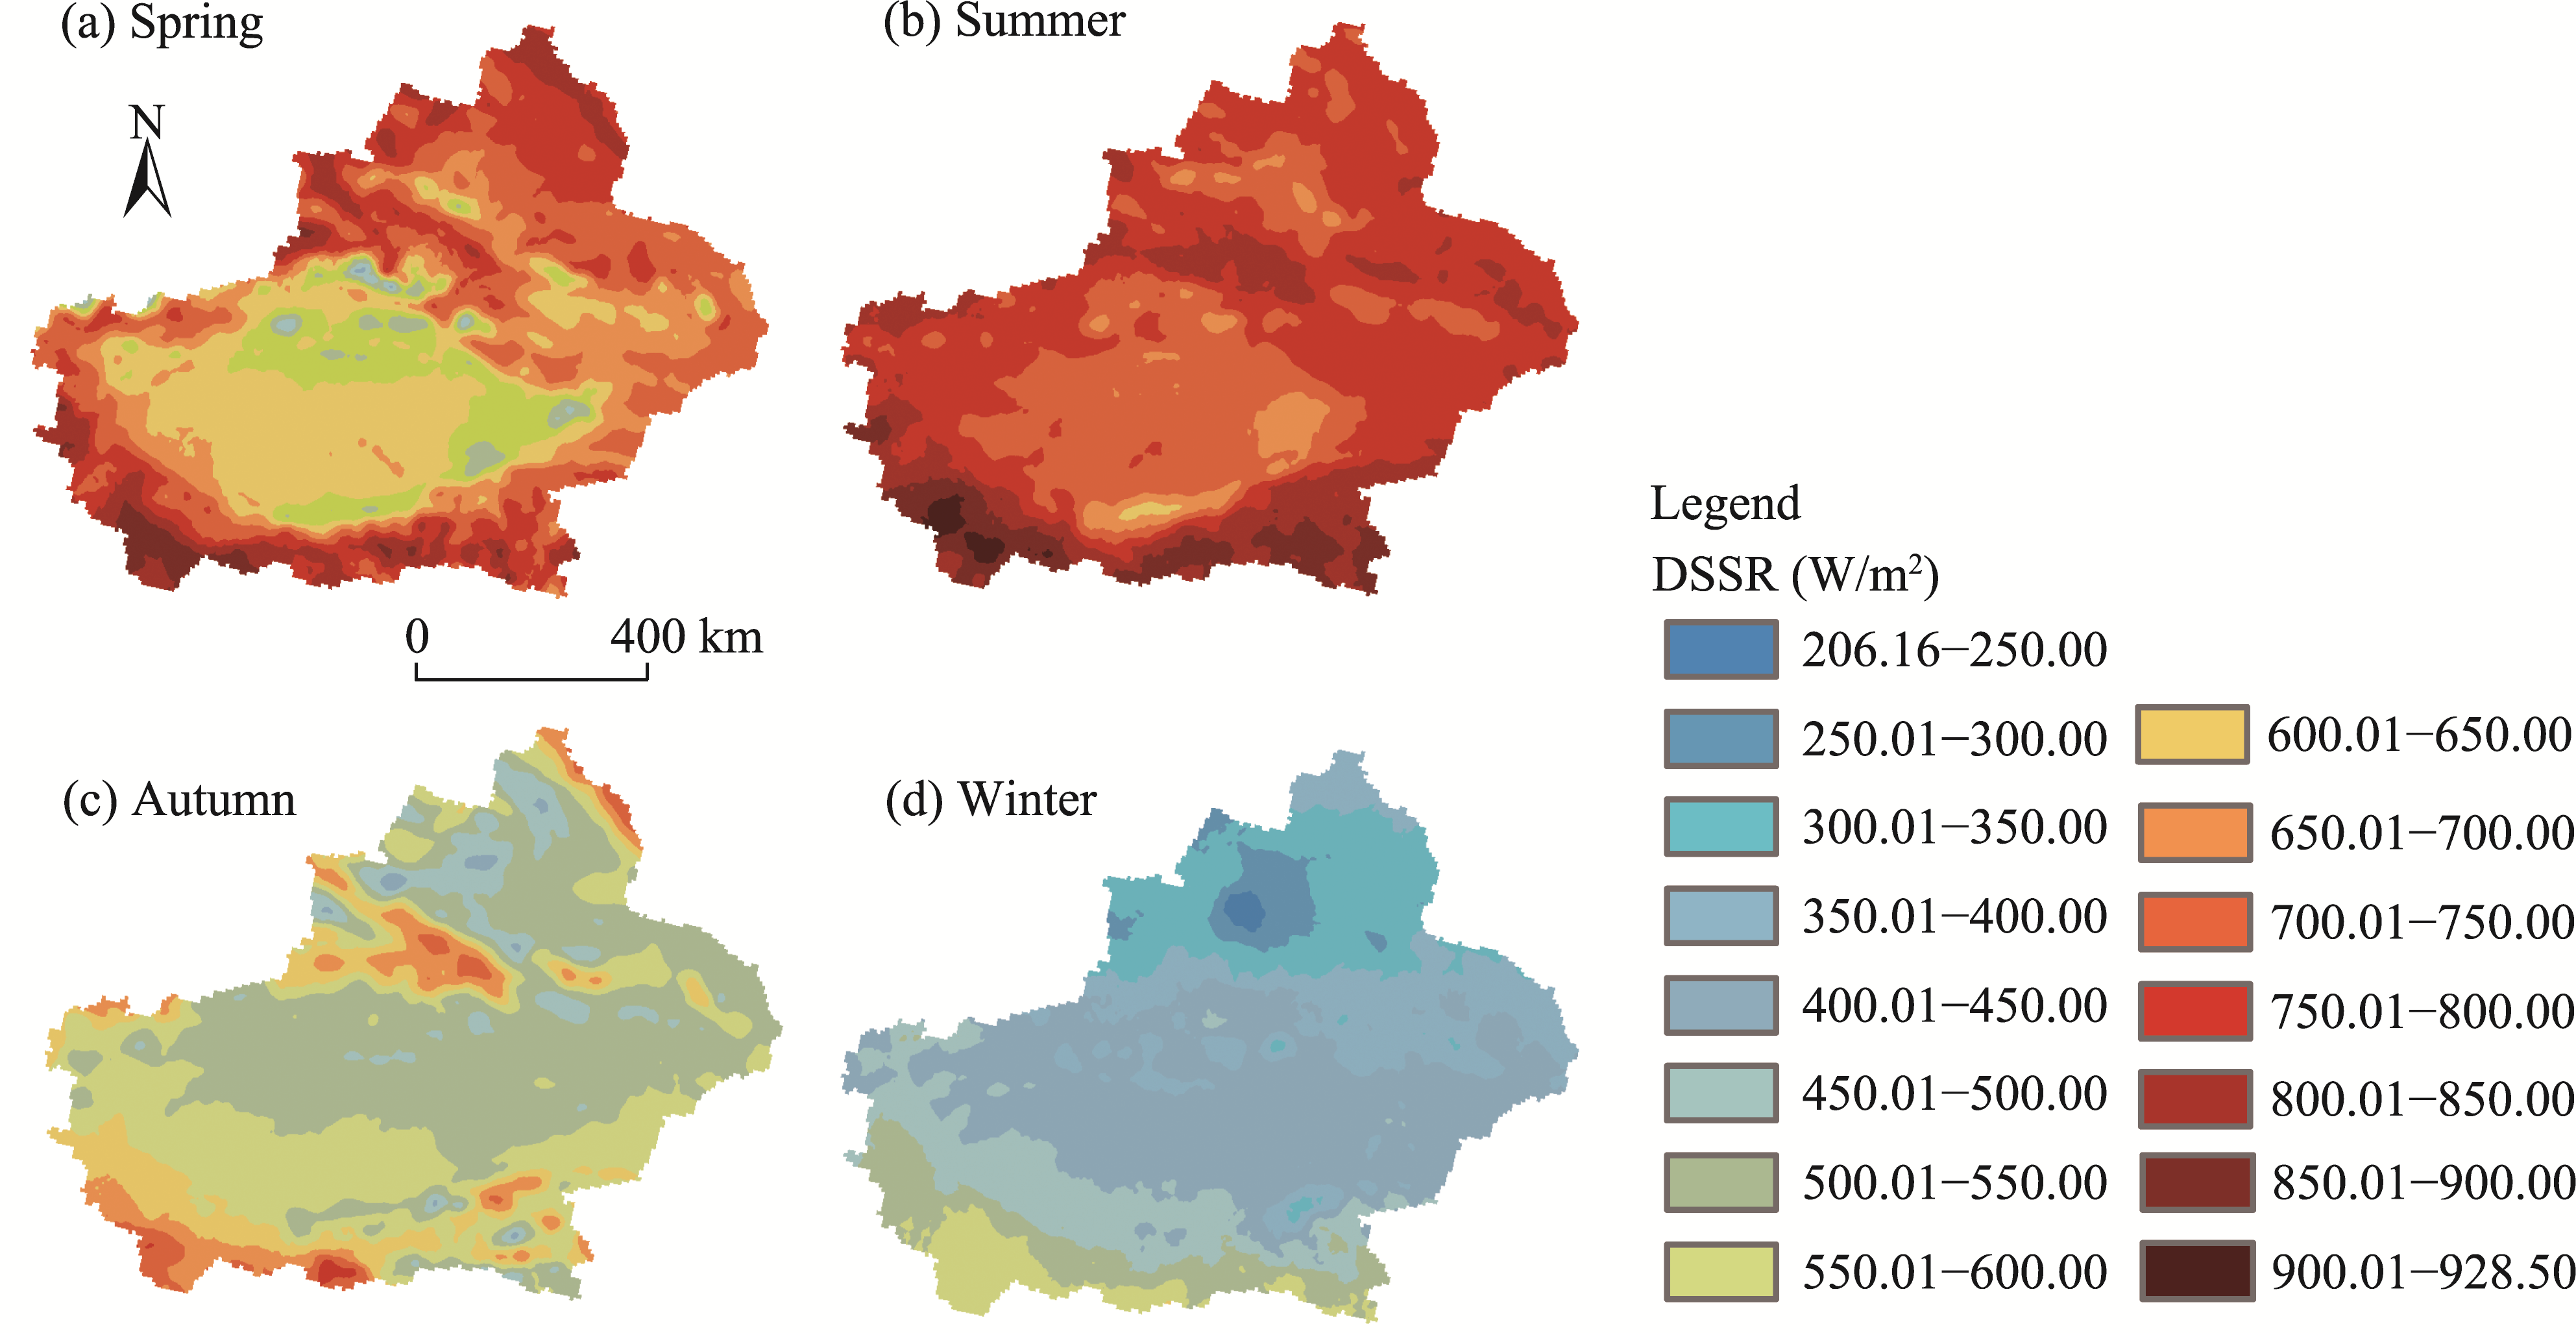
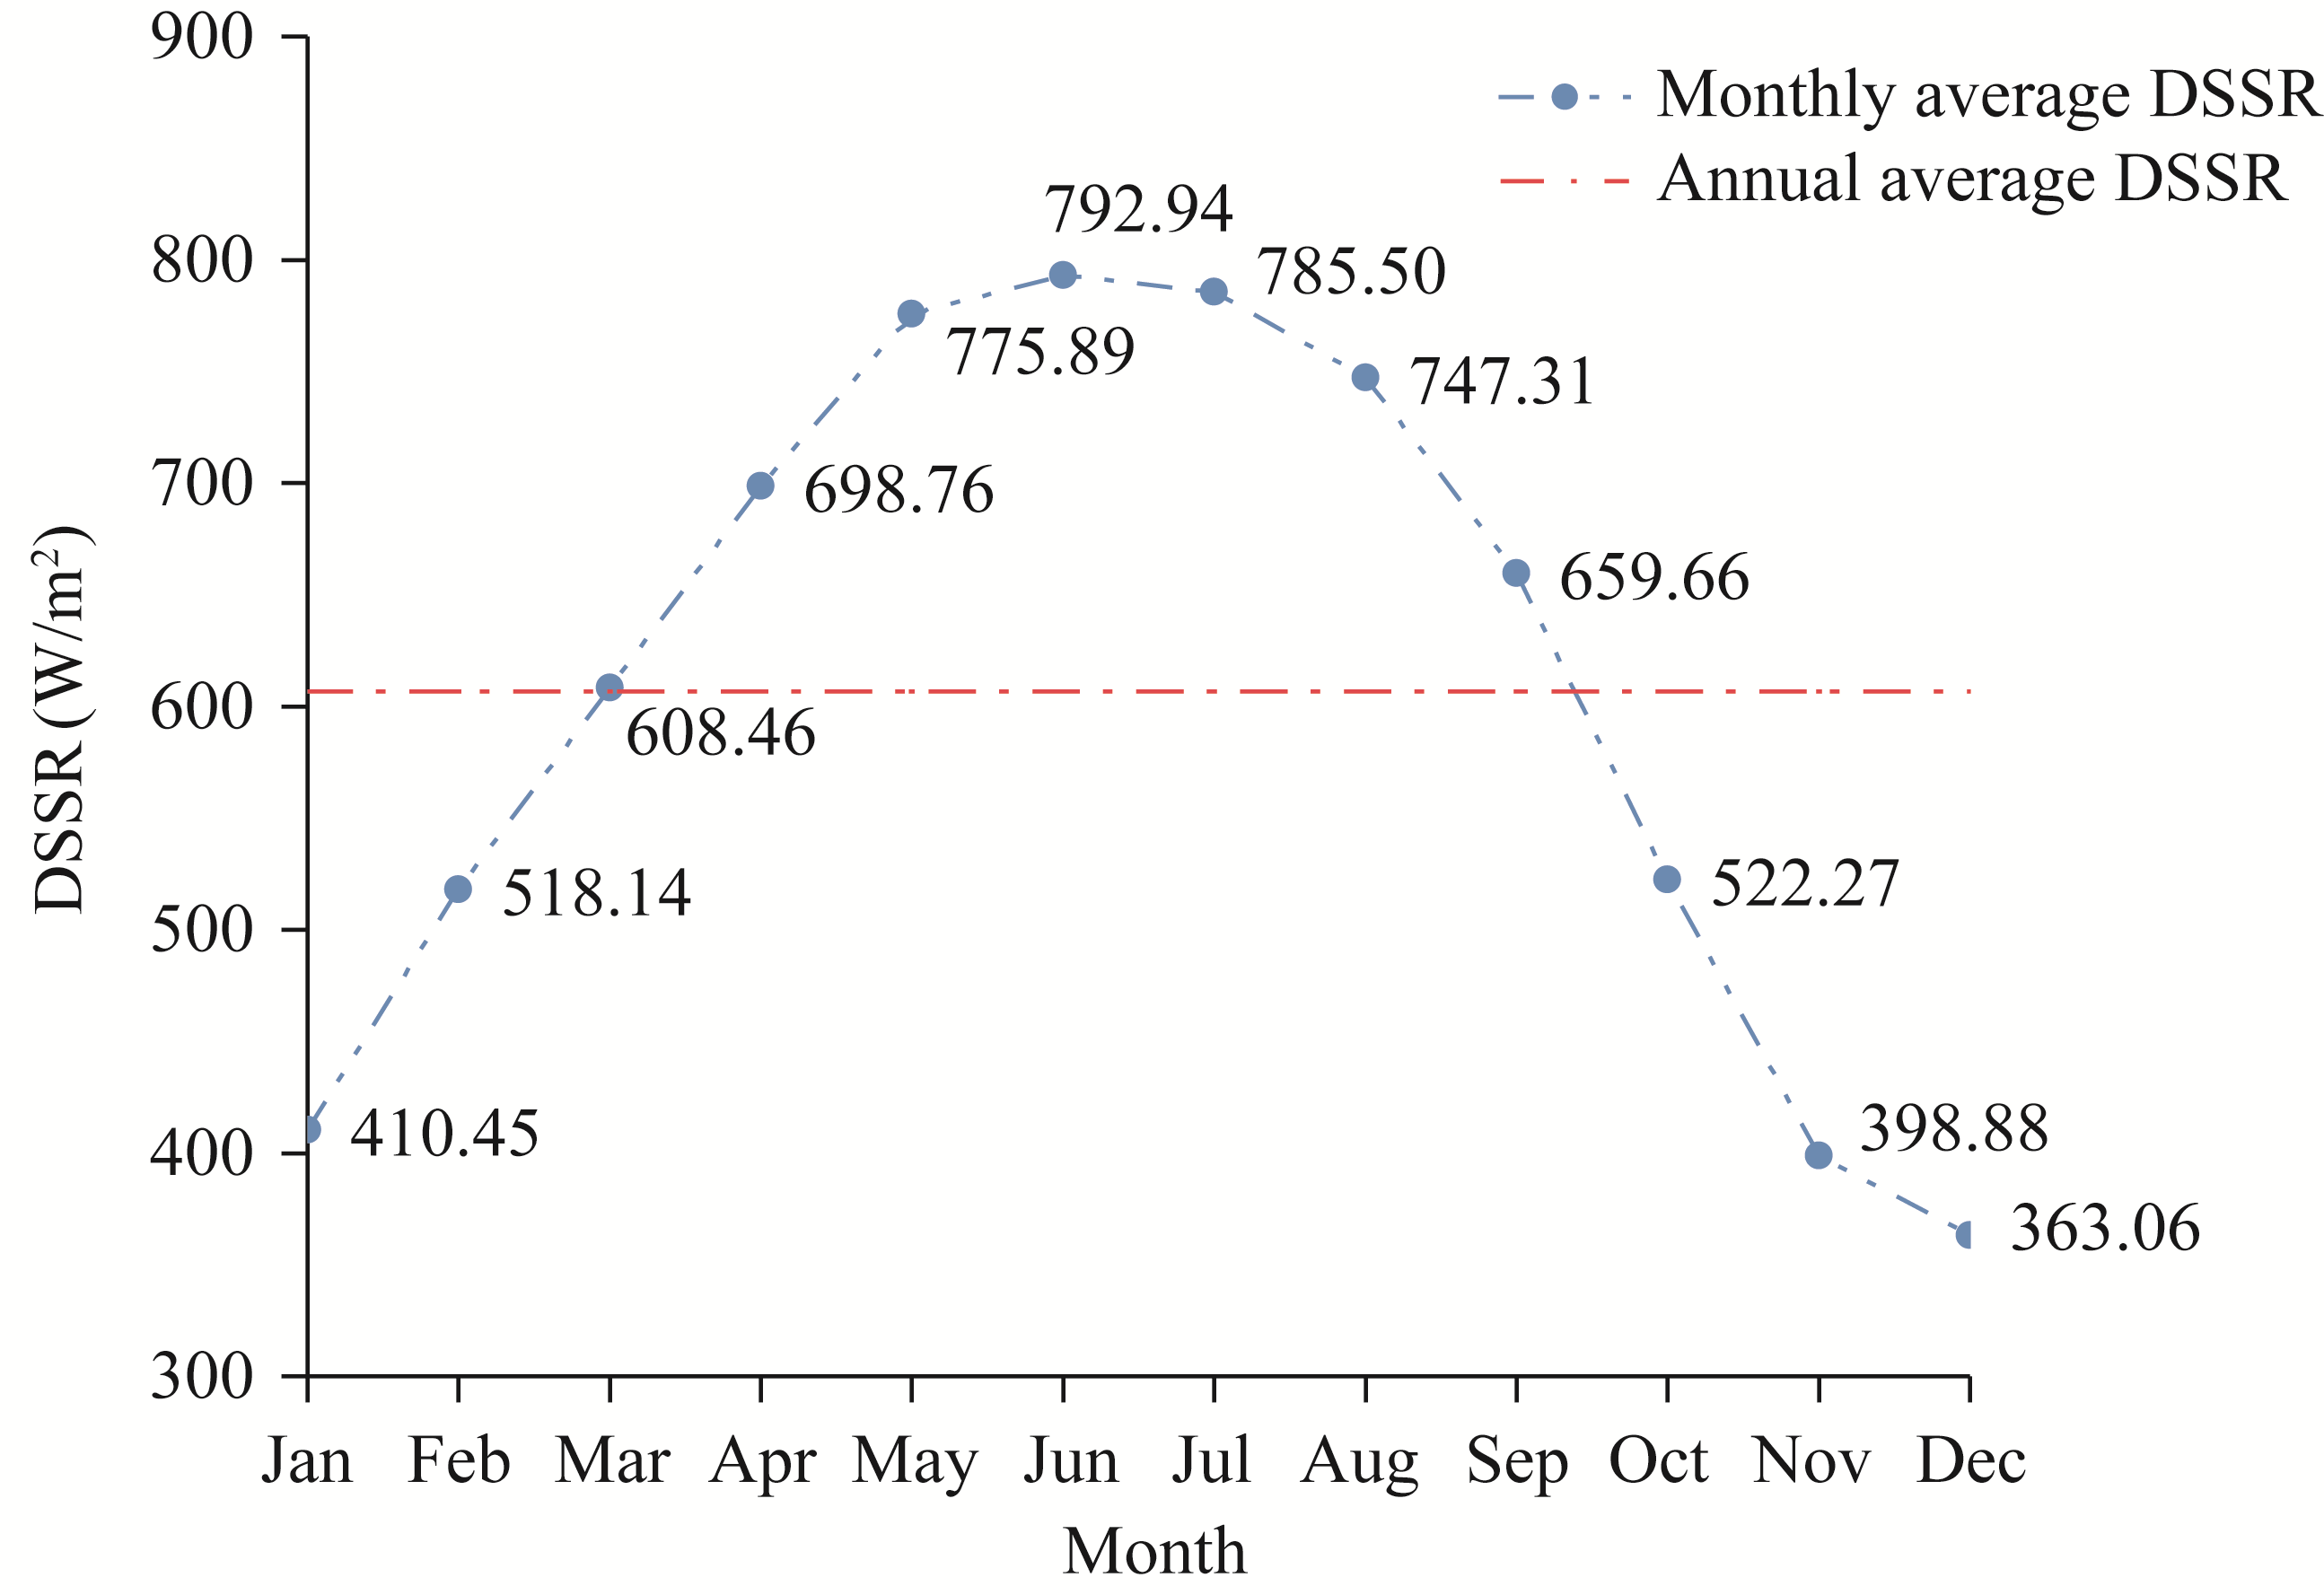
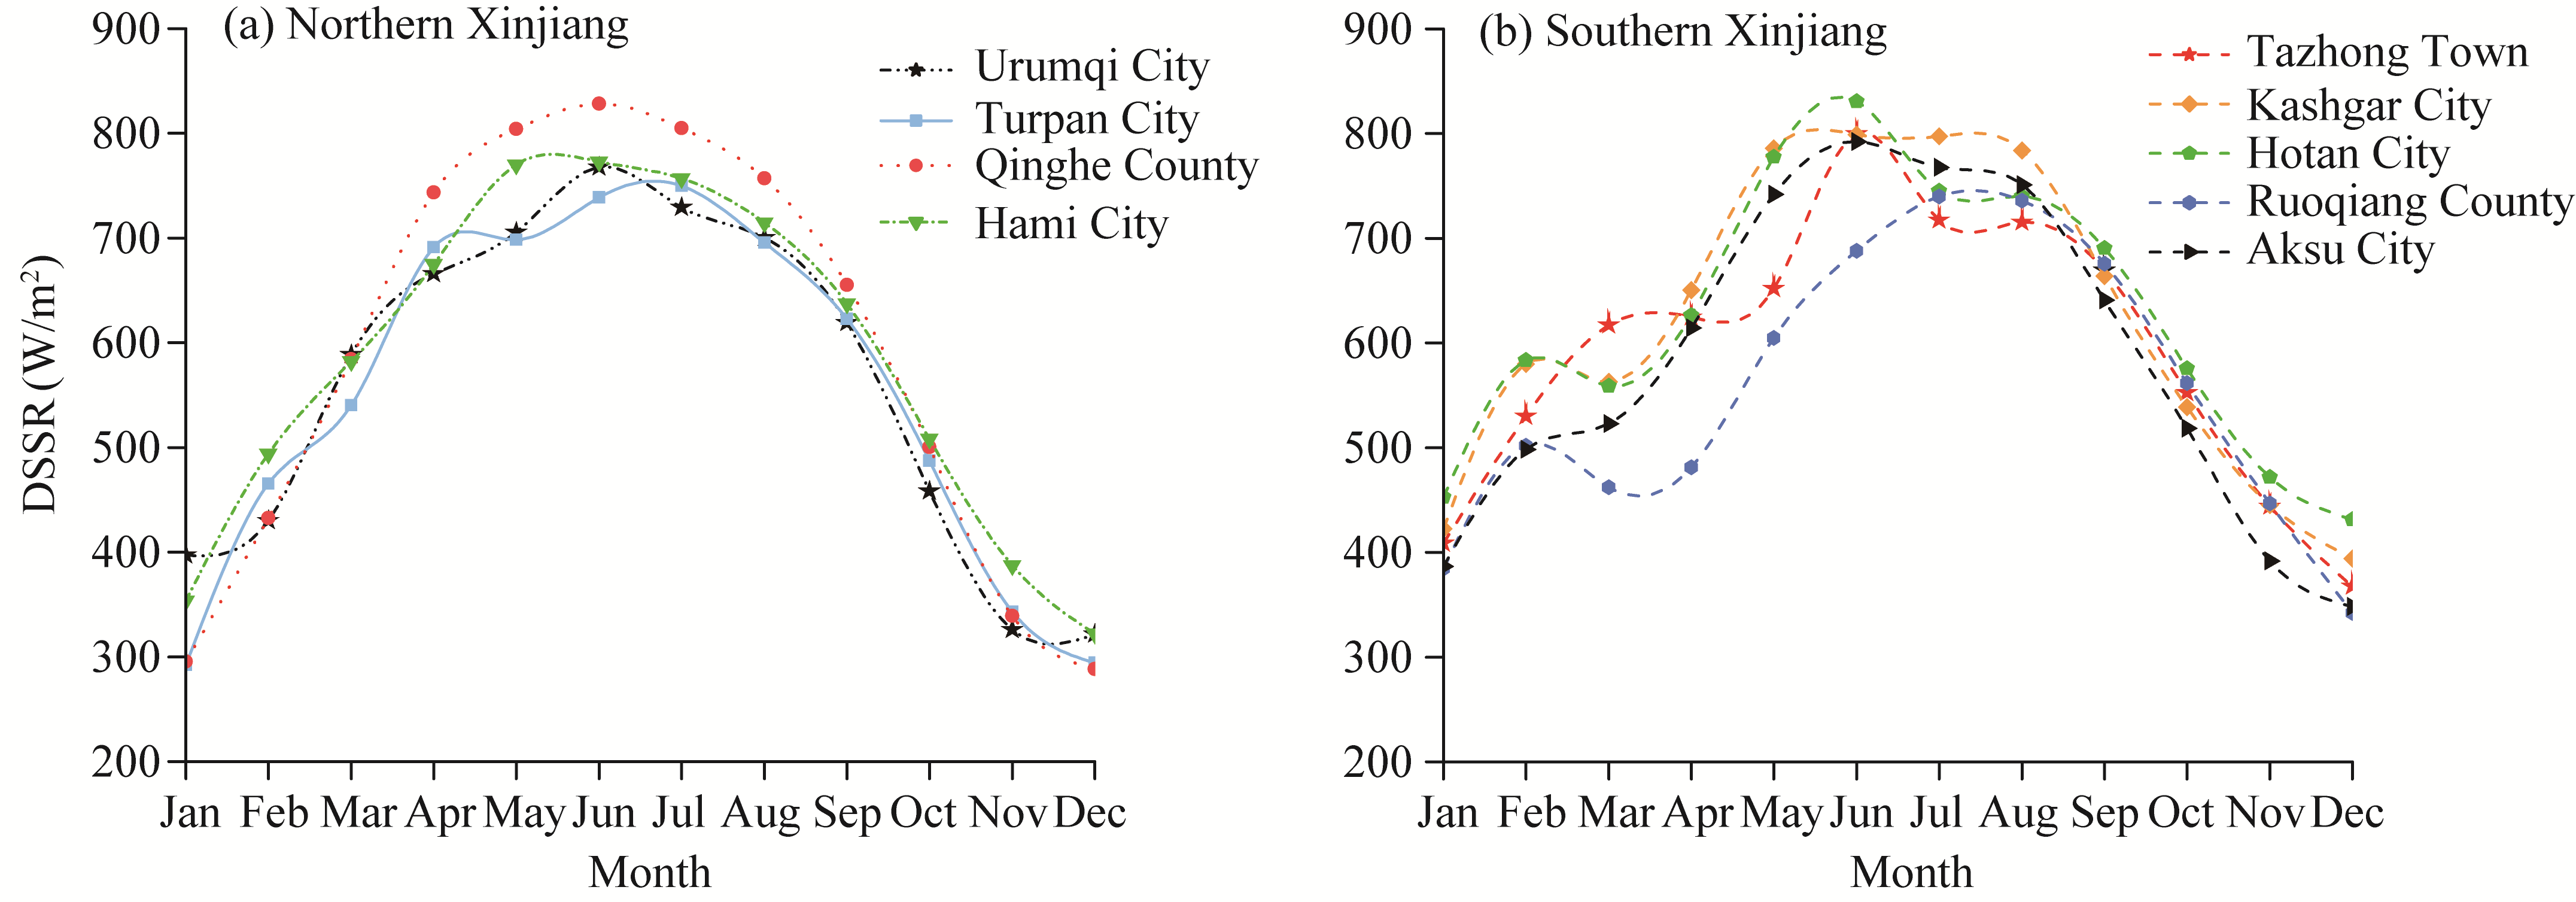
Abstract Given that Xinjiang Uygur Autonomous Region of China possesses exceptionally abundant solar radiation resources that can be harnessed to develop clean energy, accurately characterizing their spatiotemporal distribution is crucial. This study investigated the applicability of the Clouds and the Earth's Radiant Energy System (CERES) Single Scanner Footprint TOA/Surface Fluxes and Clouds (SSF) product downward surface shortwave radiation dataset (DSSRCER) under clear-sky conditions in Xinjiang. By integrating multi-source data and utilizing techniques like multivariate fitting and model simulation, we established a two-layer aerosol model and developed a clear-sky downward surface shortwave radiation (DSSR) retrieval model specific to Xinjiang using the Santa Barbara Discrete Atmospheric Radiative Transfer (SBDART) model. We further explored the spatiotemporal distribution characteristics of DSSR under clear-sky conditions in Xinjiang from 2017 to 2019 based on the localized DSSR retrieval model. Our findings revealed a significant discrepancy in DSSRCER under clear-sky conditions at the Xiaotang station in Xinjiang. By comparing, screening, and correcting core input parameters while incorporating the two-layer aerosol model, we achieved a more accurate SBDART simulated DSSR (DSSRSBD) compared to DSSRCER. The annual mean DSSR exhibited a distinct distribution pattern with high values in mountainous regions such as the Altay Mountains, Kunlun Mountains, and Tianshan Mountains and significantly lower values in adjacent lowland areas, including the Tarim River Basin and Junggar Basin. In the four typical administrative regions in northern Xinjiang, the annual mean DSSR (ranging from 551.60 to 586.09 W/m2) was lower than that in the five typical administrative regions in southern Xinjiang (ranging from 522.10 to 623.62 W/m2). These spatial variations stem from a complex interplay of factors, including latitude, altitude, solar altitude angle, and sunshine duration. The variations in seasonal average DSSR aligned closely with variations in the solar altitude angle, with summer (774.76 W/m2) exhibiting the highest values, followed by spring (684.86 W/m2), autumn (544.76 W/m2), and winter (422.74 W/m2). The monthly average DSSR showed a unimodal distribution, peaking in June (792.94 W/m2) and reaching its lowest level in December (363.06 W/m2). Overall, our study findings enhance the current understanding of the spatiotemporal distribution characteristics of DSSR in Xinjiang and provide certain references for the management of clean energy development in this region.
|
|
Received: 04 January 2025
Published: 30 June 2025
|
|
Corresponding Authors:
*WANG Pengtao (E-mail: wnpengtao@126.com)
|
|
|
| [1] |
Alexandri G, Georgoulias A K, Meleti C, et al. 2017. A high resolution satellite view of surface solar radiation over the climatically sensitive region of Eastern Mediterranean. Atmospheric Research, 188: 107-121.
|
|
|
| [2] |
Bao S H, Letu H, Zhao C F, et al. 2019. Spatiotemporal distributions of cloud parameters and the temperature response over the Mongolian Plateau during 2006-2015 based on MODIS data. IEEE Journal of Selected Topics in Applied Earth Observations and Remote Sensing, 12(2): 549-558.
|
|
|
| [3] |
Betts A K, Zhao M, Dirmeyer P A, et al. 2006. Comparison of ERA40 and NCEP/DOE near-surface data sets with other ISLSCP-II data sets. Journal of Geophysical Research: Atmospheres, 111(D22): D22S04, doi: 10.1029/2006JD007174.
|
|
|
| [4] |
Buchard V, Randles C A, da Silva A M, et al. 2017. The MERRA-2 aerosol reanalysis, 1980 onward. Part II: evaluation and case studies. Journal of Climate, 30(17): 6851-6872.
doi: 10.1175/jcli-d-16-0613.1
pmid: 32908329
|
|
|
| [5] |
Chu Y Q, Li J, Li C C, et al. 2019. Seasonal and diurnal variability of planetary boundary layer height in Beijing: Intercomparison between MPL and WRF results. Atmospheric Research, 227: 1-13.
|
|
|
| [6] |
Darnell W L, Staylor W F, Gupta S K, et al. 1992. Seasonal variation of surface radiation budget derived from international satellite cloud climatology project C 1 data. Journal of Geophysical Research: Atmospheres, 97(D14): 15741-15760.
|
|
|
| [7] |
Deng W F. 2024. Ocean warming and warning. Nature Climate Change, 14(2): 118-119.
|
|
|
| [8] |
Gu W, Guli J, Yi H M, et al. 2021. Spatial and temporal distribution characteristic and division research of solar energy resources in southern Xinjiang. Arid Land Geography, 44(6): 1665-1675. (in Chinese)
doi: 10.12118/j.issn.1000–6060.2021.06.15
|
|
|
| [9] |
Gupta S K, Kratz D P, Stackhouse P W, et al. 2001. The Langley parameterized shortwave algorithm (LPSA) for surface radiation budget studies (version 1.0). In: NASA/TP-2001-211272. NASA Langley Research Center. Hampton, USA.
|
|
|
| [10] |
He Q S, Li C C, Mao J T, et al. 2008. Analysis of aerosol vertical distribution and variability in Hong Kong. Journal of Geophysical Research-Atmospheres, 113(D14): D14211, doi: 10.1029/2008JD009778.
|
|
|
| [11] |
Huang B C, Huang Y, Wu D, et al. 2024a. The influence of vegetation on climate elements in northwestern China. Atmosphere, 15(3): 325, doi: 10.3390/atmos15030325.
|
|
|
| [12] |
Huang G, Chen Y H, Li Z Q, et al. 2020a. Validation and accuracy analysis of the collection 6.1 MODIS aerosol optical depth over the Westernmost City in China based on the Sun-sky radiometer observations from SONET. Earth and Space Science, 7(3): e2019EA001041, doi: 10.1029/2019EA001041.
|
|
|
| [13] |
Huang G, Liu Q, Wang Y Y, et al. 2020b. The accuracy improvement of clear-sky surface shortwave radiation derived from CERES SSF dataset with a simulation analysis. Science of the Total Environment, 749: 141671, doi: 10.1016/j.scitotenv.2020.141671.
|
|
|
| [14] |
Huang G, Zhou Y M, Guo Z J, et al. 2023. The influence of dust aerosols on solar radiation and near-surface temperature during a severe duststorm transport episode. Frontiers in Environmental Science, 11: 1126302, doi: 10.3389/fenvs.2023.1126302.
|
|
|
| [15] |
Huang G, Chen Y H, Liu Q, et al. 2024b. Accurate shortwave radiation simulation with a two-layer aerosol model in Xinjiang region. Journal of Meteorological Research, 38(1): 69-87.
|
|
|
| [16] |
Jiang H, Yang Y P, Bai Y Q, et al. 2020. Evaluation of the total, direct, and diffuse solar radiations from the ERA 5 reanalysis data in China. IEEE Geoscience and Remote Sensing Letters, 17(1): 47-51.
doi: 10.1109/LGRS.2019.2916410
|
|
|
| [17] |
Kratz D P, Gupta S K, Wilber A C, et al. 2010. Validation of the CERES edition 2B surface-only flux algorithms. Journal of Applied Meteorology and Climatology, 49(1): 164-180.
|
|
|
| [18] |
Kratz D P, Gupta S K, Wilber A C, et al. 2020. Validation of the CERES edition-4A surface-only flux algorithm. Journal of Applied Meteorology and Climatology, 59(2): 281-295.
|
|
|
| [19] |
Letu H S, Yang K, Nakajima T Y, et al. 2020. High-resolution retrieval of cloud microphysical properties and surface solar radiation using Himawari-8/AHI next-generation geostationary satellite. Remote Sensing of Environment, 239: 111583, doi: 10.1016/j.rse.2019.111583.
|
|
|
| [20] |
Li R H, Wang D D, Liang S L. 2021. Comprehensive assessment of five global daily downward shortwave radiation satellite products. Science of Remote Sensing, 4: 100028, doi: 10.1016/j.srs.2021.100028.
|
|
|
| [21] |
Li W W, Letu H S, Chen H B, et al. 2017a. Estimation of surface solar radiation using MODIS satellite data and RSTAR model. Remote Sensing Technology and Application, 32(4): 643-650. (in Chinese)
|
|
|
| [22] |
Li Z Q, Guo J P, Ding A J, et al. 2017b. Aerosol and boundary-layer interactions and impact on air quality. National Science Review, 4(6): 810-833.
|
|
|
| [23] |
Liu Y, Zhang X F, Li J, et al. 2015. Estimation and seasonal variation of solar radiation in Xinjiang based on a multi-sensor data approach. Journal of Arid Land Resources and Environment, 29(3): 161-165. (in Chinese)
|
|
|
| [24] |
Loeb N G, Su W Y. 2010. Direct aerosol radiative forcing uncertainty based on a radiative perturbation analysis. Journal of Climate, 23(19): 5288-5293.
|
|
|
| [25] |
Luo X, Zhang X Z, Xu Y, et al. 2024. Behavioral responses of intertidal clams to compound extreme weather and climate events. Marine Pollution Bulletin, 200: 116112, doi: 10.1016/j.marpolbul.2024.116112.
|
|
|
| [26] |
Meng X G, Guo J J, Han Y Q, et al. 2018. Preliminarily assessment of ERA 5 reanalysis data. Journal of Marine Meteorology, 38(1): 91-99. (in Chinese)
|
|
|
| [27] |
Miao Y C, Li J, Miao S G, et al. 2019. Interaction between planetary boundary layer and PM2.5 pollution in megacities in China: a review. Current Pollution Reports, 5(4): 261-271.
|
|
|
| [28] |
Pomegranate Cloud/Xinjiang Daily News. 2025. 2025 Xinjiang Two Sessions • In-Depth | How Xinjiang's wind and solar advantages can be transformed into a development edge? [2025-02-14].https://www.xjmty.com/yw/202501/t20250119_26282340_web.html. (in Chinese)
|
|
|
| [29] |
Qiao Y, Zhang J, Xue W H, et al. 2019. Aerosol influence on surface solar radiation in China and Indian from 2011 to 2014 as judged by Fu-Liou model. Journal of Beijing Normal University (Natural Science), 55(1): 114-120. (in Chinese)
|
|
|
| [30] |
Randles C A, da Silva A M, Buchard V, et al. 2017. The MERRA-2 aerosol reanalysis, 1980-onward, part I: system description and data assimilation evaluation. Journal of Climate, 30(17): 6823-6850.
doi: 10.1175/JCLI-D-16-0609.1
pmid: 29576684
|
|
|
| [31] |
Samset B H, Myhre G, Schulz M, et al. 2013. Black carbon vertical profiles strongly affect its radiative forcing uncertainty. Atmospheric Chemistry and Physics, 13(5): 2423-2434.
|
|
|
| [32] |
Shao S Y, Zhang J, Zhou L H, et al. 2017. Aerosol effects on global surface solar radiation based on Fu-Liou modeling and satellite observations. Resources Science, 39(3): 513-521. (in Chinese)
doi: 10.18402/resci.2017.03.13
|
|
|
| [33] |
Smith K E, Burrows M T, Hobday A J, et al. 2021. Socioeconomic impacts of marine heatwaves: global issues and opportunities. Science, 374(6566): eabj3593, doi: 10.1126/science.abj3593.
|
|
|
| [34] |
Sun D Z, Ji C D, Sun W X, et al. 2018. Accuracy assessment of three remote sensing shortwave radiation products in the Arctic. Atmospheric Research, 212: 296-308.
|
|
|
| [35] |
Tana G, Ri X, Shi C, et al. 2023. Retrieval of cloud microphysical properties from Himawari-8/AHI infrared channels and its application in surface shortwave downward radiation estimation in the sun glint region. Remote Sensing of Environment, 290: 113548, doi: 10.1016/j.rse.2023.113548.
|
|
|
| [36] |
Tang C Q, Shi C, Letu H S, et al. 2023. Evaluation and uncertainty analysis of Himawari-8 hourly aerosol product version 3.1 and its influence on surface solar radiation before and during the COVID-19 outbreak. Science of the Total Environment, 892: 164456, doi: 10.1016/j.scitotenv.2023.164456.
|
|
|
| [37] |
Tang W J, Qin J, Yang K, et al. 2021. Does ERA 5 outperform satellite products in estimating atmospheric downward longwave radiation at the surface? Atmospheric Research, 252: 105453, doi: 10.1016/j.atmosres.2021.105453.
|
|
|
| [38] |
Tao M H, Chen L F, Wang Z F, et al. 2017. Evaluation of MODIS deep blue aerosol algorithm in desert region of East Asia: Ground validation and intercomparison. Journal of Geophysical Research: Atmospheres, 122(19): 10357-10368.
|
|
|
| [39] |
Urraca R, Huld T, Gracia-Amillo A, et al. 2018. Evaluation of global horizontal irradiance estimates from ERA5 and COSMO-REA6 reanalyses using ground and satellite-based data. Solar Energy, 164: 339-354.
|
|
|
| [40] |
Wang G F, Wang T X, Xue H Z. 2021. Validation and comparison of surface shortwave and longwave radiation products over the three poles. International Journal of Applied Earth Observations and Geoinformation, 104: 102538, doi: 10.1016/j.jag. 2021.102538.
|
|
|
| [41] |
Wang H H. 2020. Estimation of downward radiation based on multi-source data fusion. MSc Thesis. Changchun: Jilin University. (in Chinese)
|
|
|
| [42] |
Wang K C, Dickinson R E. 2013. Global atmospheric downward longwave radiation at the surface from ground-based observations, satellite retrievals, and reanalysis. Reviews of Geophysics, 51(2): 150-185.
|
|
|
| [43] |
Wei Y, Zhang X T, Hou N, et al. 2019. Estimation of surface downward shortwave radiation over China from AVHRR data based on four machine learning methods. Solar Energy, 177: 32-46.
doi: 10.1016/j.solener.2018.11.008
|
|
|
| [44] |
WMO (World Meteorological Organization). 2024. State of the Global Climate 2023. Geneva: WMO.
|
|
|
| [45] |
Xiao Q Y, Ma Z W, Li S S, et al. 2015. The impact of winter heating on air pollution in China. PLoS ONE, 10(1): e0117311, doi: 10.1371/journal.pone.0117311.
|
|
|
| [46] |
Xie Y, Wen J, Liu R, et al. 2019. An initial analysis of characteristics of radiation budget near ground in alpine wetland in source area of the Yellow River. Acta Energiae Solaris Sinica, 40(1): 1-10. (in Chinese)
|
|
|
| [47] |
Xu X F, Pan S X, Luo T Y, et al. 2023. Characteristics of optical properties and heating rates of dust aerosol over Taklimakan Desert and Tibetan Plateau in China based on CALIPSO and SBDART. Remote Sensing, 15(3): 607, doi: 10.3390/rs15030607.
|
|
|
| [48] |
Yang D Z, Bright J M. 2020. Worldwide validation of 8 satellite-derived and reanalysis solar radiation products: A preliminary evaluation and overall metrics for hourly data over 27 years. Solar Energy, 210: 3-19.
|
|
|
| [49] |
Yang F J. 2019. Study on errors of surface shortwave radiation from Aqua/CERES/SSF and its aerosol's influence under clear-sky in Xinjiang. MSc Thesis. Shanghai: Donghua University. (in Chinese)
|
|
|
| [50] |
Yang J H, Li Y Q, Zhou L, et al. 2024. Effects of temperature and precipitation on drought trends in Xinjiang, China. Journal of Arid Land, 16(8): 1098-1117.
doi: 10.1007/s40333-024-0105-0
|
|
|
| [51] |
Yao J Q, Chen Y N, Guan X F, et al. 2022. Recent climate and hydrological changes in a mountain-basin system in Xinjiang, China. Earth-Science Reviews, 226: 103957, doi: 10.1016/j.earscirev.2022.103957.
|
|
|
| [52] |
Yi N N, Zhang L, Liu W P, et al. 2017. Optical characteristics and radiative effects of atmospheric aerosol over Northwest China. Chinese Journal of Atmospheric Sciences, 41(2): 409-420. (in Chinese)
|
|
|
| [53] |
Zarzycki C M, Bond T C. 2010. How much can the vertical distribution of black carbon affect its global direct radiative forcing? Geophysical Research Letters, 37(20), doi: 10.1029/2010GL044555.
|
|
|
| [54] |
Zhang X T, Liang S L, Wang G X, et al. 2016. Evaluation of the reanalysis surface incident shortwave radiation products from NCEP, ECMWF, GSFC, and JMA using satellite and surface observations. Remote Sensing, 8(3): 225, doi: 10.3390/rs8030225.
|
|
|
| [55] |
Zhang X X, Lü N, Yao L, et al. 2018. Error analysis of ECMWF surface solar radiation data in China. Journal of Geo-information Science, 20(2): 254-267. (in Chinese)
|
|
|
| [56] |
Zhao J, Yan G J, Jiao Z H, et al. 2017. Enhanced shortwave radiative transfer model based on SBDART. Journal of Remote Sensing, 21(6): 853-863. (in Chinese)
|
|
|
|
Viewed |
|
|
|
Full text
|
|
|
|
|
Abstract
|
|
|
|
|
Cited |
|
|
|
|
| |
Shared |
|
|
|
|
| |
Discussed |
|
|
|
|