| Research article |
|


|
|
|
| Experimental and model research on the evaporation of loess-like sulfate saline soil considering the influence of initial salt content |
ZHANG Yabin1, CHOU Yaling2,*( ), ZHAO Dong3, WANG Lijie1, ZHANG Peng1 ), ZHAO Dong3, WANG Lijie1, ZHANG Peng1 |
1College of Civil Engineering, Lanzhou University of Technology, Lanzhou 730050, China
2Key Laboratory of Disaster Prevention and Mitigation in Civil Engineering of Gansu Province, Lanzhou University of Technology, Lanzhou 730050, China
3China Energy Construction Group Gansu Electric Power Design Institute Co., Ltd., Lanzhou 730050, China |
|
|
|
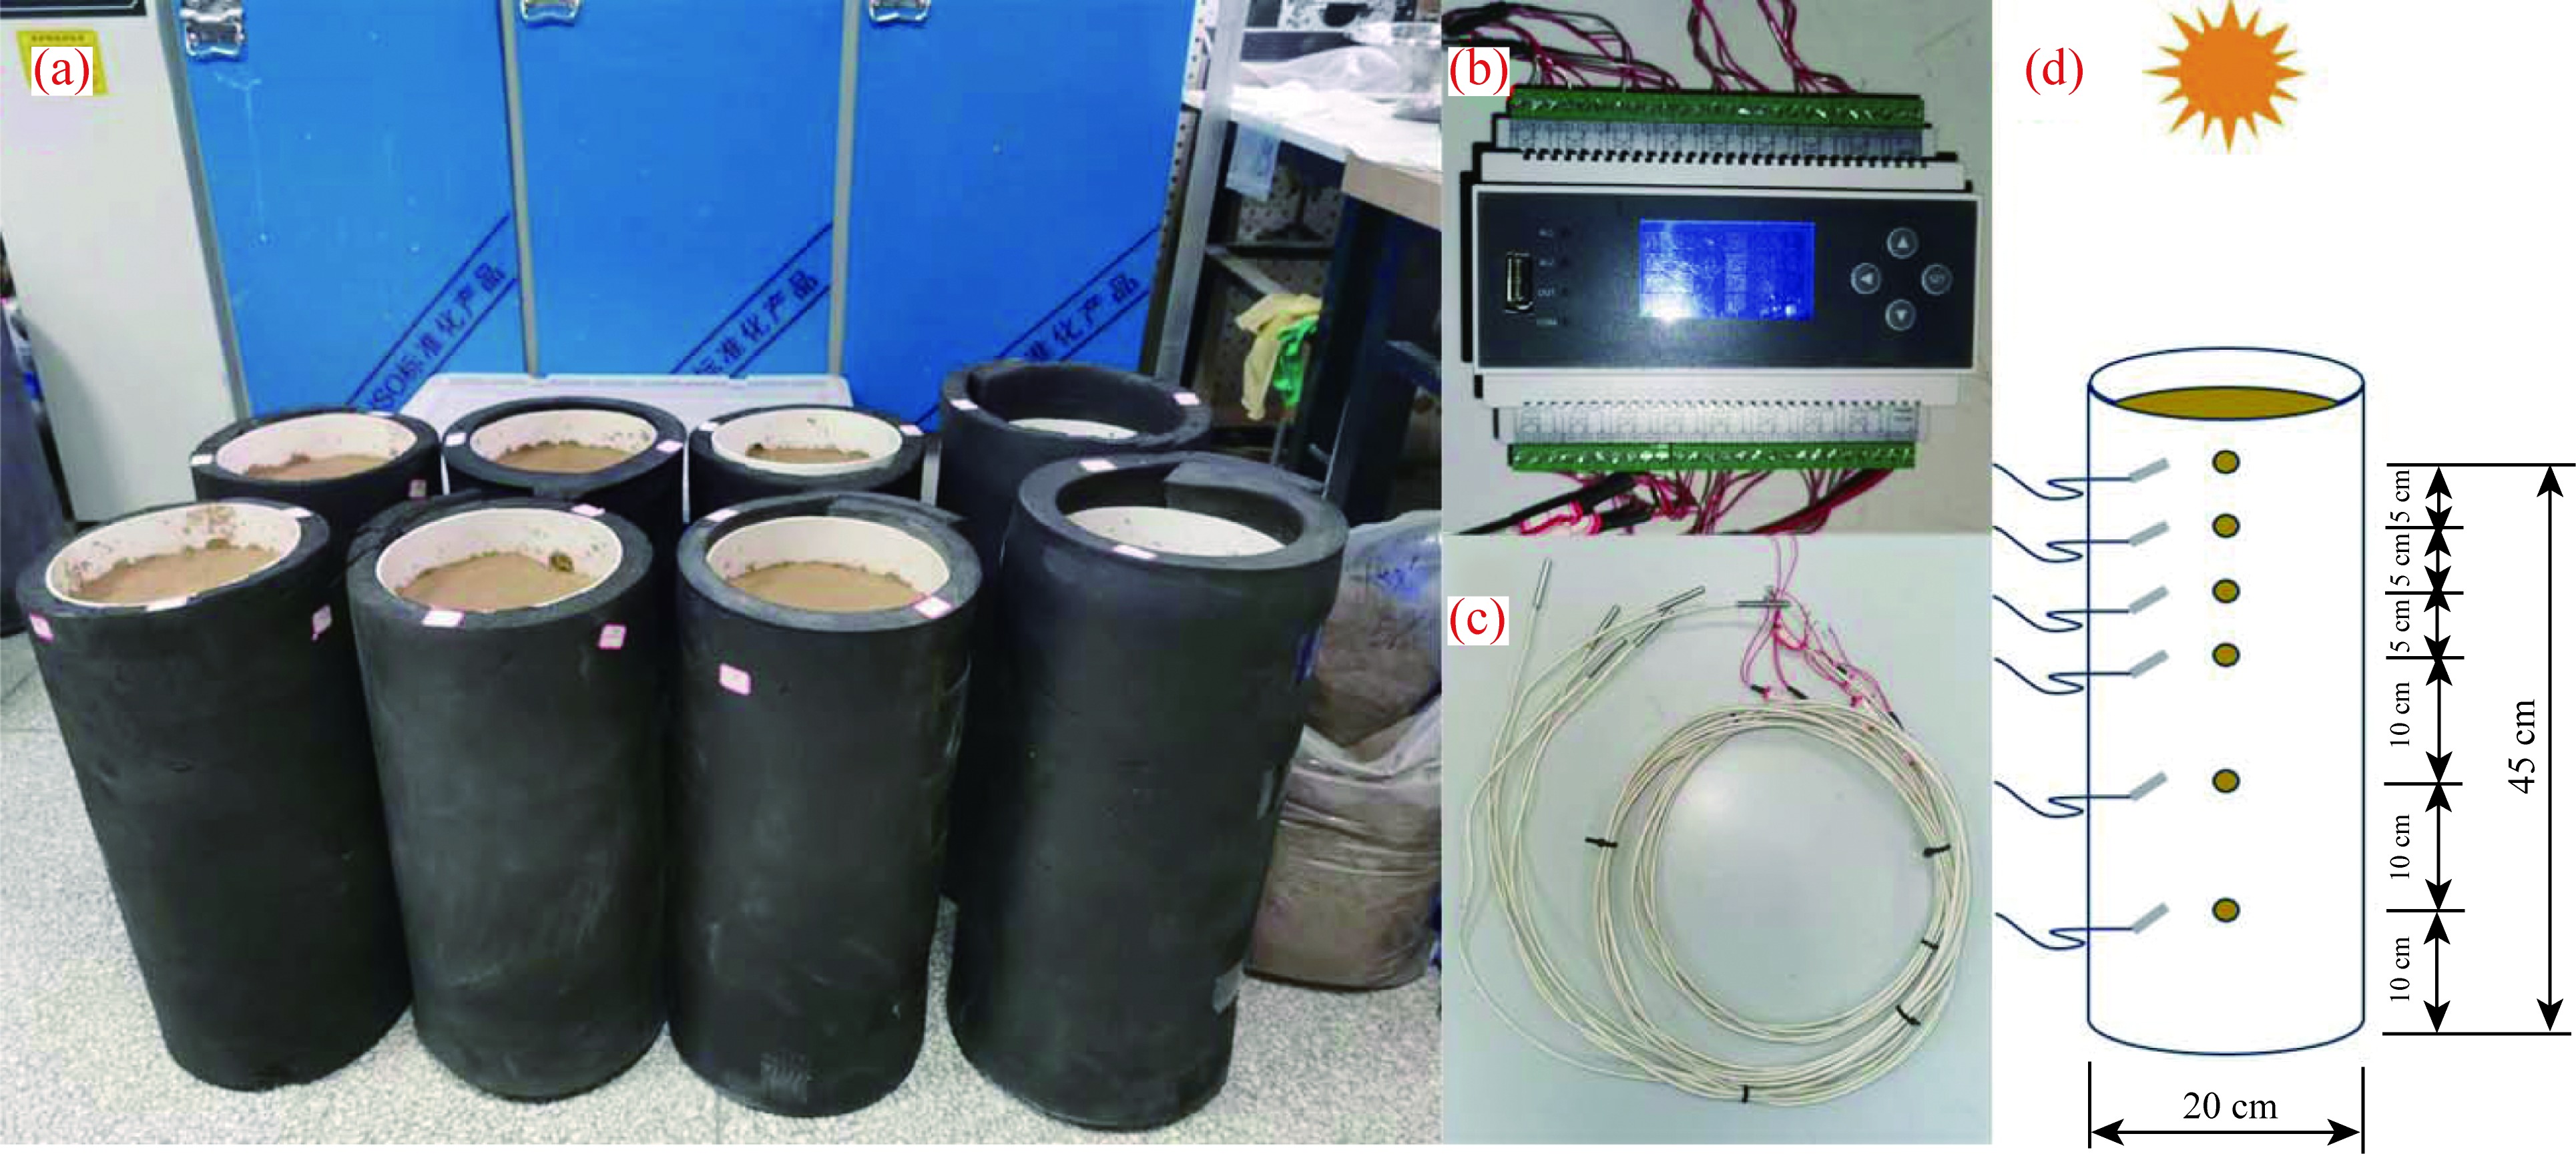
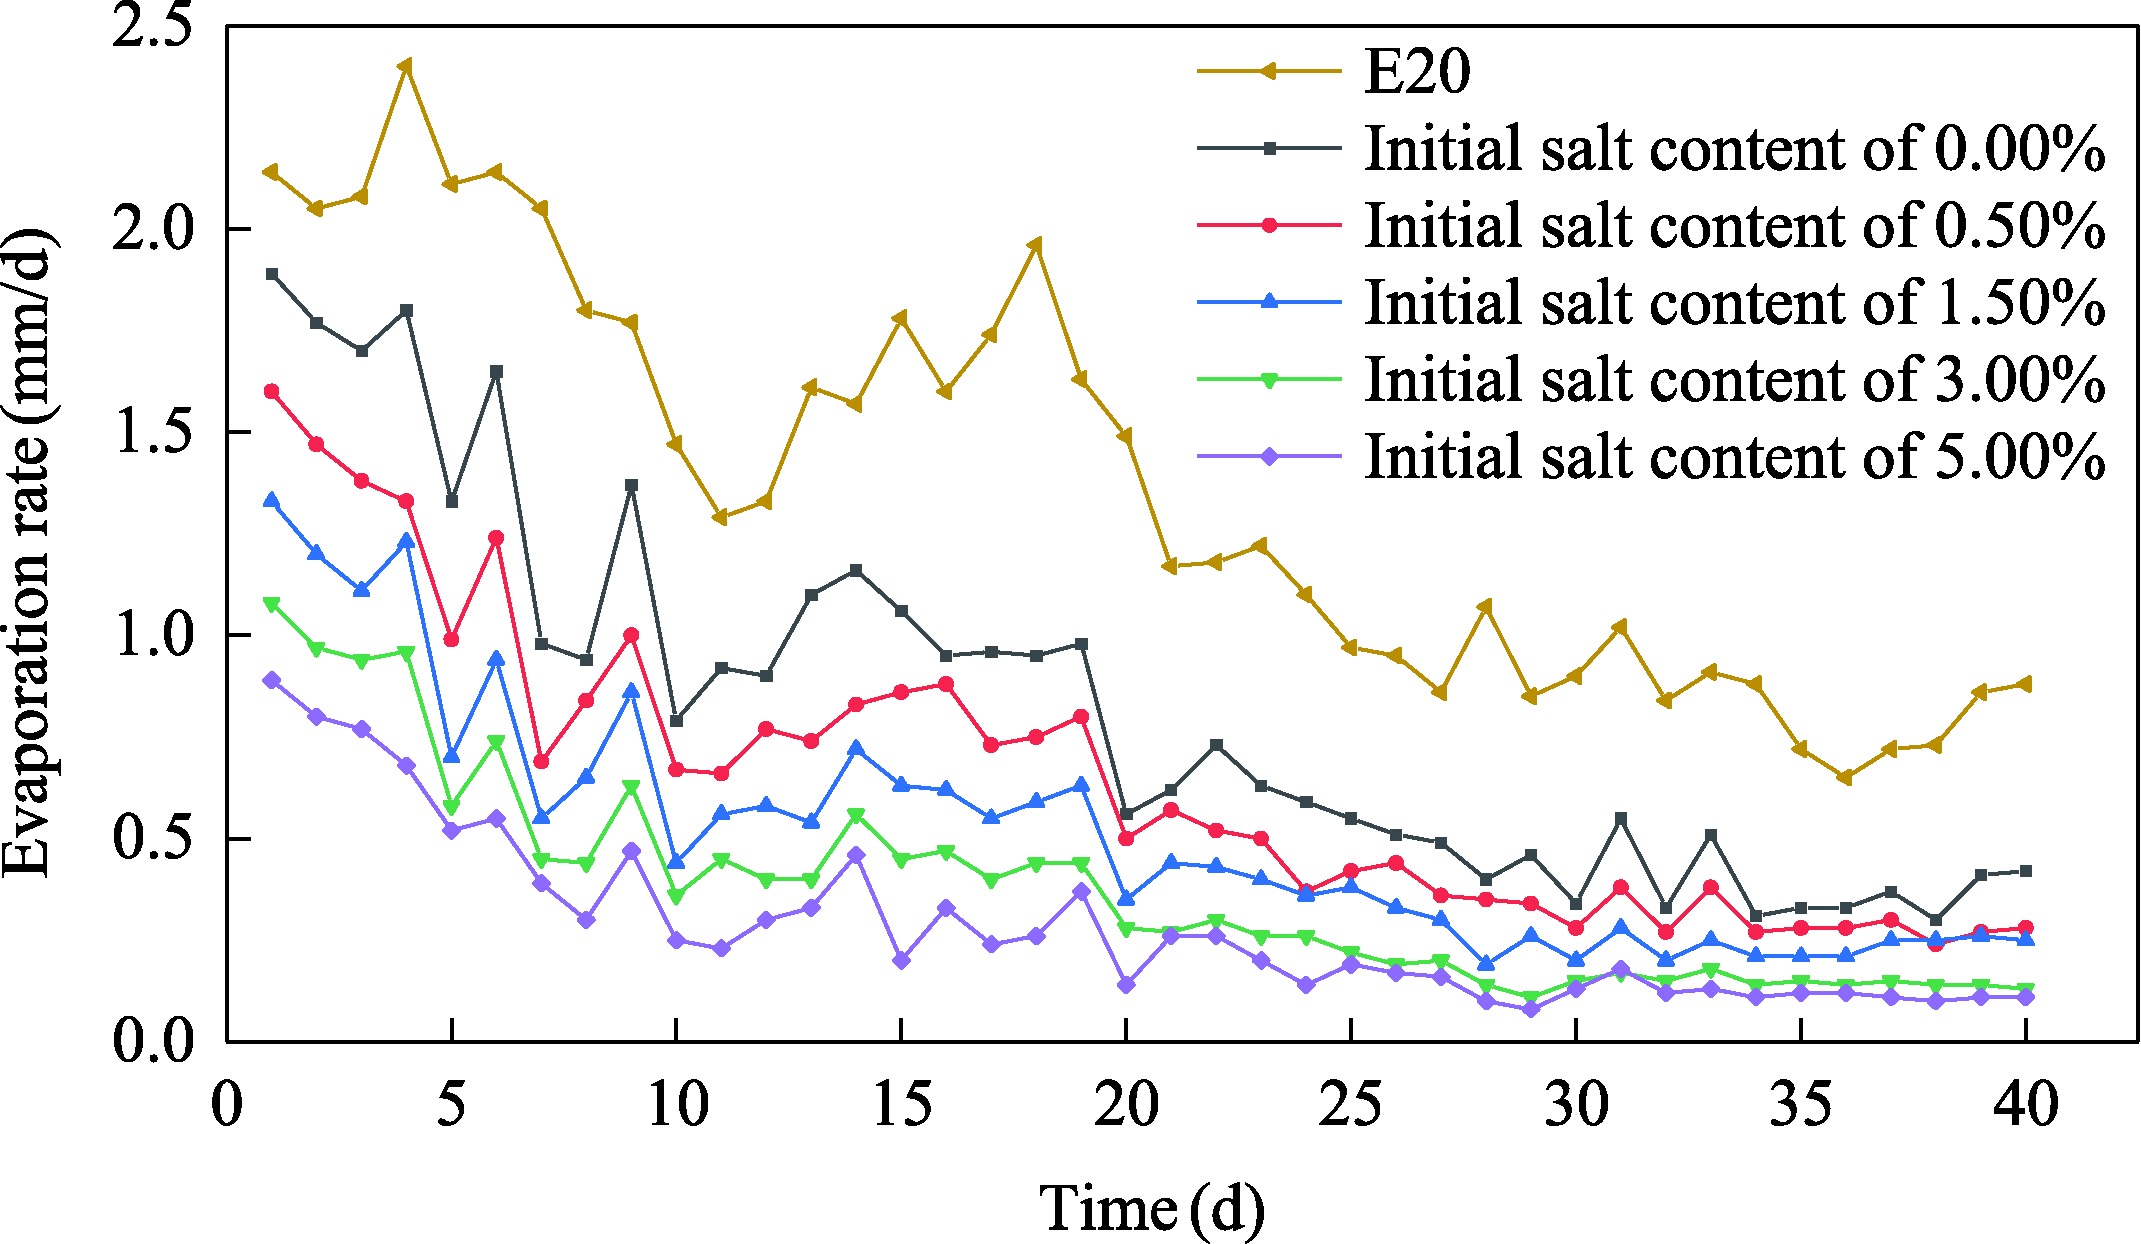
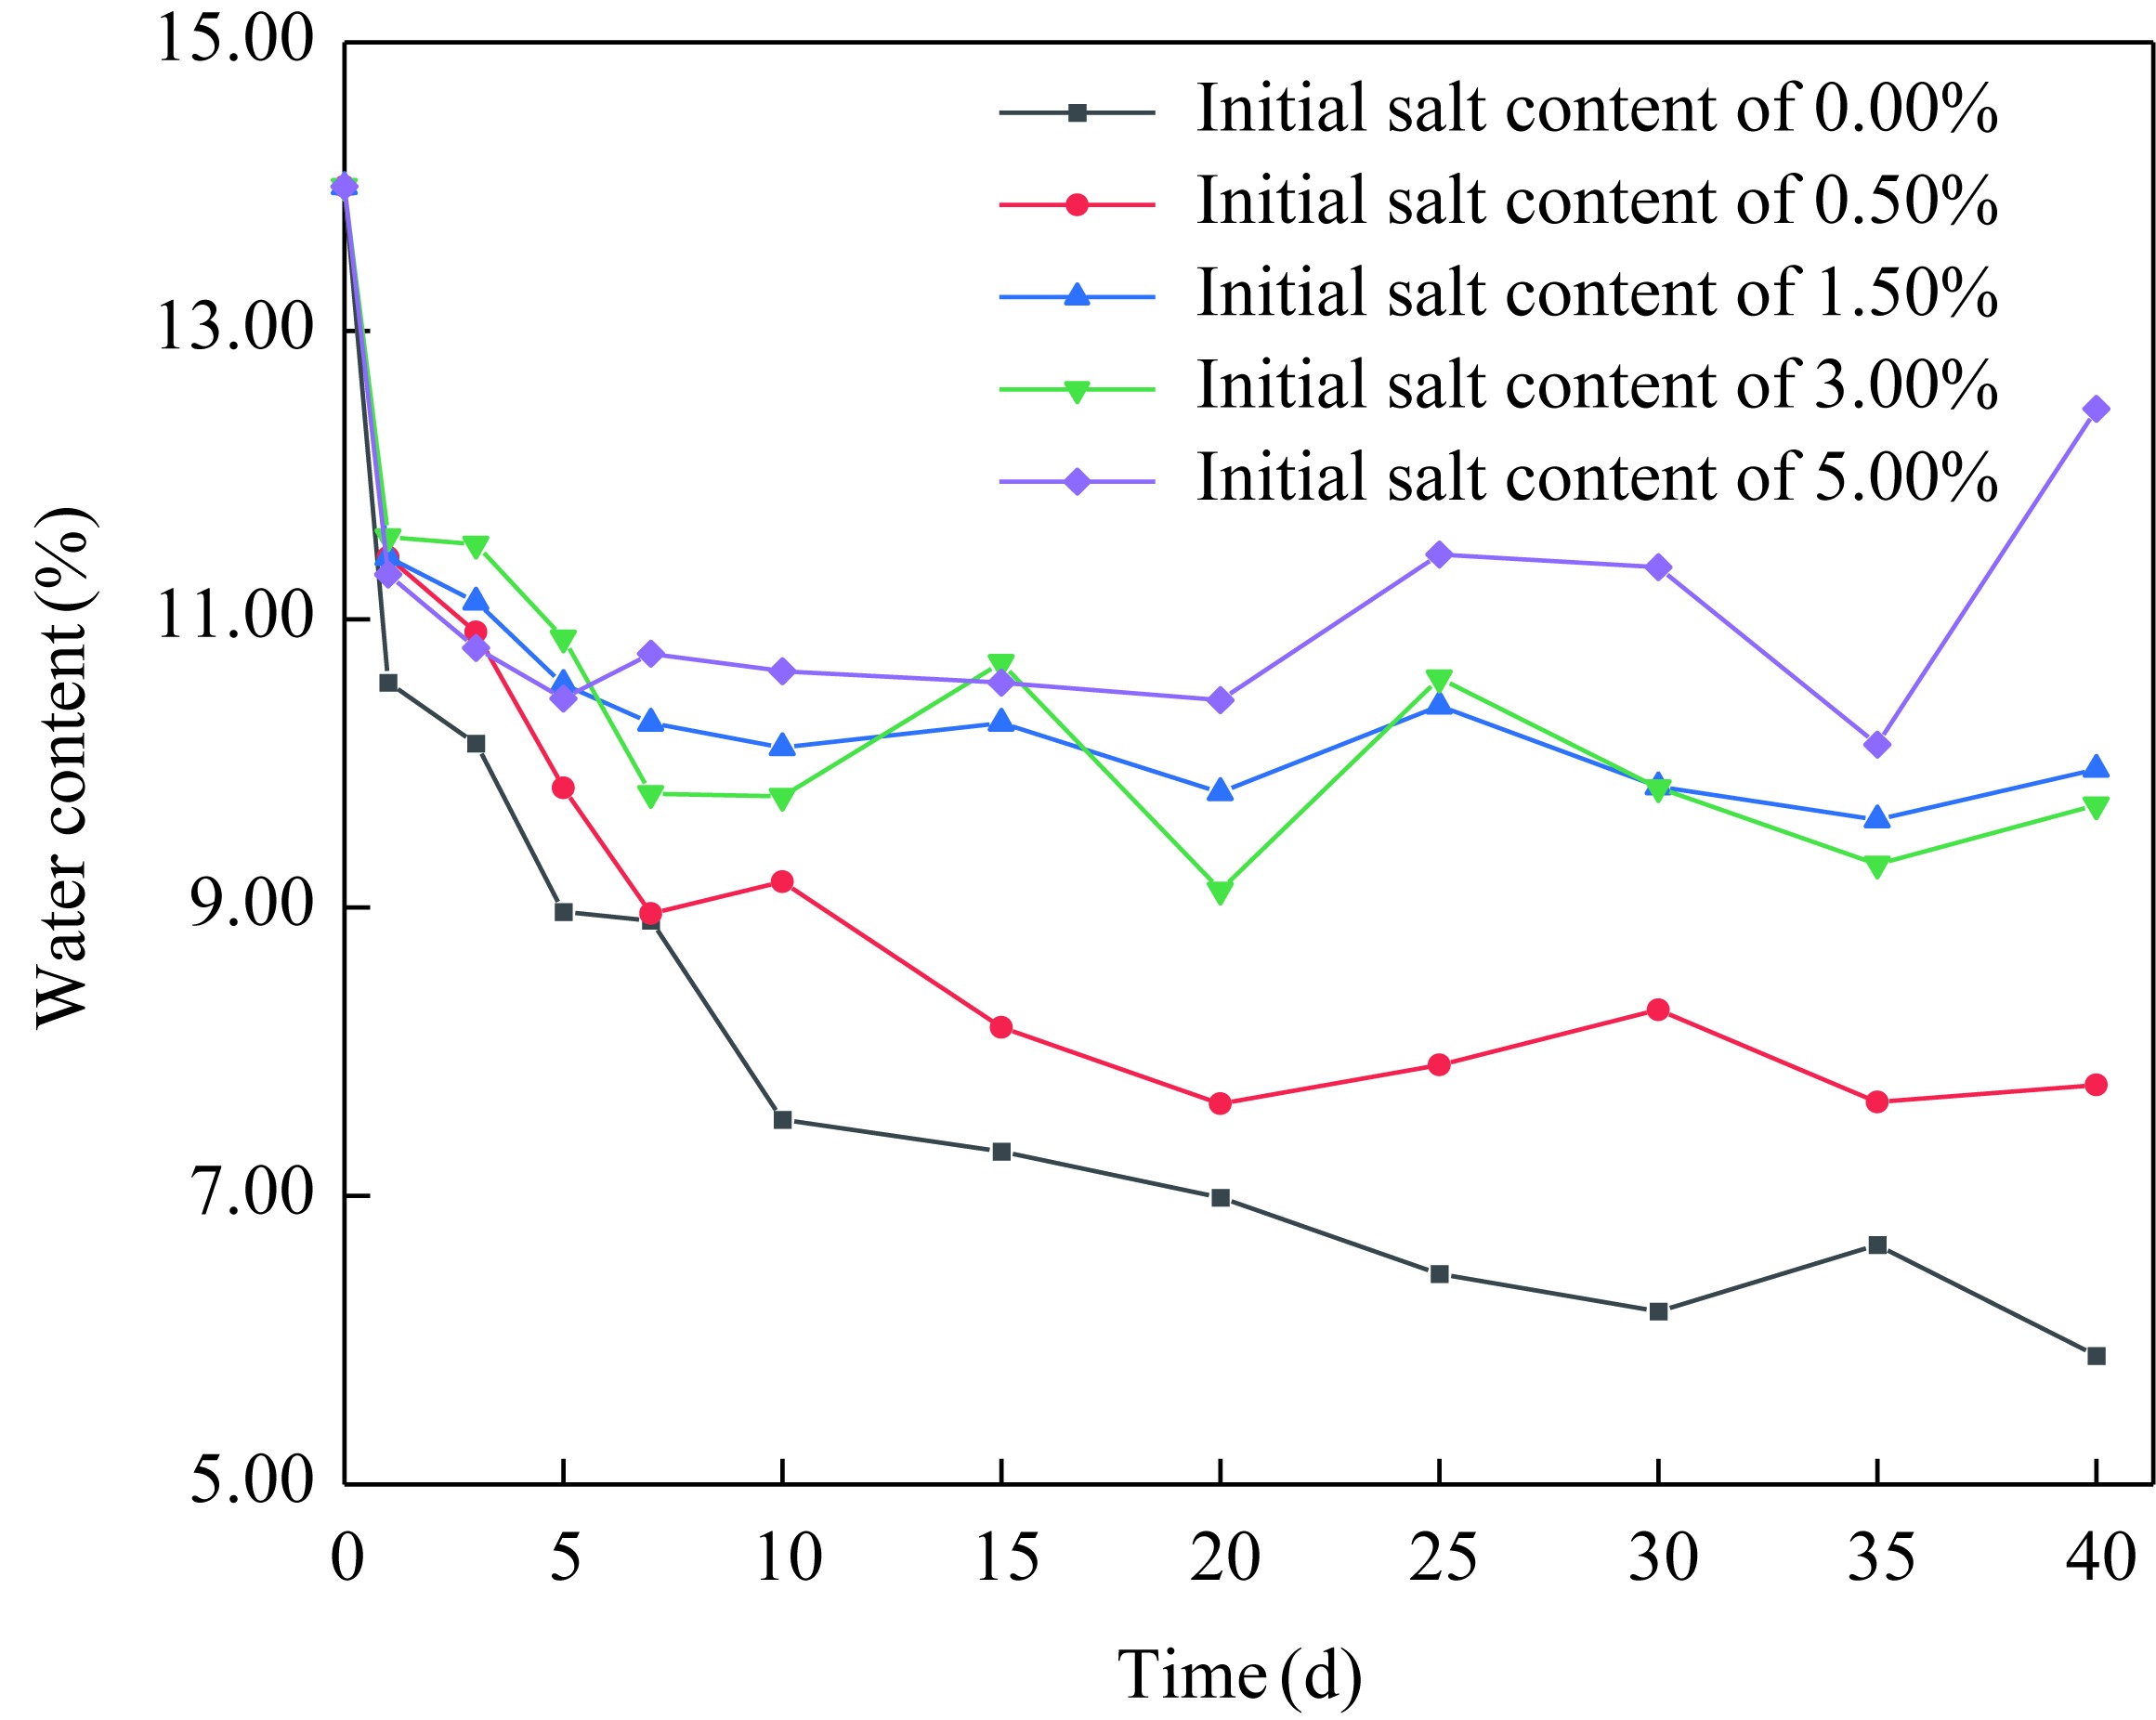
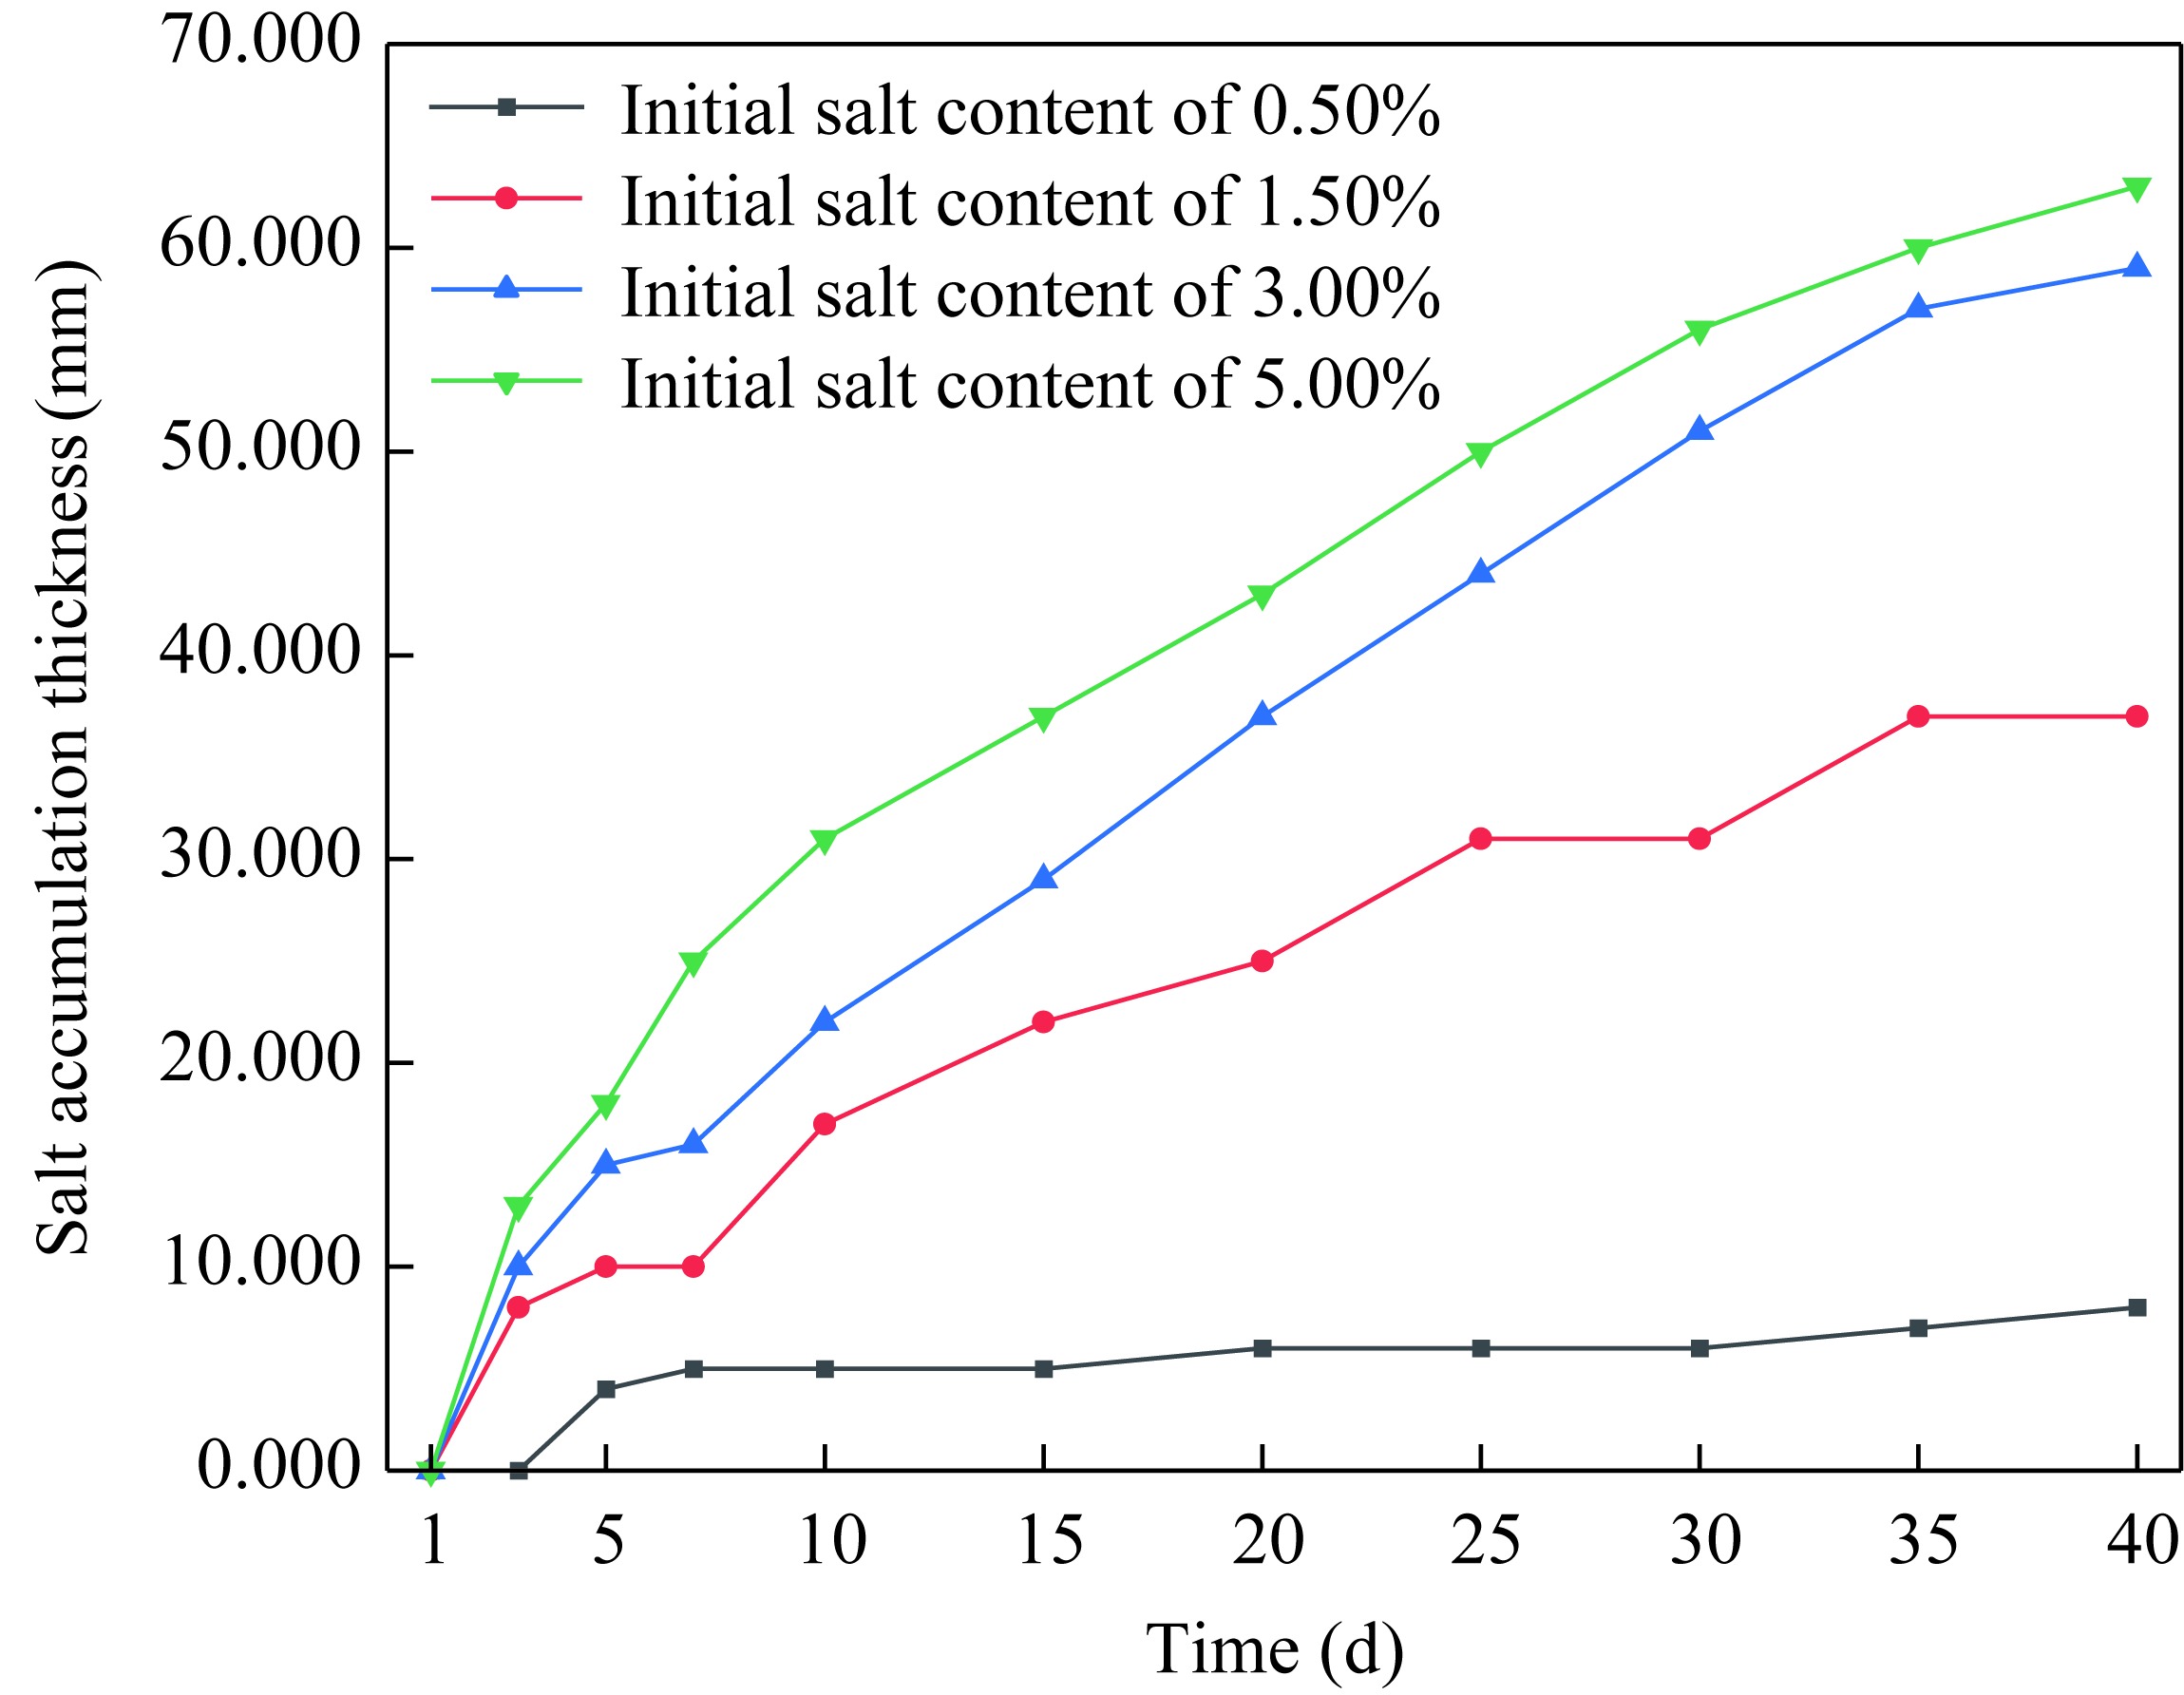
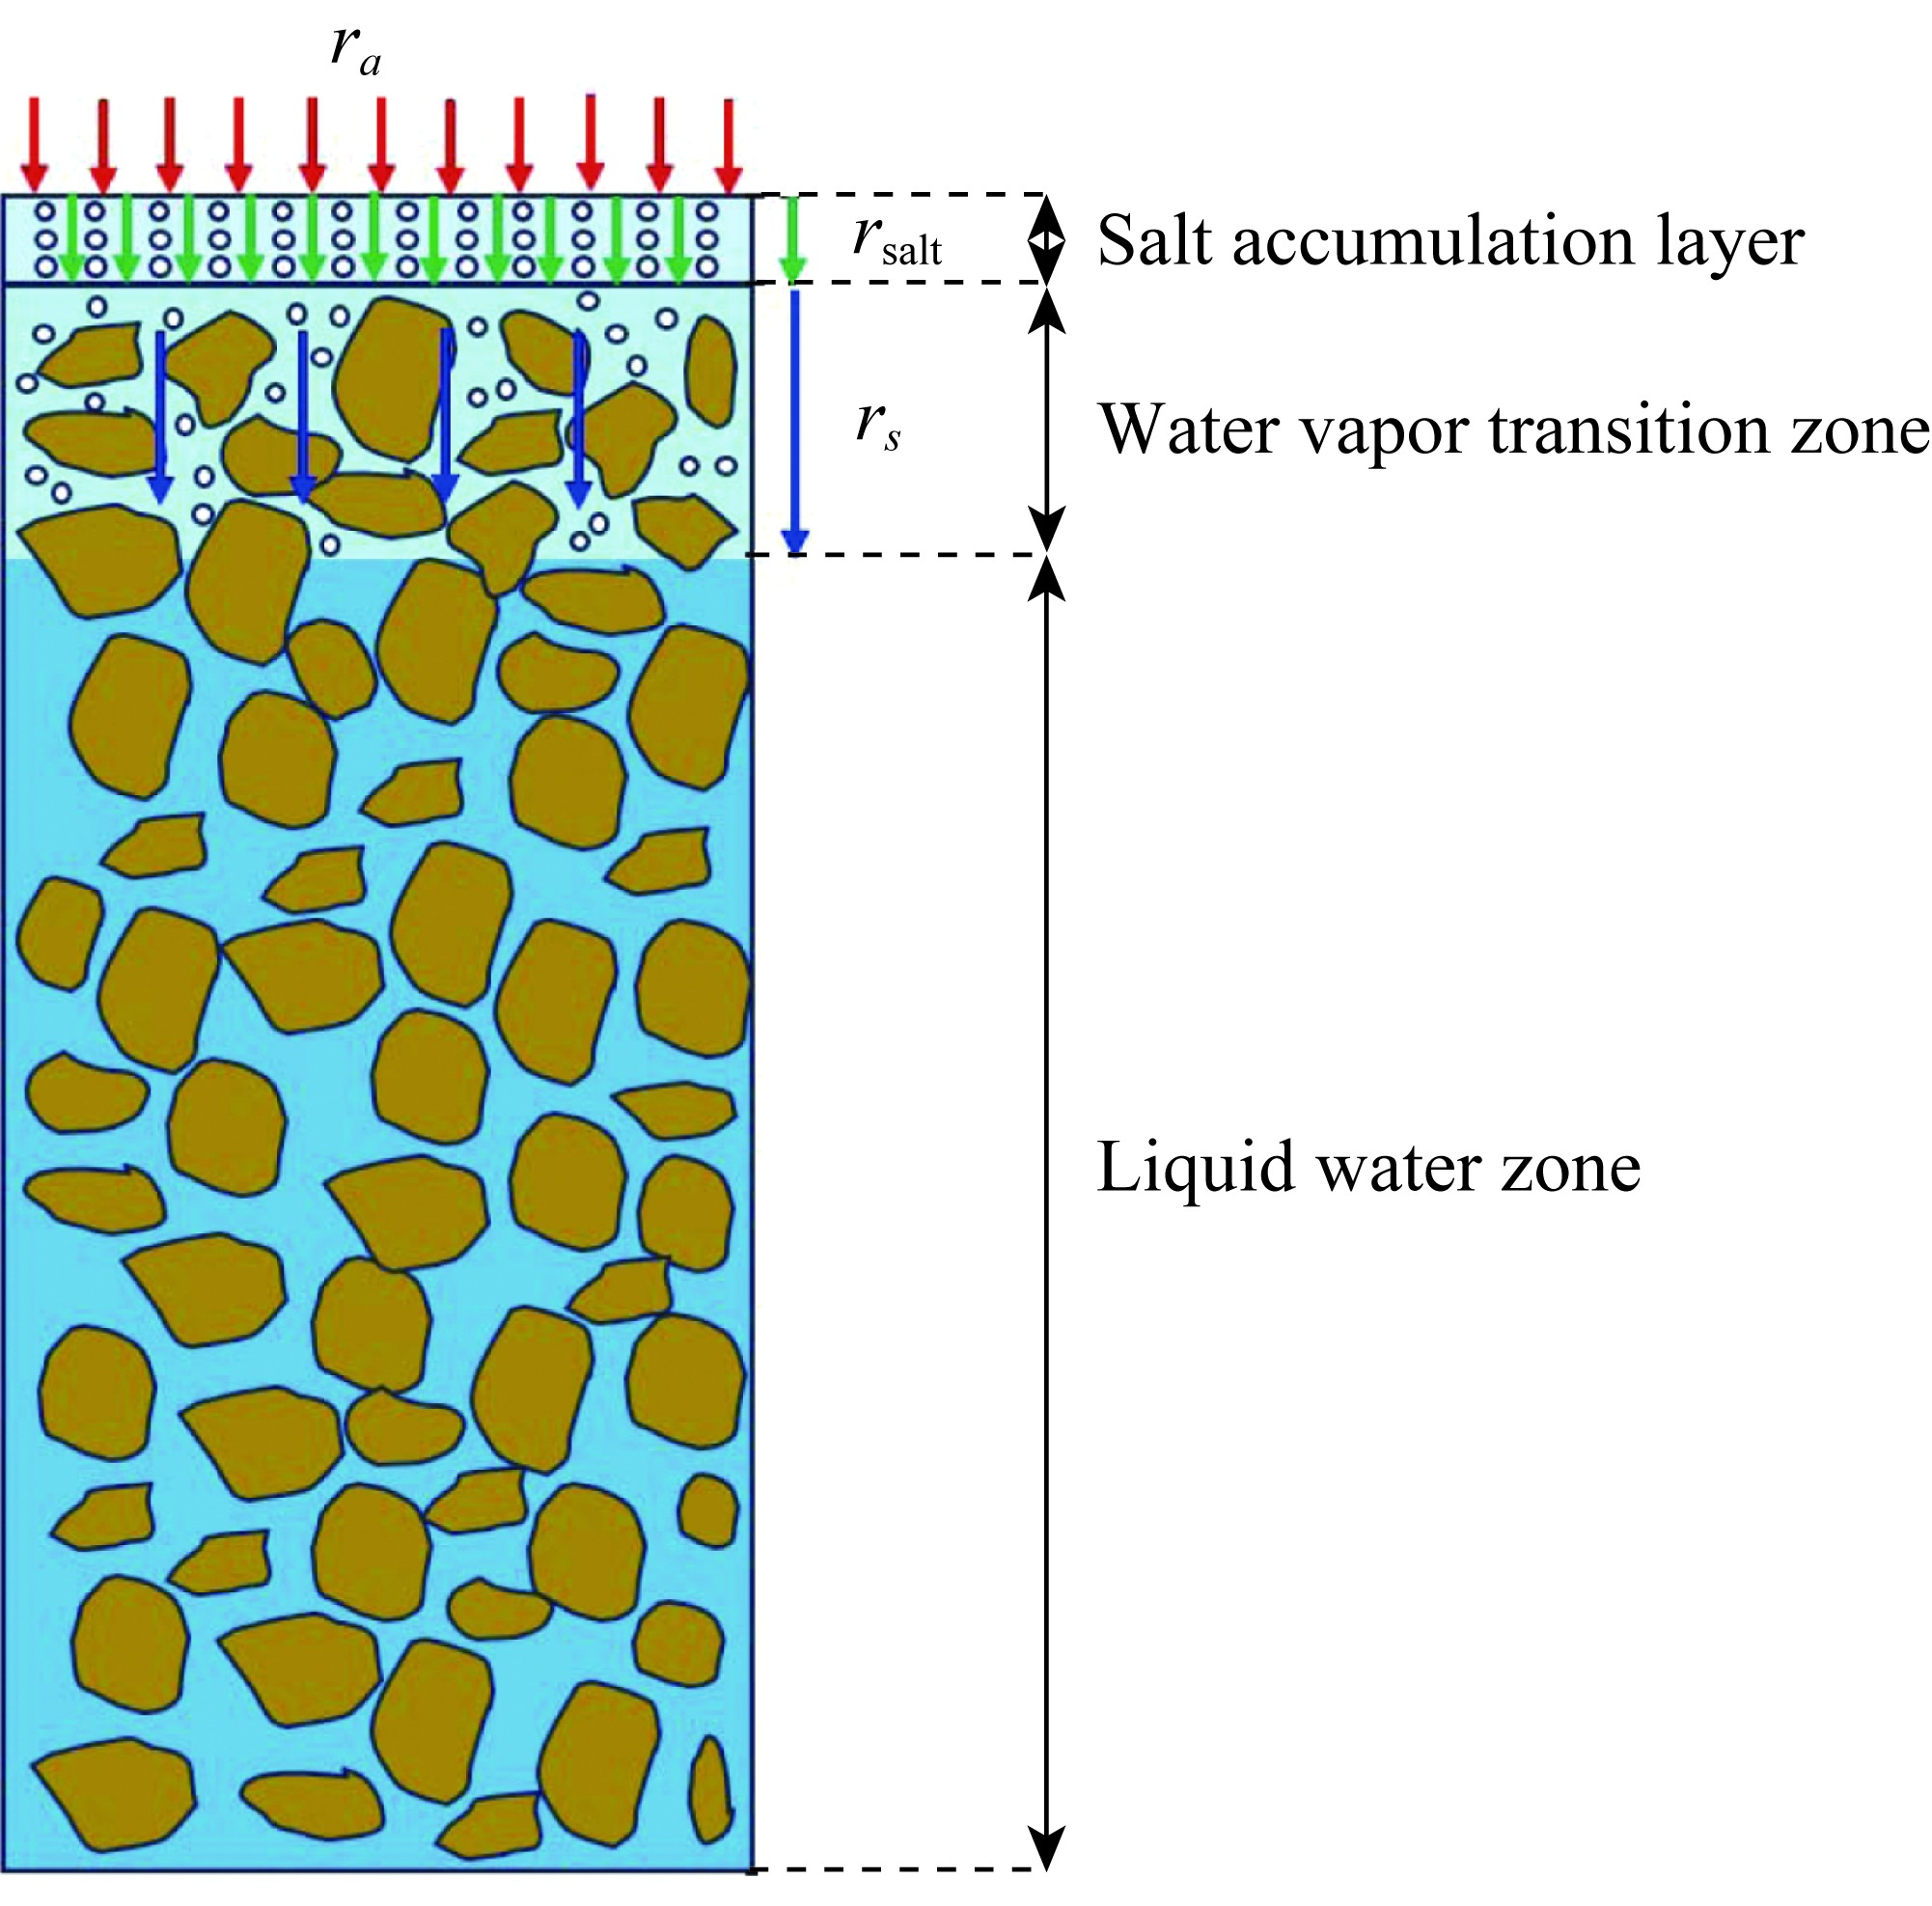
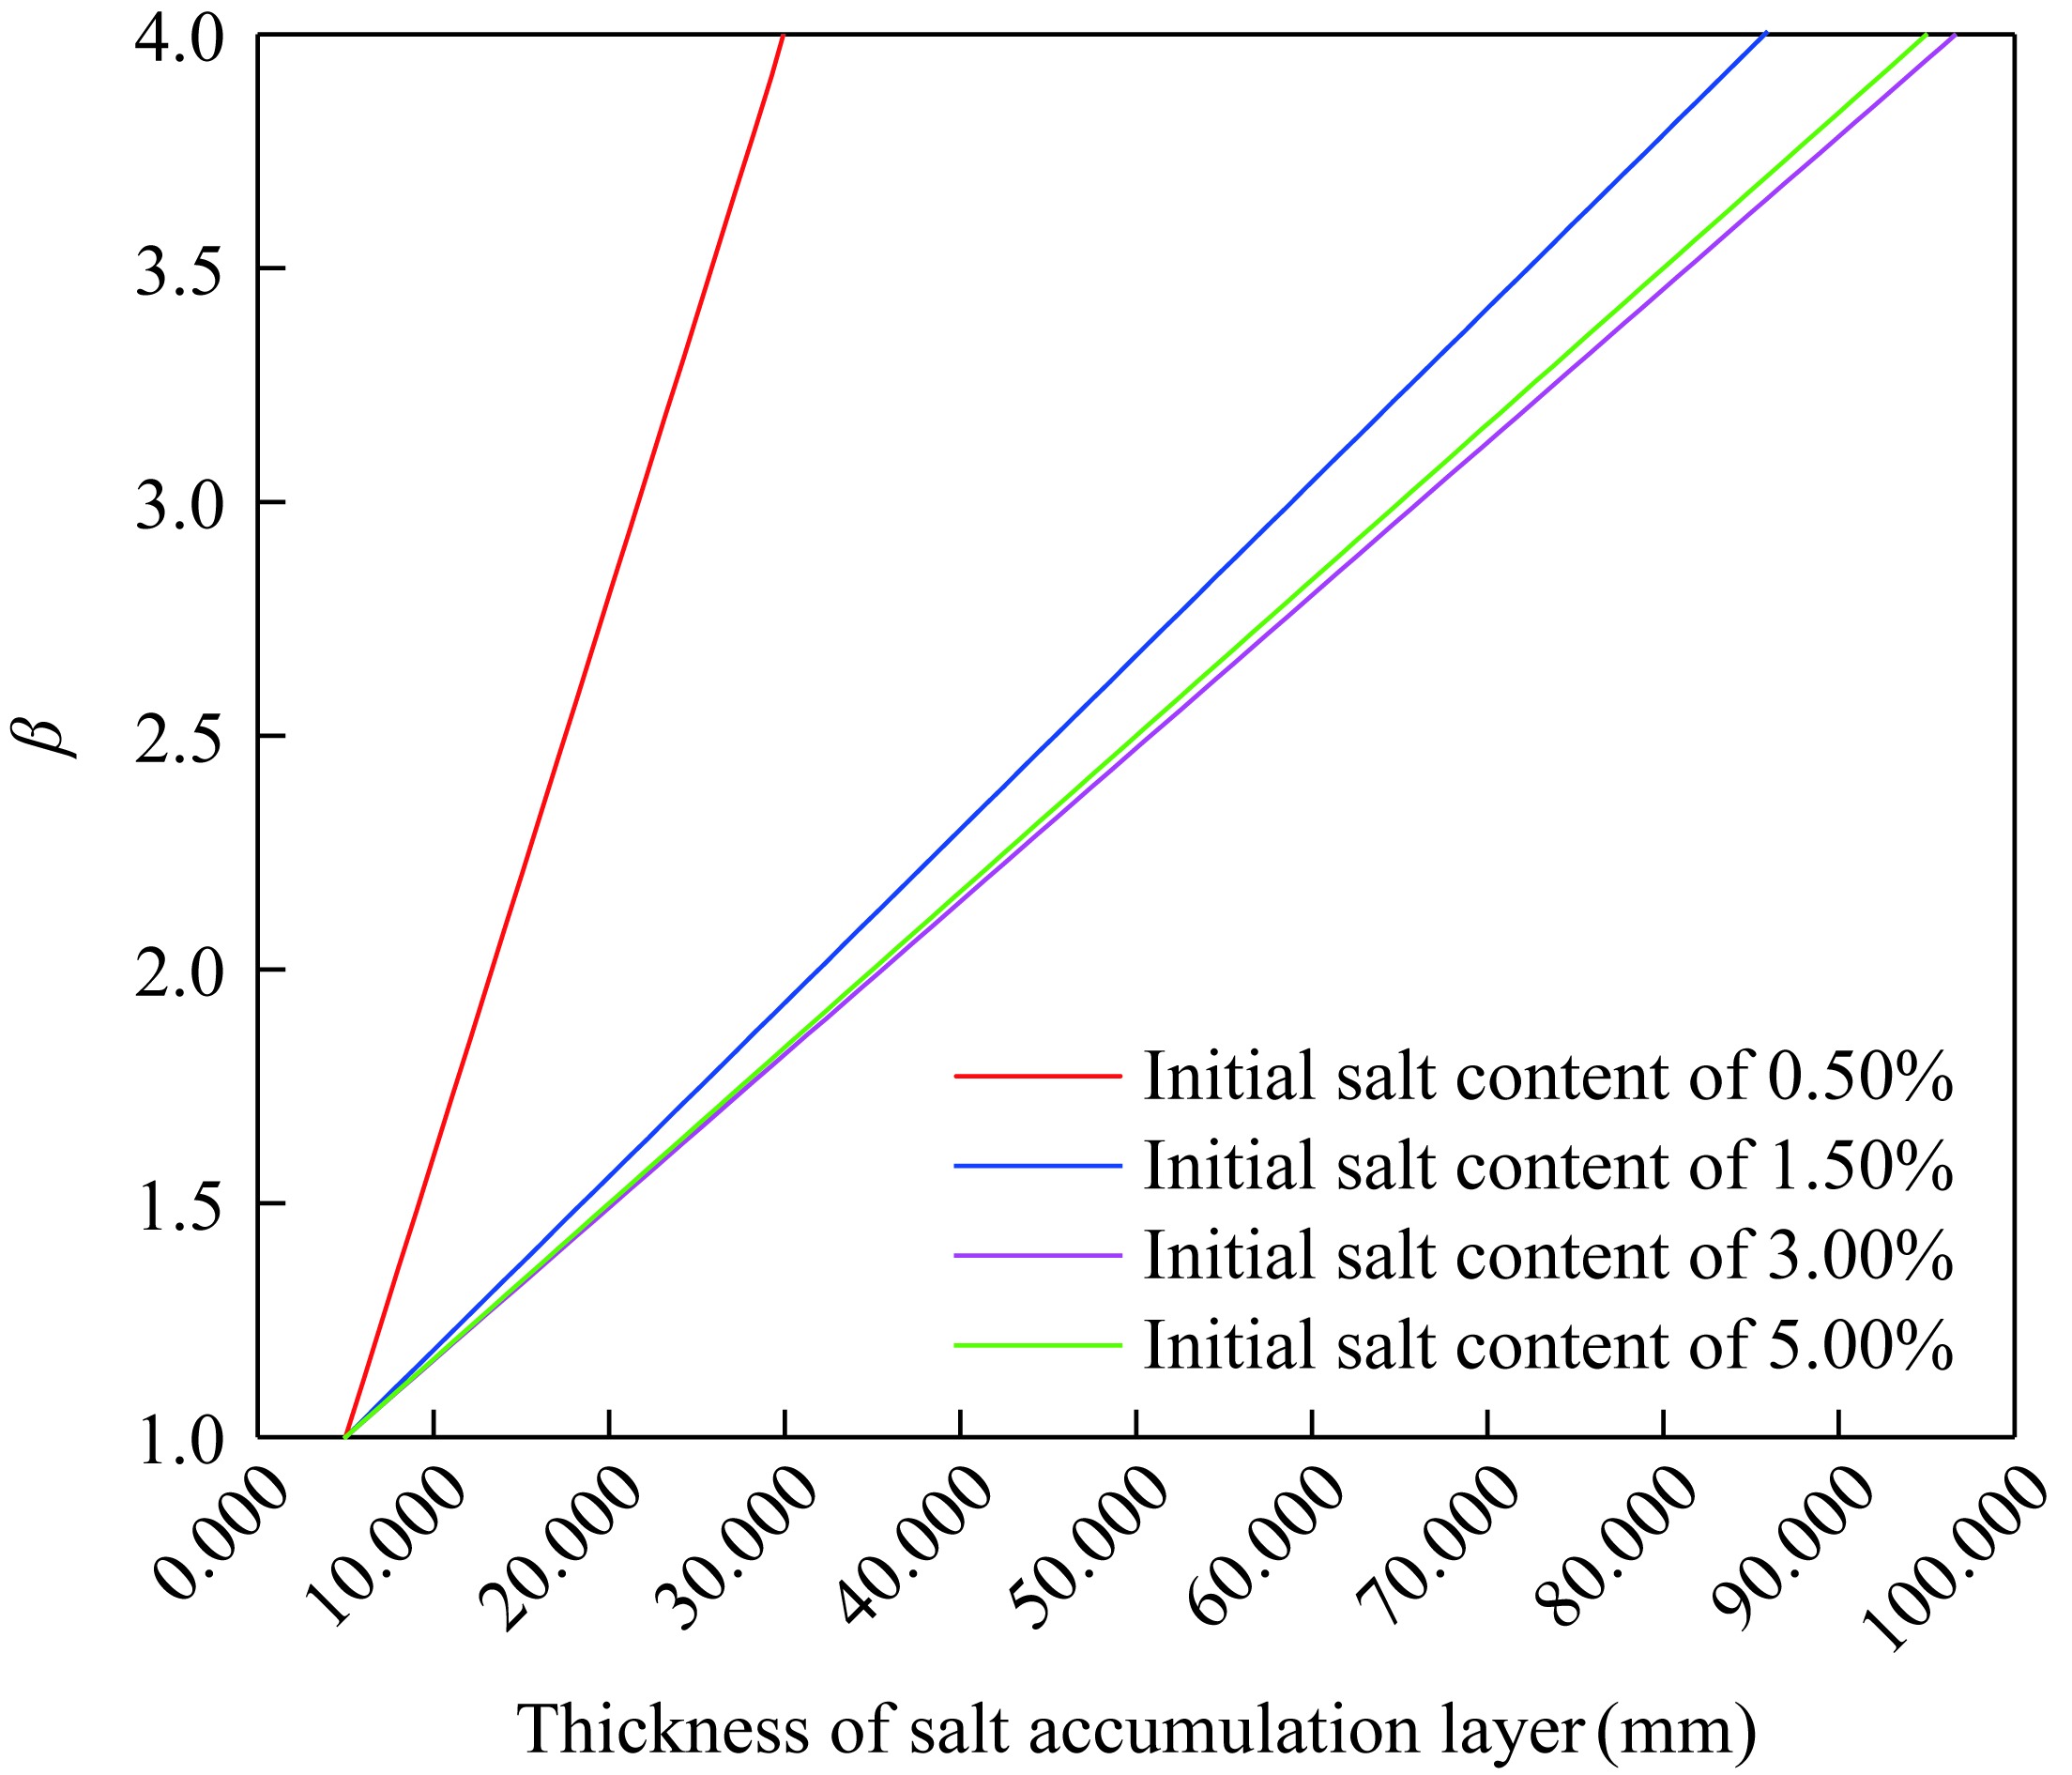
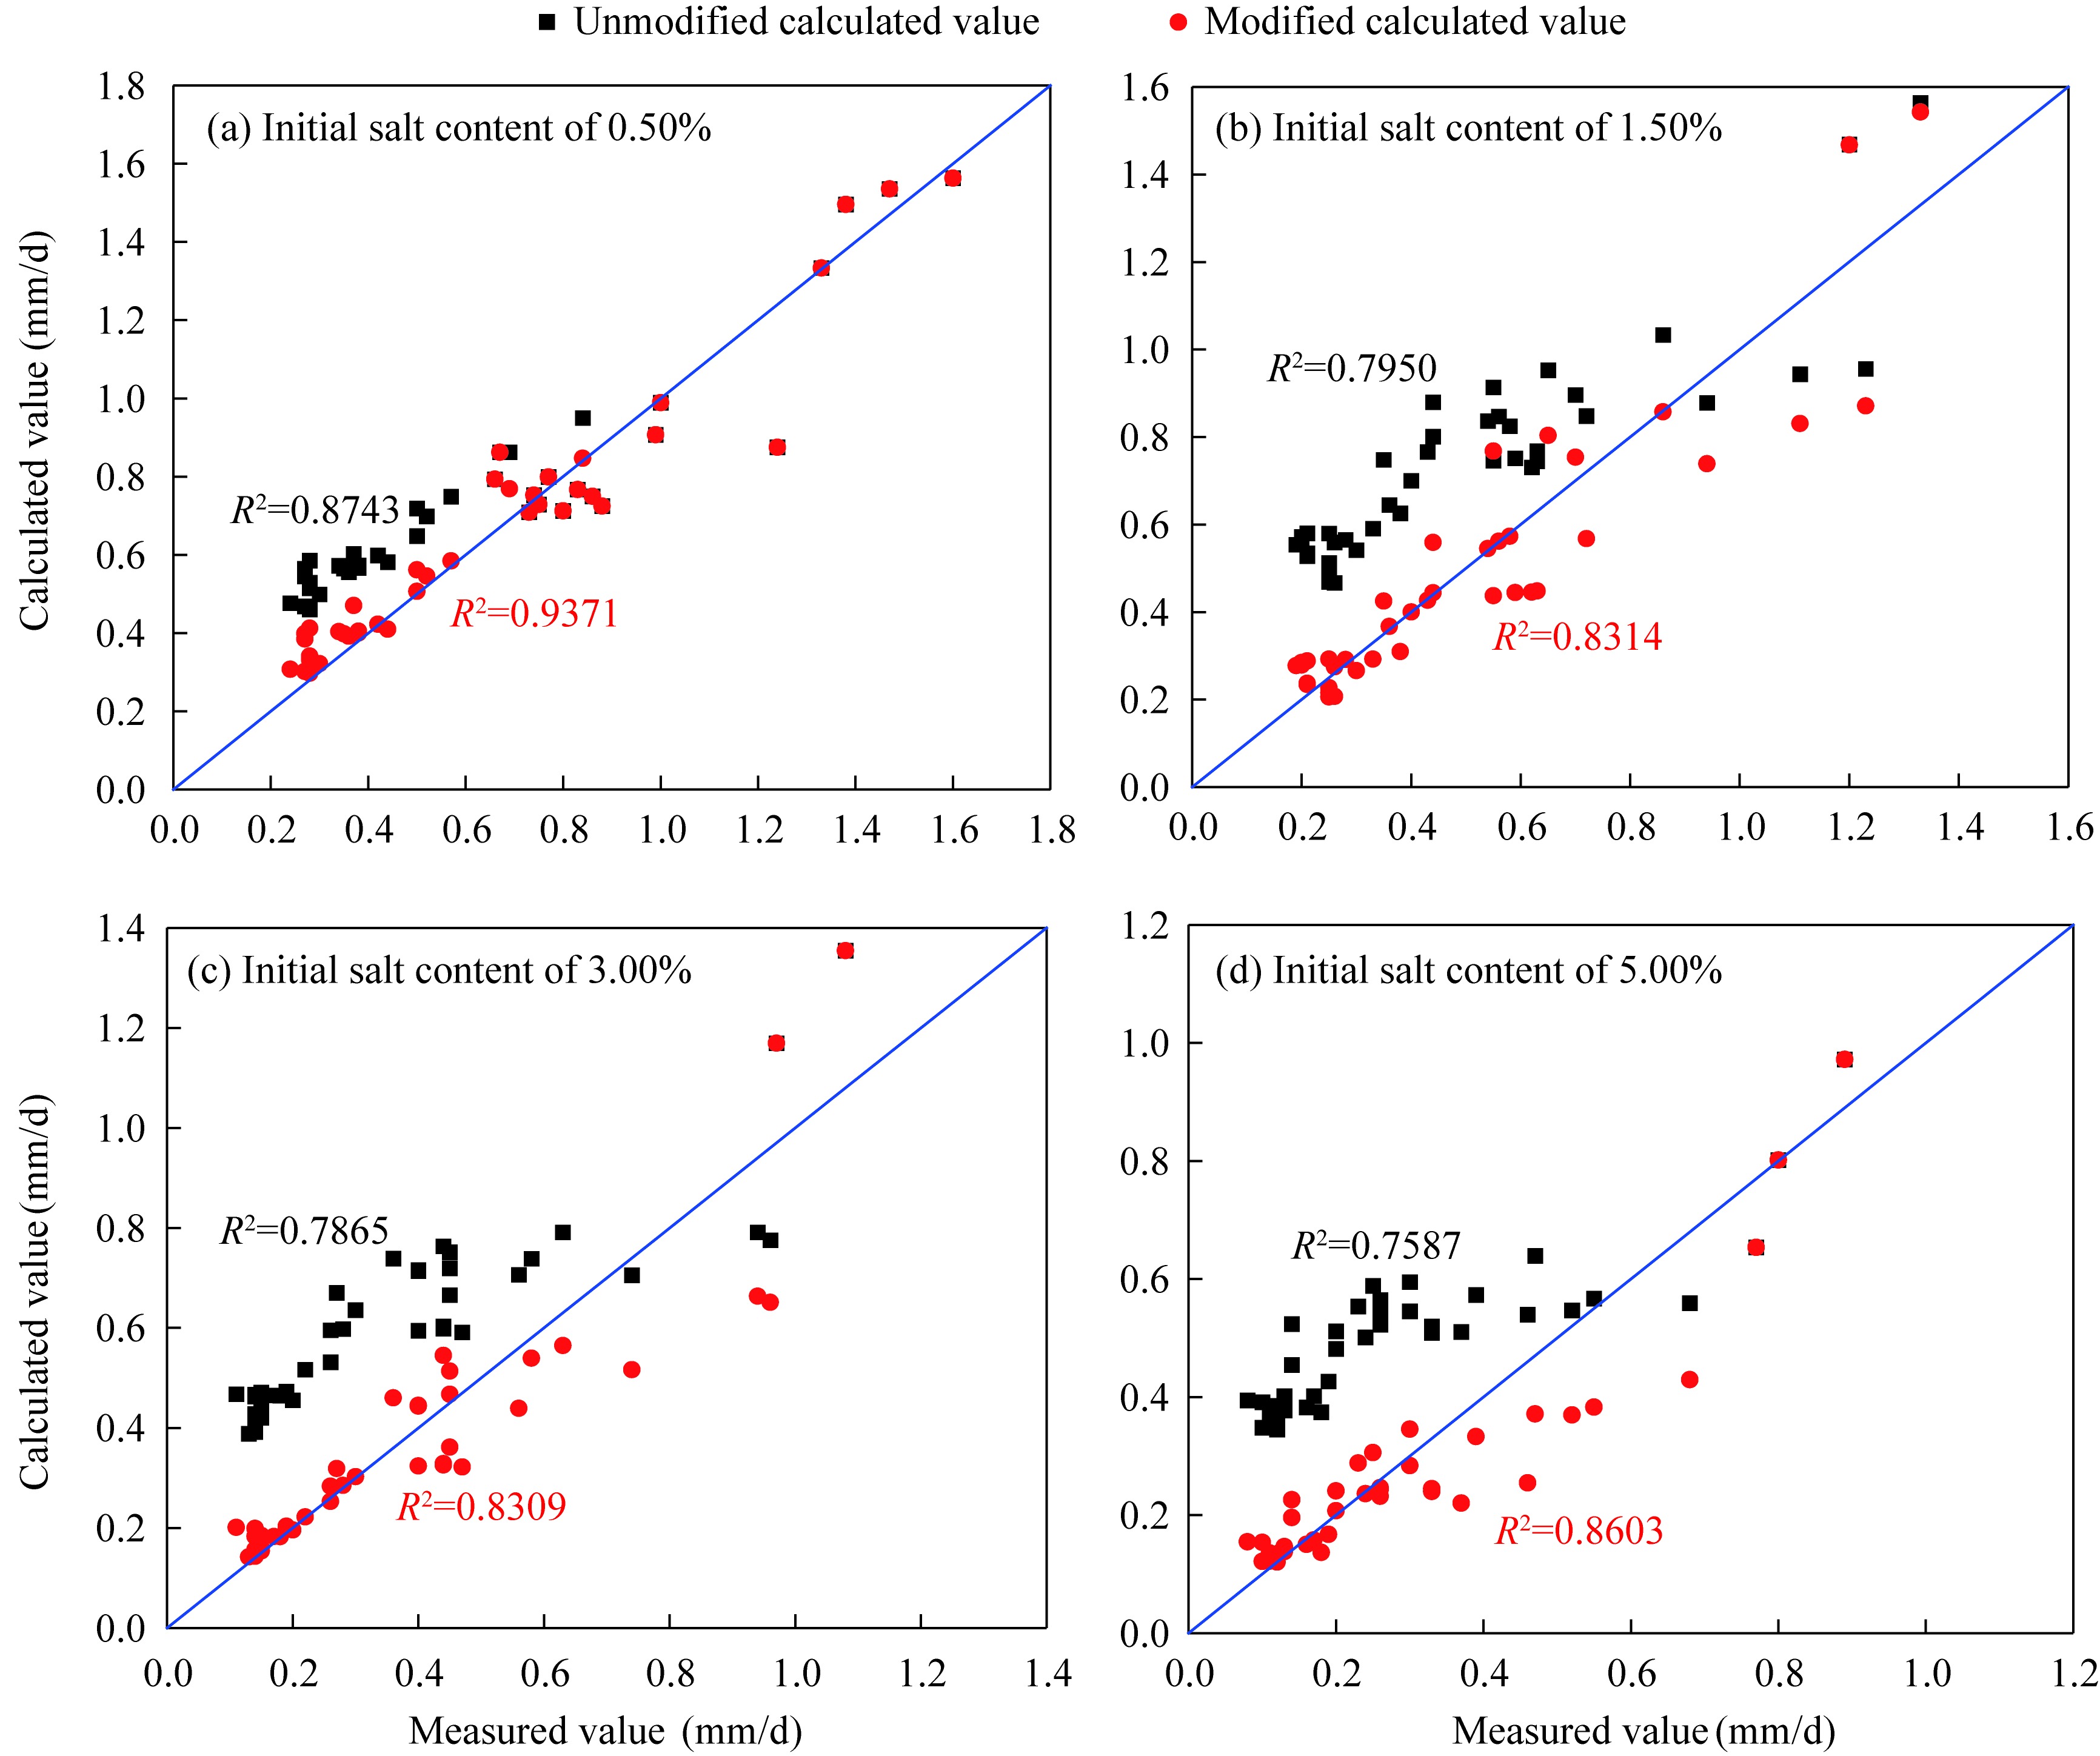
Abstract Intense evaporation in areas with loess-like sulfate saline soils has resulted in significant ecological challenges that include water shortages and soil salinization. Investigating evaporation rate in loess-like sulfate saline soils under varying salt contents carries crucial implications for understanding regional water loss processes, predicting soil salinization advancement, and formulating effective ecological management strategies. Therefore, this study sampled the loess-like sulfate saline soil that is widely distributed in western China as experimental materials and investigated the impact of different initial salt contents (0.00%, 0.50%, 1.50%, 3.00%, and 5.00%) on the evaporation rate, water content, and temperature of soil. The results showed that the evaporation rate decreased with increasing initial salt content. After a salt accumulation layer formed on the soil surface, the water content of the surface soil fluctuated. An increase in the initial salt content resulted in a corresponding increase in the surface temperature. Considering the evaporation characteristics of loess-like sulfate saline soil and the impact of an anomalous increase in surface soil water content on soil surface resistance, this study proposed a modified evaporation model on the basis of Fujimaki's evaporation model of saline soil by introducing a correction coefficient β to modify the soil surface resistance. A comparison of the calculated evaporation rates before and after the modification with the measured evaporation rates revealed a significant improvement in the calculation accuracy of the modified model, indicating that the modified model is capable of more accurately simulating the evaporation rate of sulfate saline soil with different initial salt contents. This paper proposes an effective method for calculating the evaporation rate of loess-like sulfate saline soils, providing a theoretical basis for evaporation research in saline soil.
|
|
Received: 06 January 2025
Published: 31 July 2025
|
|
Corresponding Authors:
*CHOU Yaling (E-mail: chouyaling@lzb.ac.cn)
|
|
|
| [1] |
Aminzadeh M, Or D. 2014. Energy partitioning dynamics of drying terrestrial surfaces. Journal of Hydrology, 519(Part A): 1257-1270.
|
|
|
| [2] |
Bing H, Wu J J, Deng J. 2011. Variations of physical and mechanical properties of saline loess before and after desalting. Journal of Glaciology and Geocryology, 33(4): 796-800. (in Chinese)
|
|
|
| [3] |
China Meteorological Administration. 2025. China Meteorological Administration Yearbook(2020-2024). [2024-12-13]. http://data.cma.cn/.
|
|
|
| [4] |
Chen Y F. 2023. Study on soil-water characteristics and pore distribution of lime-improved loess under freeze-thaw action. MSc Thesis. Lanzhou: Lanzhou University. (in Chinese)
|
|
|
| [5] |
Dai S, Shin H, Santamarina J C. 2016. Formation and development of salt crusts on soil surfaces. Acta Geotechnica, 11: 1103-1109.
|
|
|
| [6] |
Eloukabi H, Sghaier N, Prat M, et al. 2011. Drying experiments in a hydrophobic model porous medium in the presence of a dissolved salt. Chemical Engineering & Technology, 34(7): 1085-1094.
|
|
|
| [7] |
Eloukabi H, Sghaier N, Nasrallah S B, et al. 2013. Experimental study of the effect of sodium chloride on drying of porous media: The crusty-patchy efflorescence transition. International Journal of Heat and Mass Transfer, 56(1-2): 80-93.
|
|
|
| [8] |
Fujimaki H, Shimano T, Inoue M, et al. 2006. Effect of a salt crust on evaporation from a bare saline soil. Vadose Zone Journal, 5(4): 1246-1256.
|
|
|
| [9] |
Gran M, Carrera J, Massana J, et al. 2011a. Dynamics of water vapor flux and water separation processes during evaporation from a salty dry soil. Journal of Hydrology, 396(3-4): 215-220.
|
|
|
| [10] |
Gran M, Carrera J, Olivella S, et al. 2011b. Modeling evaporation processes in a saline soil from saturation to oven dry conditions. Hydrology and Earth System Sciences, 15: 2077-2089.
|
|
|
| [11] |
Guglielmini L, Gontcharov A, Aldykiewicz A J, et al. 2008. Drying of salt solutions in porous materials: Intermediate-time dynamics and efflorescence. Physics of Fluids, 20(7): 077101, doi:10.1063/1.2954037.
|
|
|
| [12] |
Hughes J D, Sanford W E. 2013. SUTRA-MS: A Version of SUTRA Modified to Simulate Heat and Multiple-Solute Transport:Usgs Open-File Report 2004-1207. Reston: Bibliogov, 17-45.
|
|
|
| [13] |
Kang H W. 2020. Study on soil-water characteristic curve and pore characteristic of intact loess. MSc Thesis. Xi'an: Chang'an University. (in Chinese)
|
|
|
| [14] |
Lai Y M, Wen W, Pei W S, et al. 2021. A novel transport model to predict the moisture-heat-gas-salt behavior in unsaturated saline soil under evaporation. Journal of Hydrology, 603(Part C): 127052, doi: 10.1016/j.jhydrol.2021.127052.
|
|
|
| [15] |
Li Q, Yao Y P, Han L M, et al. 2014. Pot-cover effect of soil. Industrial Construction, 44(2): 69-71. (in Chinese)
|
|
|
| [16] |
Li X H, Shi F Z. 2019. The effect of flooding on evaporation and the groundwater table for a salt-crusted soil. Water, 11(5): 1003, doi: 10.3390/w11051003.
|
|
|
| [17] |
Li X H, Shi F Z. 2021. Effects of evolving salt precipitation on the evaporation and temperature of sandy soil with a fixed groundwater table. Vadose Zone Journal, 20(3): e20122, doi: 10.1002/vzj2.20122.
|
|
|
| [18] |
Li X H, Guo M. 2022. Experimental study of evaporation flux, salt precipitation, and surface temperature on homogeneous and heterogeneous porous media. Advances in Civil Engineering, 2022: 7434471, doi: 10.1155/2022/7434471.
|
|
|
| [19] |
Li X H, Guo M, Wang H C. 2022. Impact of soil texture and salt type on salt precipitation and evaporation under different hydraulic conditions. Hydrological Processes 36(11): e14763, doi: 10.1002/hyp.14763.
|
|
|
| [20] |
Licsandru G, Noiriel C, Duru P, et al. 2019. Dissolution-precipitation-driven upward migration of a salt crust. Physical Review E, 100: 032802, doi: 10.1103/physreve.100.032802.
|
|
|
| [21] |
Lim W H, Roderick M L, Hobbins M T, et al. 2012. The aerodynamics of pan evaporation. Agricultural and Forest Meteorology, 152: 31-43.
|
|
|
| [22] |
Liu X C, Xu W J, Zhan L T, et al. 2016. Laboratory and numerical study on an enhanced evaporation process in a loess soil column subjected to heating. Journal of Zhejiang University-SCIENCE A, 17: 553-564.
|
|
|
| [23] |
Mao W, Zhu Y, Wu J W, et al. 2020. Modelling the salt accumulation and leaching processes in arid agricultural areas with a new mass balance model. Journal of Hydrology, 591: 125329, doi: 10.1016/j.jhydrol.2020.125329.
|
|
|
| [24] |
Maxwell R M, Condon L E. 2016. Connections between groundwater flow and transpiration partitioning. Science, 353: 377-380.
doi: 10.1126/science.aaf7891
pmid: 27463671
|
|
|
| [25] |
Mengistu A G, van Rensburg L D, Mavimbela S S W. 2018. Shallow groundwater effects on evaporation and soil temperature in two windblown sands (Eutric Cambisol and Chromic Luvisol) in South Africa. Geoderma Regional, 15: e00190, doi: 10.1016/j.geodrs.2018.e00190.
|
|
|
| [26] |
Ministry of Water Resources of the People's Republic of China.2019. Standard for Geotechnical Testing Method (GB/T 50123-2019). [2024-12-27]. https://oss.henan.gov.cn/typtfile/20210412/0e02cd5765cb4785910b3c2d93311e16.pdf.
|
|
|
| [27] |
Monteith J L. 1981. Evaporation and surface temperature. Quarterly Journal of the Royal Meteorological Society, 107(451): 1-27.
|
|
|
| [28] |
Mosaffa H R, Sepaskhah A R. 2019. Performance of irrigation regimes and water salinity on winter wheat as influenced by planting methods. Agricultural Water Management, 216: 444-456.
doi: 10.1016/j.agwat.2018.10.027
|
|
|
| [29] |
Nachshon U, Weisbrod N, Dragila M I, et al. 2011. Combined evaporation and salt precipitation in homogeneous and heterogeneous porous media. Water Resources Research, 47(3): W03513, doi: 10.1029/2010wr009677.
|
|
|
| [30] |
Nachshon U, Weisbrod N, Katzir R, et al. 2018. NaCl crust architecture and its impact on evaporation: Three-dimensional insights. Geophysical Research Letters, 45(12): 6100-6108.
|
|
|
| [31] |
Noborio K, McInnes K J. 1993. Thermal conductivity of salt-affected soils. Soil Science Society of America Journal, 57(2): 329-334.
|
|
|
| [32] |
Noborio K, McInnes K J, Heilman J L. 1996. Two-dimensional model for water, heat, and solute transport in furrow-irrigated soil: I. theory. Soil Science Society of America Journal, 60(4): 1001-1009.
|
|
|
| [33] |
Piotrowski J, Huisman J A, Nachshon U, et al. 2020. Gas permeability of salt crusts formed by evaporation from porous media. Geosciences, 10(11): 423, doi:10.3390/geosciences10110423.
|
|
|
| [34] |
Rad M N, Shokri N. 2012. Nonlinear effects of salt concentrations on evaporation from porous media. Geophysical Research Letters, 39(4): 4403, doi: 10.1029/2011gl050763.
|
|
|
| [35] |
Roy R, Weibel J A, Garimella S V. 2022. Modeling the formation of efflorescence and subflorescence caused by salt solution evaporation from porous media. International Journal of Heat and Mass Transfer, 189: 122645, doi: 10.1016/j.ijheatmasstransfer.2022.122645.
|
|
|
| [36] |
Sadeghi M, Taghikhani V, Ghotbi C. 2010. Measurement and correlation of surface tension for single aqueous electrolyte solutions. International Journal of Thermophysics, 31: 852-859.
|
|
|
| [37] |
Saito H, Šimůnek J, Mohanty B P. 2006. Numerical analysis of coupled water, vapor, and heat transport in the vadose zone. Vadose Zone Journal, 5(2): 784-800.
|
|
|
| [38] |
Sghaier N, Geoffroy S, Prat M, et al. 2014. Evaporation-driven growth of large crystallized salt structures in a porous medium. Physical Review E, 90: 042402, doi: 10.1103/physreve.90.042402.
|
|
|
| [39] |
Shokri-Kuehni S M S, Rad M N, Webb C, et al. 2017a. Impact of type of salt and ambient conditions on saline water evaporation from porous media. Advances in Water Resources, 105: 154-161.
|
|
|
| [40] |
Shokri‐Kuehni S M S, Vetter T, Webb C, et al. 2017b. New insights into saline water evaporation from porous media: Complex interaction between evaporation rates, precipitation, and surface temperature. Geophysical Research Letters, 44(11): 5504-5510.
|
|
|
| [41] |
Shokri-Kuehni S M S, Raaijmakers B, Kurz T, et al. 2020. Water table depth and soil salinization: from pore-scale processes to field-scale responses. Water Resources Research, 56(2): e2019WR026707, doi: 10.1029/2019WR026707.
|
|
|
| [42] |
Suchan J, Azam S. 2022. Influence of saline pore fluid on soil behavior during evaporation. Geotechnics, 2(3): 754-764.
|
|
|
| [43] |
Sutanto S J, Wenninger J, Coenders-Gerrits A M J, et al. 2012. Partitioning of evaporation into transpiration, soil evaporation and interception: A comparison between isotope measurements and a HYDRUS-1D model. Hydrology and Earth System Sciences, 16(8): 2605-2616.
|
|
|
| [44] |
Tsui N, Flatt R J, Scherer G W. 2003. Crystallization damage by sodium sulfate. Journal of Cultural Heritage, 4(2): 109-115.
|
|
|
| [45] |
Veran-Tissoires S, Marcoux M, Prat M. 2012. Discrete salt crystallization at the surface of a porous medium. Physical Review Letters, 108: 054502, doi: 10.1103/PhysRevLett.108.054502.
|
|
|
| [46] |
Wang H C, Li X H, Guo M, et al. 2024. Effect of salt types on salt precipitation and water transport in saline sandy soil. Hydrological Processes, 38(3): e15123, doi: 10.1002/hyp.15123.
|
|
|
| [47] |
Wang H C, Li X H, Li J L, et al. 2025. Impact of salt precipitation on evaporation resistance under different soil textures. Environmental Earth Sciences, 84: 12, doi: 10.1007/s12665-024-12014-1.
|
|
|
| [48] |
Wang X X. 2015. Vapor flow resistance of dry soil layer to soil water evaporation in arid environment: An overview. Water, 7(8): 4552-4574.
|
|
|
| [49] |
Wang Y Q, Merlin O, Zhu G F, et al. 2019. A physically based method for soil evaporation estimation by revisiting the soil drying process. Water Resources Research, 55(11): 9092-9110.
|
|
|
| [50] |
Wilson G W. 1990. Soil evaporative fluxes for geotechnical engineering problems. PhD Dissertation. Saskatoon: University of Saskatchewan, 87-93.
|
|
|
| [51] |
Wilson G W, Fredlund D G, Barbour S L. 1994. Coupled soil-atmosphere modelling for soil evaporation. Canadian Geotechnical Journal, 31(2): 151-161.
|
|
|
| [52] |
Xu Z Q, Chen S, Nachshon U, et al. 2025. Modeling evaporation dynamics from soils with major chlorides and high salinity. Journal of Hydrology, 655: 132943, doi: 10.1016/j.jhydrol.2025.132943.
|
|
|
| [53] |
Yusefi A, Firouzi A F, Aminzadeh M. 2020. The effects of shallow saline groundwater on evaporation, soil moisture, and temperature distribution in the presence of straw mulch. Hydrology Research, 51(4): 720-738.
|
|
|
| [54] |
Zarei G, Homaee M, Liaghat A. 2009. Modeling transient evaporation from descending shallow groundwater table based on Brooks-Corey retention function. Water Resources Management, 23: 2867-2876.
|
|
|
| [55] |
Zhang C M, Li L, Lockington D. 2014. Numerical study of evaporation-induced salt accumulation and precipitation in bare saline soils: Mechanism and feedback. Water Resources Research, 50(10): 8084-8106.
|
|
|
| [56] |
Zhang J, Lai Y M, Zhang M Y, et al. 2024. Study on the coupling mechanism of water-heat-vapor-salt-mechanics in unsaturated freezing sulfate saline soil. Computers and Geotechnics, 169: 106232, doi: 10.1016/j.compgeo.2024.106232.
|
|
|
| [57] |
Zhang X D, Ye P, Wu Y J, et al. 2022. Experimental study on simultaneous heat-water-salt migration of bare soil subjected to evaporation. Journal of Hydrology, 609: 127710, doi: 10.1016/j.jhydrol.2022.127710.
|
|
|
| [58] |
Zhang X D, Shu C J, Fujii M, et al. 2023a. Numerical and experimental study on water-heat-salt transport patterns in shallow bare soil with varying salt contents under evaporative conditions: A comparative investigation. Journal of Hydrology, 621: 129564, doi: 10.1016/j.jhydrol.2023.129564.
|
|
|
| [59] |
Zhang X D, Shu C J, Wu Y J, et al. 2023b. Advances of coupled water-heat-salt theory and test techniques for soils in cold and arid regions: A review. Geoderma, 432: 116378, doi: 10.1016/j.geoderma.2023.116378.
|
|
|
| [60] |
Zhu X, Akae T. 2020. Maximum surface temperature model to evaluate evaporation from a saline soil in arid area. Paddy Water Environment, 10: 153-159.
|
|
|
|
Viewed |
|
|
|
Full text
|
|
|
|
|
Abstract
|
|
|
|
|
Cited |
|
|
|
|
| |
Shared |
|
|
|
|
| |
Discussed |
|
|
|
|