A hybrid data-driven model integrating hydro- meteorological factors for snowmelt flood early warning in an arid mountain basin
WANG Zerui1,2, LI Xiaoyang1,2, LIU Yongqiang1,2,*(), WANG Weiping1,2, LI Yaqian1,2, ZHANG Yuanwei1,2
1College of Geography and Remote Sensing Sciences, Xinjiang University, Urumqi 830017, China 2Xinjiang Key Laboratory of Oasis Ecology, Xinjiang University, Urumqi 830017, China
High false alarm rates (FARs) in snowmelt flood forecasting persist, largely due to an insufficient understanding of the coupled effects of multi-source hydro-meteorological drivers and their inherent time lags. This study addressed this gap by developing a hybrid snowmelt-flood forecasting framework that combined multiple linear regression (MLR) and backpropagation neural network (BPNN) models, with a simulated annealing (SA) algorithm employed to optimize the ensemble weighting. The developed hybrid model that incorporated daily hydro-meteorological inputs and temporal factor was validated using data from 1978 to 2011 for the Hutubi River Basin, an arid inland basin on the northern slope of the Tianshan Mountains, China. The findings demonstrated that the hybrid model achieved a specificity of 0.8549, significantly outperforming standalone MLR (0.6024) and BPNN (0.6436) models. Correspondingly, the FAR was reduced to 0.1451, which was substantially lower than that of MLR (0.3976) and BPNN (0.3564). Upon integrating temporal factor, the FAR was further reduced to 0.0959, markedly enhancing overall predictive robustness. Collectively, this study offers a robust methodological framework for optimizing snowmelt flood forecasting by effectively integrating multi-source data and temporal dependencies.
Received: 14 October 2025
Published: 31 August 2026
Conceptualization: WANG Zerui, LI Yaqian; Investigation: WANG Zerui, LI Xiaoyang, ZHANG Yuanwei; Data curation: WANG Zerui, ZHANG Yuanwei; Software: WANG Zerui, LI Xiaoyang; Writing - original draft preparation: WANG Zerui; Writing - review and editing: WANG Zerui, LIU Yongqiang, WANG Weiping; Funding acquisition: LIU Yongqiang, WANG Weiping; Resources: LIU Yongqiang, WANG Weiping; Supervision: LIU Yongqiang, WANG Weiping; Validation: LI Yaqian, ZHANG Yuanwei; Project administration: LIU Yongqiang; Visualization: WANG Zerui, LI Xiaoyang. All authors approved the manuscript.
WANG Zerui, LI Xiaoyang, LIU Yongqiang, WANG Weiping, LI Yaqian, ZHANG Yuanwei. A hybrid data-driven model integrating hydro- meteorological factors for snowmelt flood early warning in an arid mountain basin. Journal of Arid Land, 2026, 18(8): 1331-1353.
Fig. 1Overview of the Hutubi River Basin based on the elevation data and distribution of its drainage network
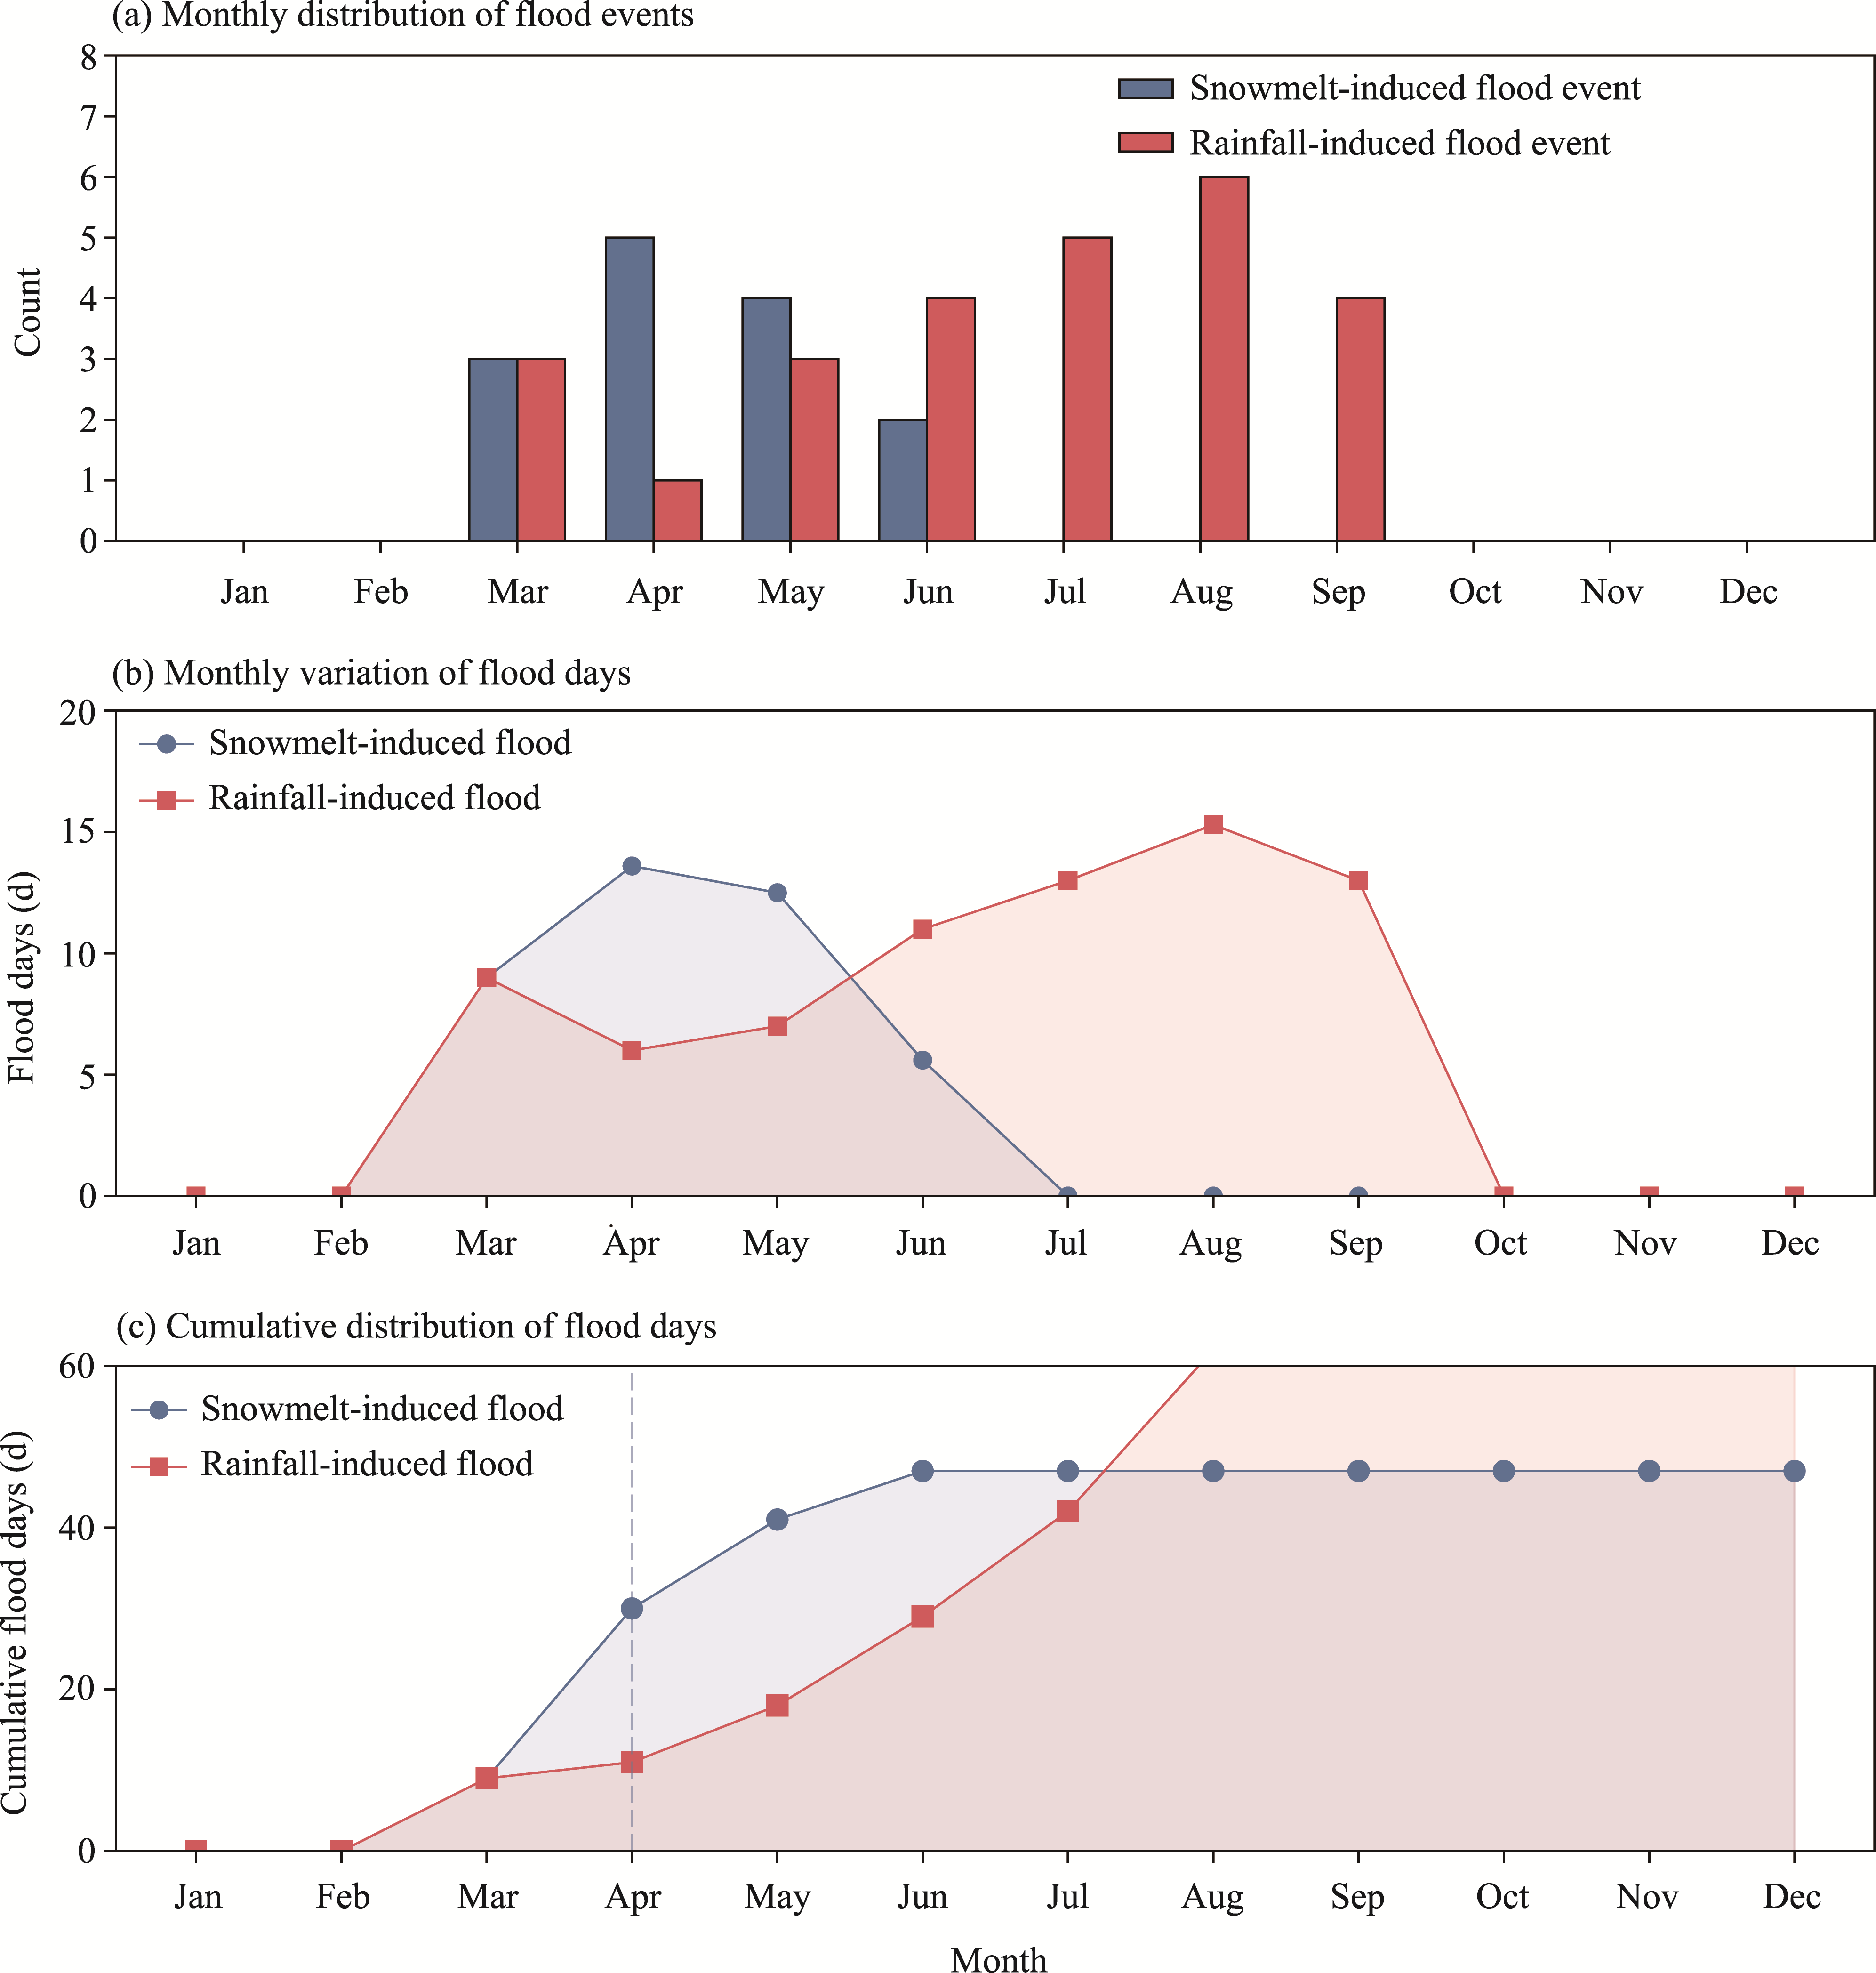
Fig. 2Monthly distribution and cumulative characteristics of snowmelt-induced and rainfall-induced floods. (a), monthly distribution of flood events; (b), monthly variation of flood days; (c), cumulative distribution of flood days.
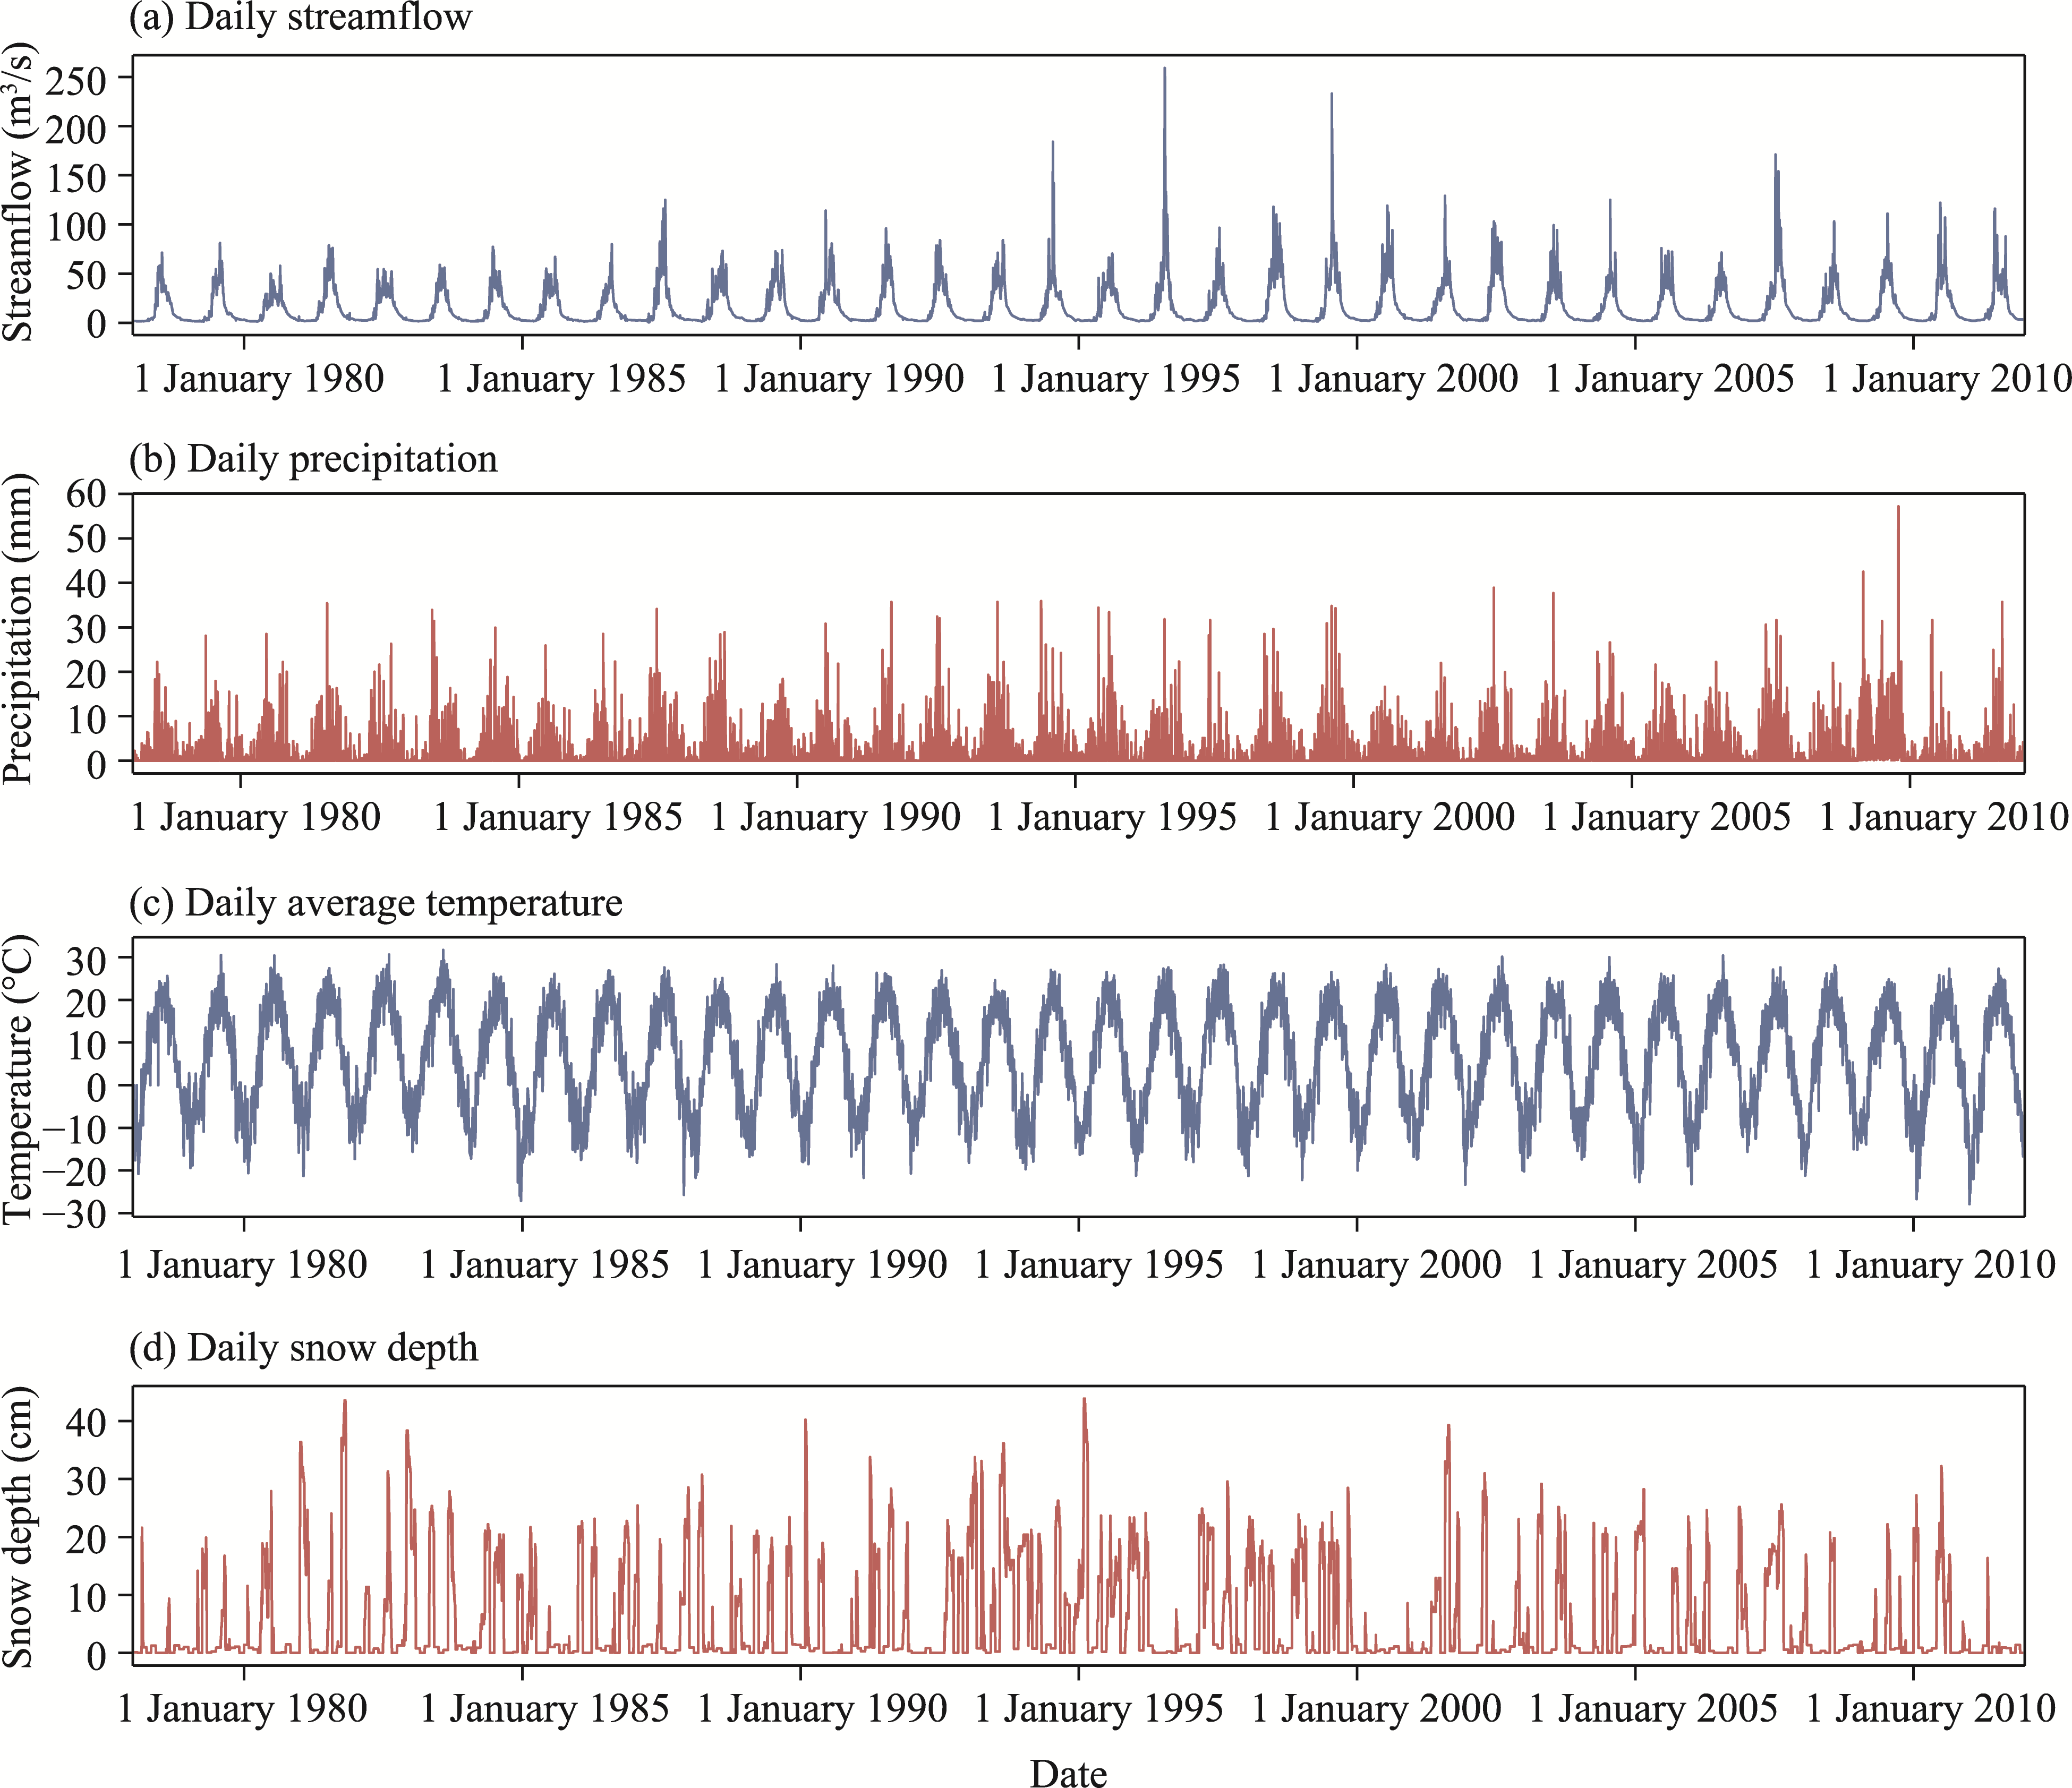
Fig. 3Temporal variations in daily streamflow (a), precipitation (b), average temperature (c), and snow depth (d) in the Hutubi River Basin from 1978 to 2011
Element
Maximum
Minimum
Median
Mean
Standard deviation
Streamflow (m3/s)
259.000
0.530
5.550
15.252
19.533
Precipitation (mm)
57.200
0.000
9.604
1.218
3.526
Average temperature (°C)
31.700
-27.900
7.700
6.232
12.177
Snow depth (cm)
45.665
0.000
0.679
4.581
8.024
Table 1 Statistical characteristics of daily hydro-meteorological elements during 1978-2011
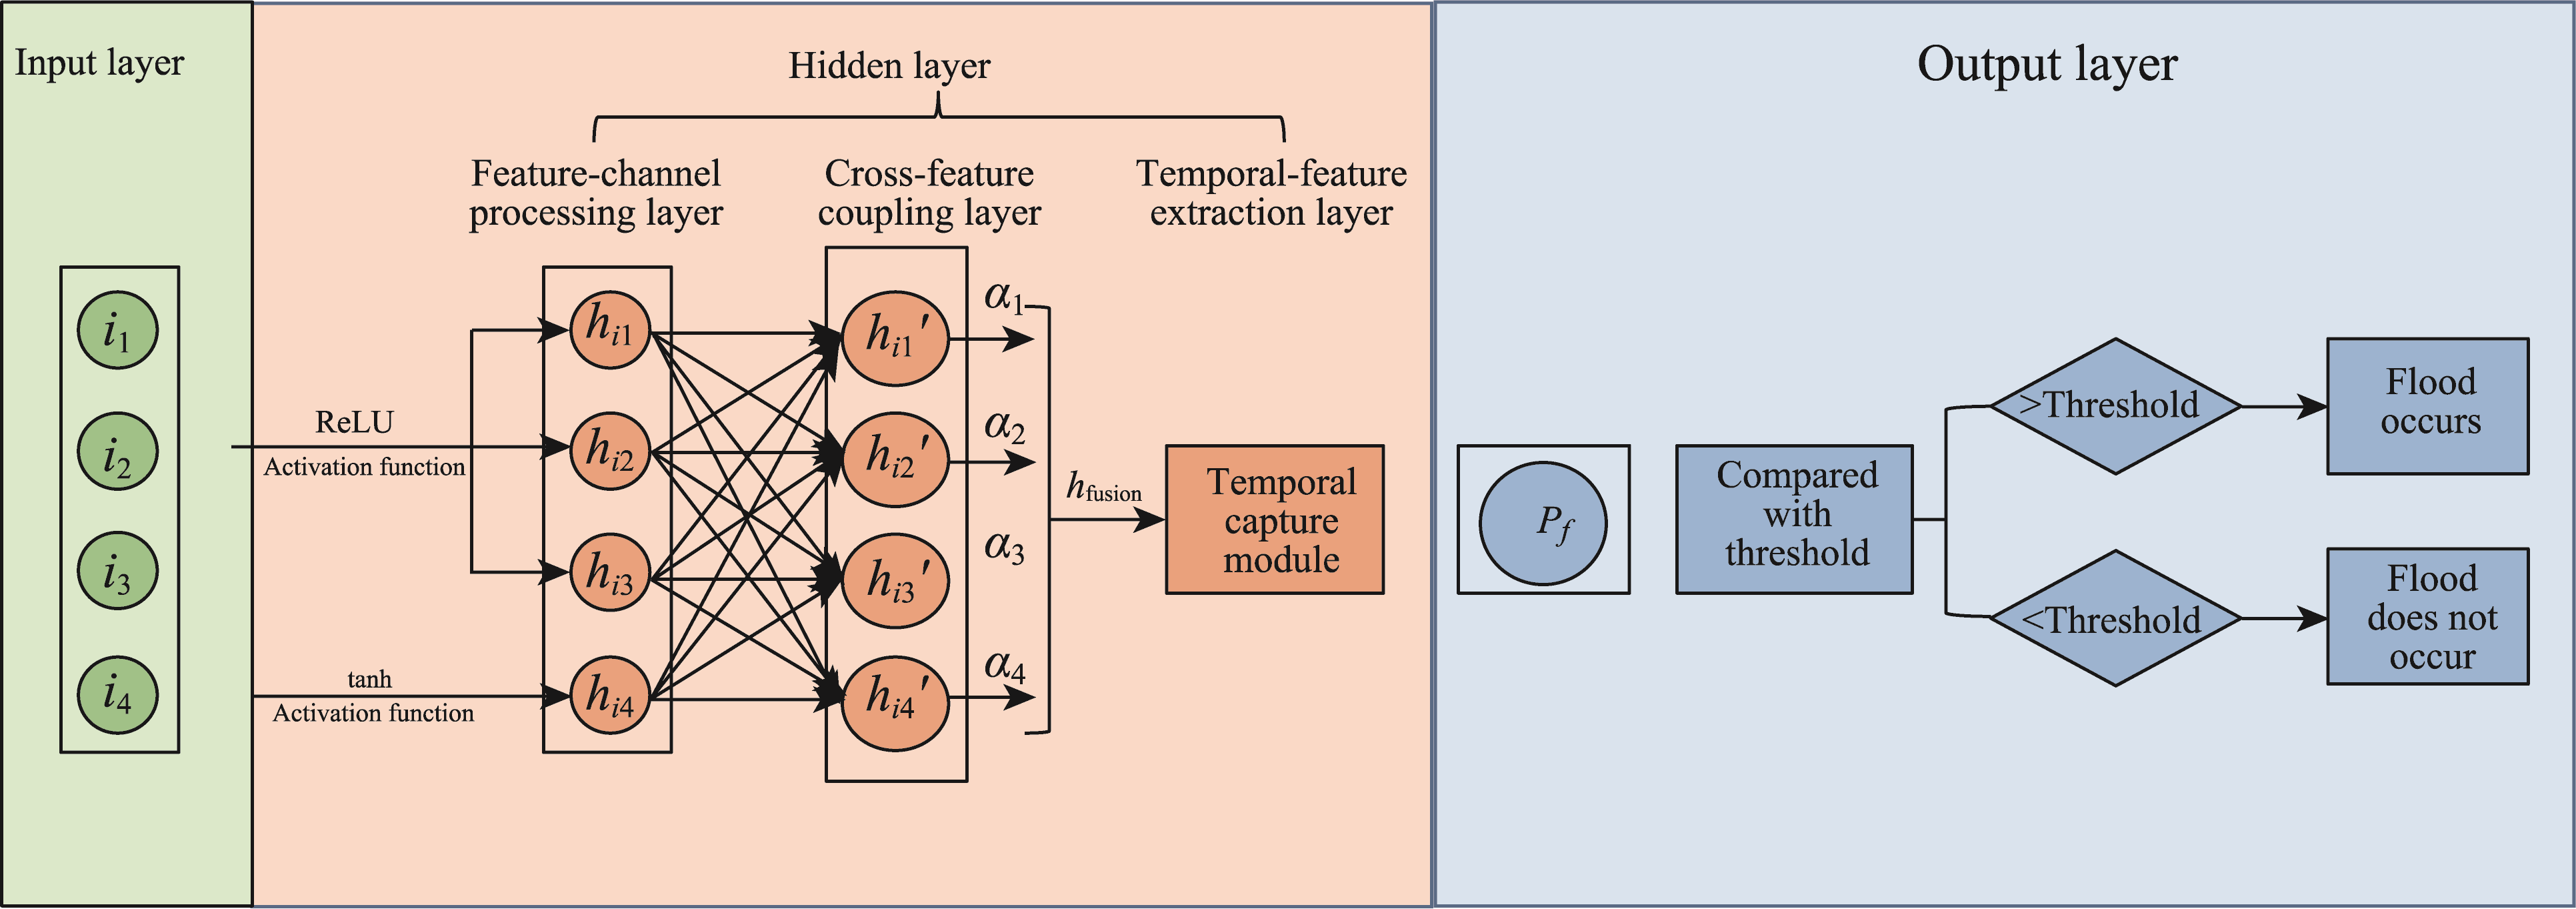
Fig. 4Architecture of the backpropagation neural network (BPNN)-based snowmelt flood forecasting model. i1-i4 indicate the input features (indicating normalized daily streamflow, daily precipitation, average temperature difference, and snow depth change, respectively); hi1-hi4 indicate the hidden layer features; hi1′-hi4′ indicate the cross-feature coupled hidden features; α1-α4 indicate the temporally extracted features; hfusion indicates the fused feature vector; ReLU, Rectified Linear Unit; tanh, hyperbolic tangent; Pf, predicted probability of snowmelt flood occurrence.
Predictor
t-statistic
Significance
Coefficient
Daily streamflow
13.336
0.0001
0.147
Daily precipitation
8.124
0.0001
0.089
Average temperature difference
-1.947
0.0520
-0.021
Snow depth change
3.073
0.0020
0.033
Table 2 Standardized coefficients of hydro-meteorological predictors
Fig. 5Distribution characteristics of normalized hydro-meteorological predictors and pairwise interactive relationships of each predictor with other three predictors. (a1-a4), i1; (b1-b4), i2; (c1-c4), i3; (d1-d4), i4. Histograms with kernel density estimation (KDE) curves illustrate the data distribution of each predictor. Scatter plots display the actual normalized observations between predictors, with red Locally Weighted Scatterplot Smoothing (LOWESS) curves indicating the non-linear trend of these data points. ρ indicates the Spearman's rank correlation coefficient, which quantifies the strength and direction of the monotonic relationship between two predictors; values range from -1.00 to 1.00, where a value closer to -1.00 or 1.00 indicates a stronger negative or positive correlation, respectively.
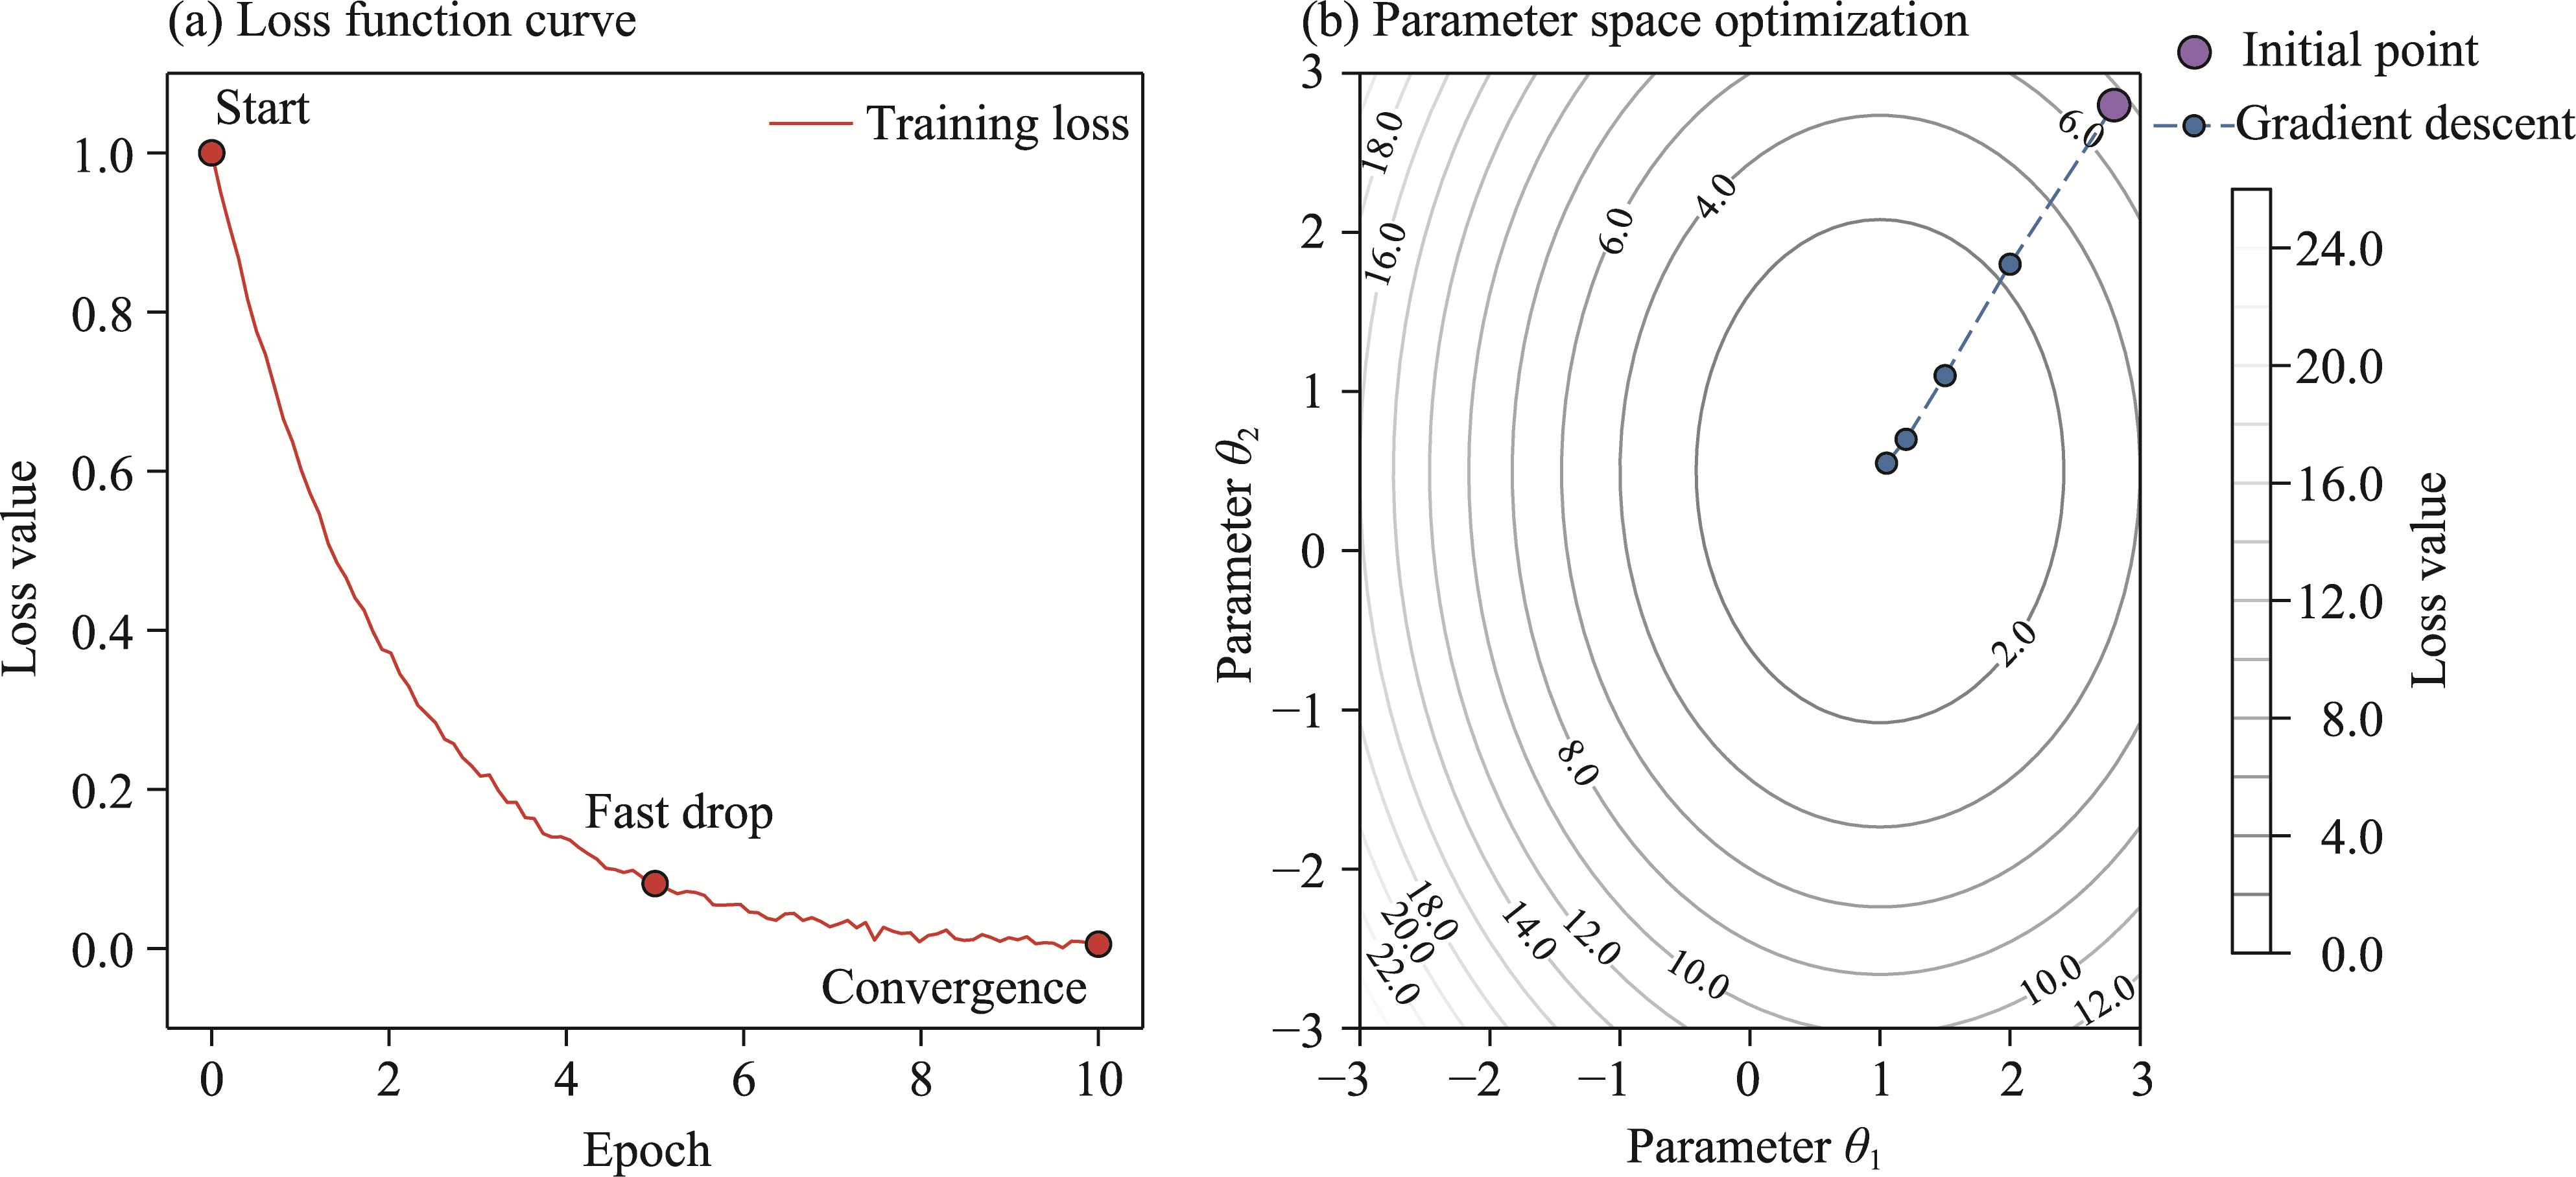
Fig. 6Training performance and optimization trajectory. (a), loss function decay curve demonstrating model convergence efficiency; (b), contour plot of the parameter space optimization, showing the gradient descent path relative to the loss intensity distribution. The blue curve traces the iterative updates of the model parameters from their initial state, clearly showing the path toward the optimal solution. The background contours represent the loss function landscape for different parameter combinations.
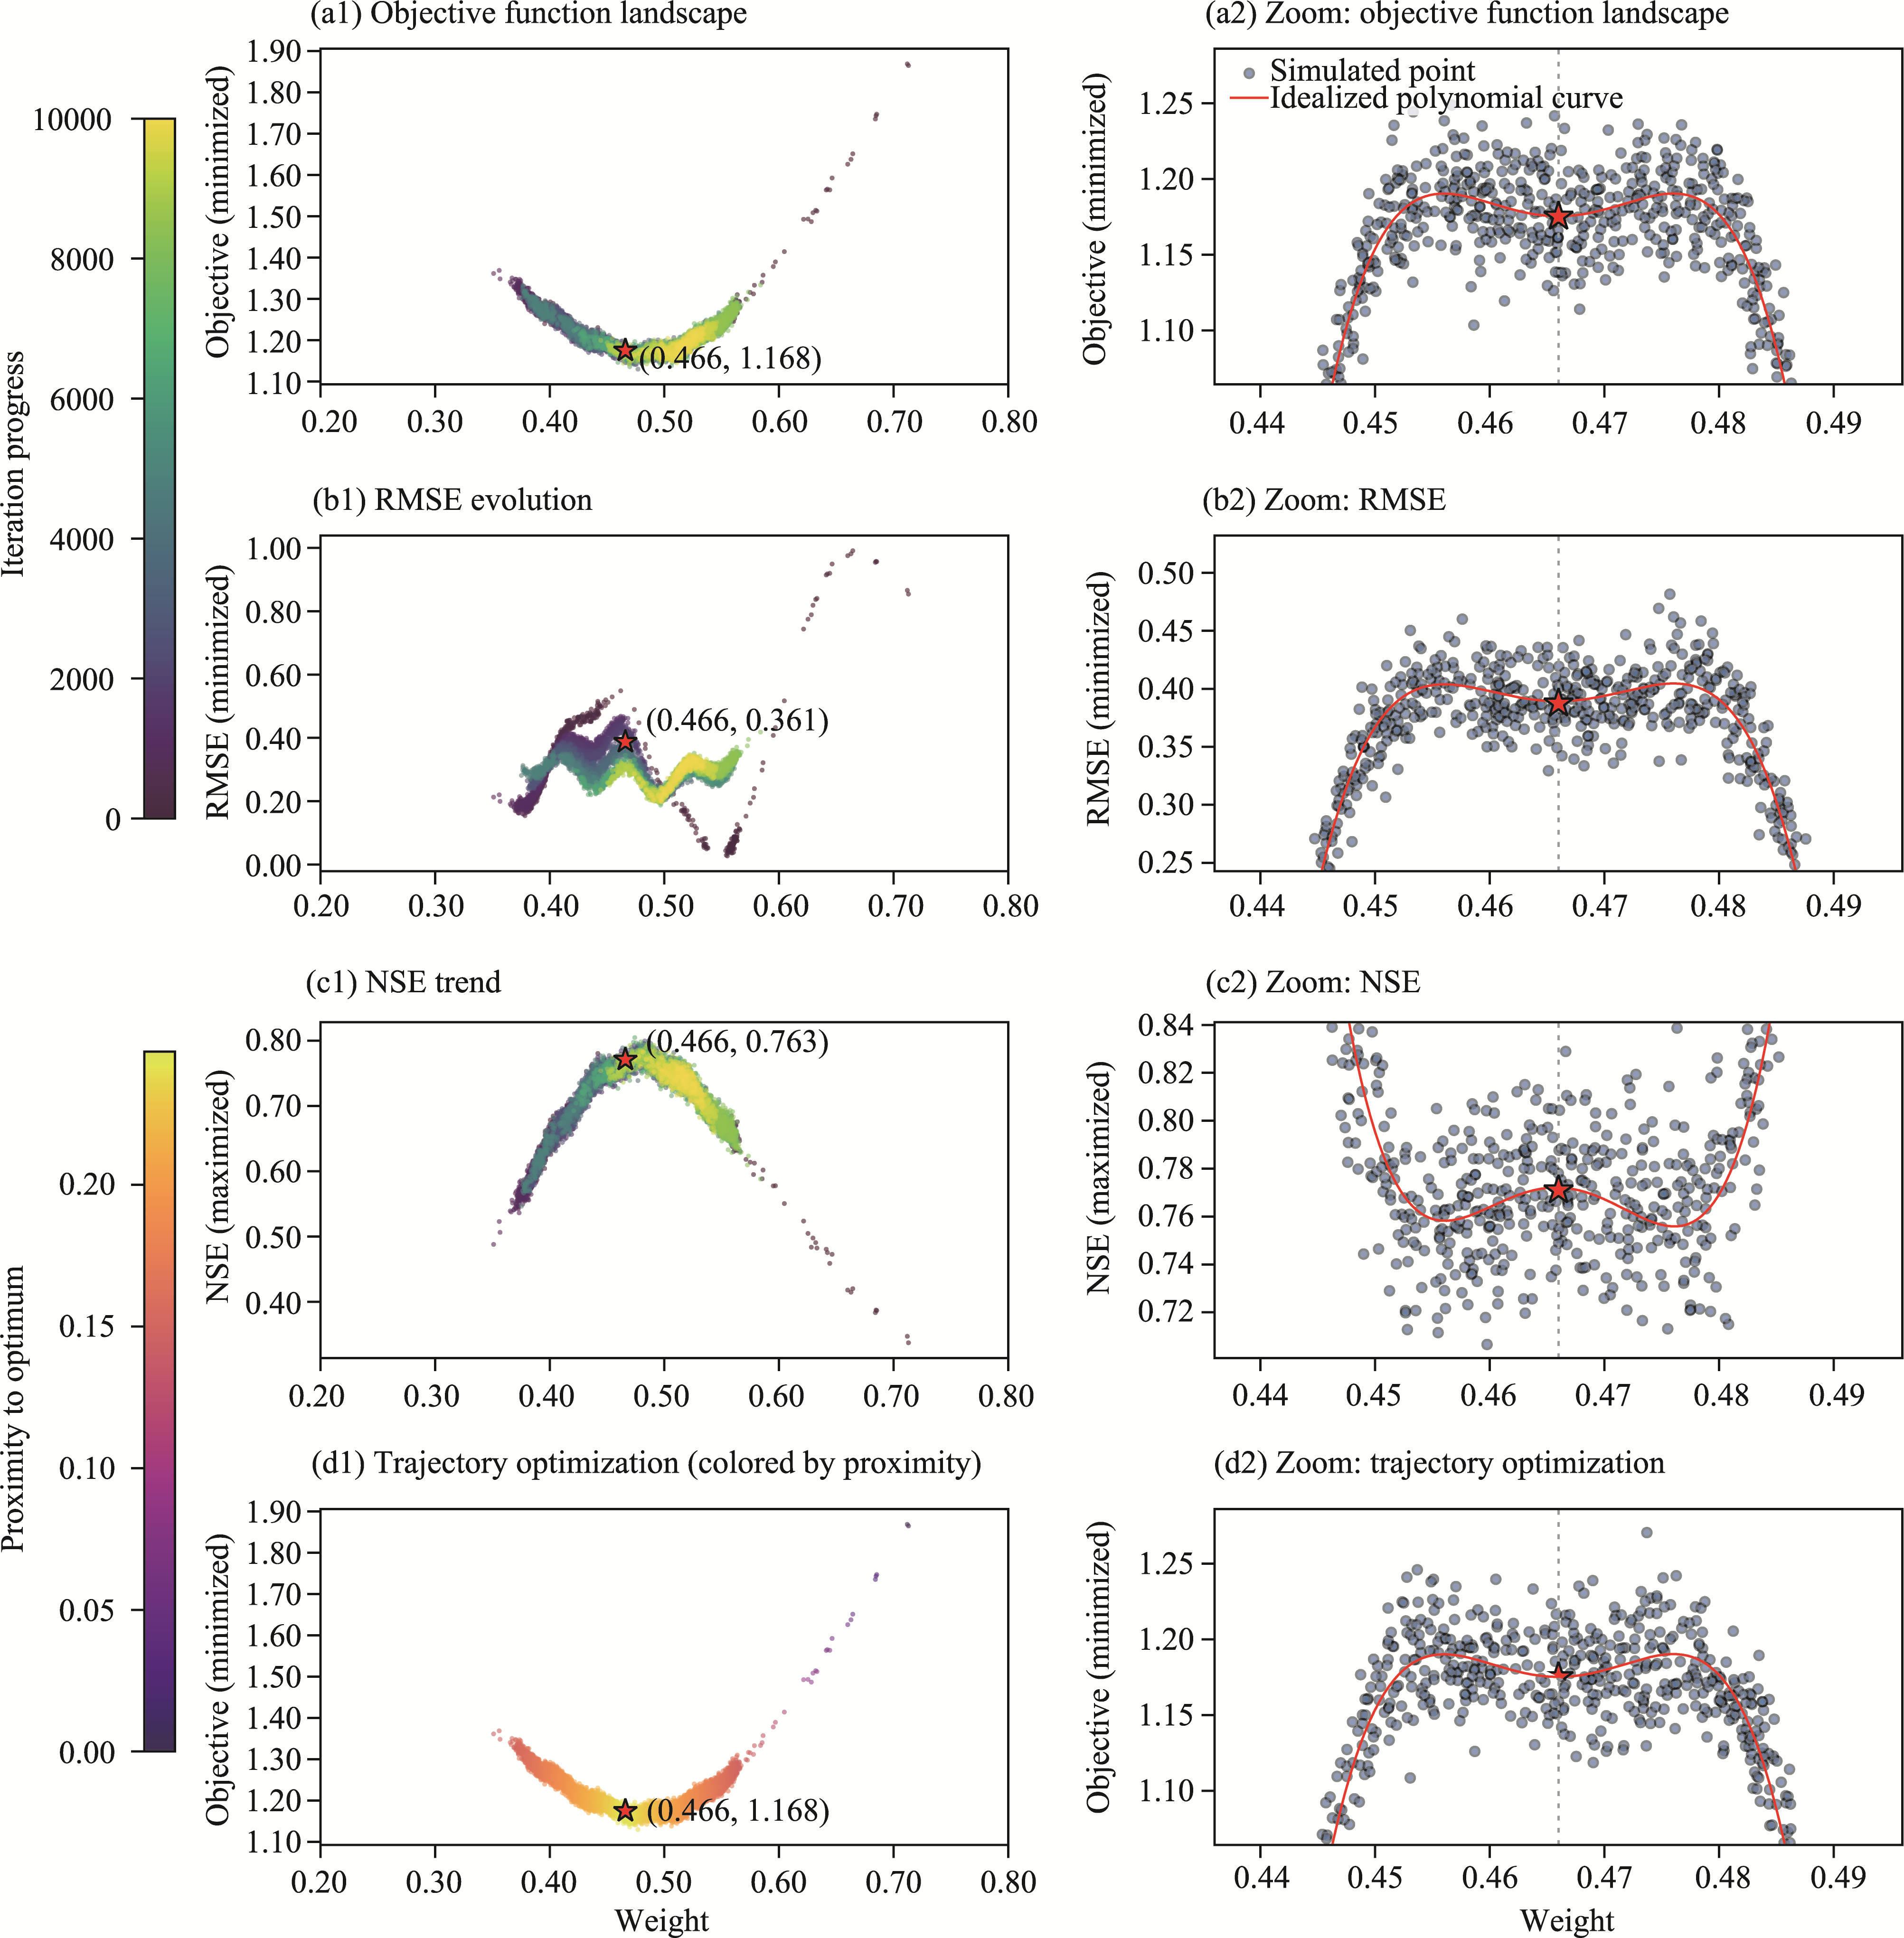
Fig. 7Optimization landscape and convergence analysis of the optimal weight for the multiple linear regression (MLR) model. (a1-d1), global distribution of the objective function landscape, RMSE, NSE, and trajectory optimization; (a2-d2), localized zoom-in views with fitted trend lines. Objective function landscape indicates the multi-objective cost function evaluated for model convergence (minimization objective); RMSE is the Root Mean Square Error, quantifying the deviation between observations and simulations (minimization objective); NSE is the Nash-Sutcliffe Efficiency, denoting hydrological predictive performance (maximization objective, optimal at 1.0); trajectory optimization denotes the iterative search path of model weights during optimization. The red star denotes the global optimum at the optimal weight of 0.466, consistently identified by all performance metrics. The red solid line denotes the polynomial regression trend-fit, representing the stochastic iteration trajectory. The large value of proximity to the global optimum indicates higher convergence density.
Model
Overall accuracy
Specificity
FAR
MLR
0.6260
0.6024
0.3976
BPNN
0.6671
0.6436
0.3564
Hybrid model
0.8658
0.8549
0.1451
Table 3 Comparative performance evaluation of the predictive model and its sub-models
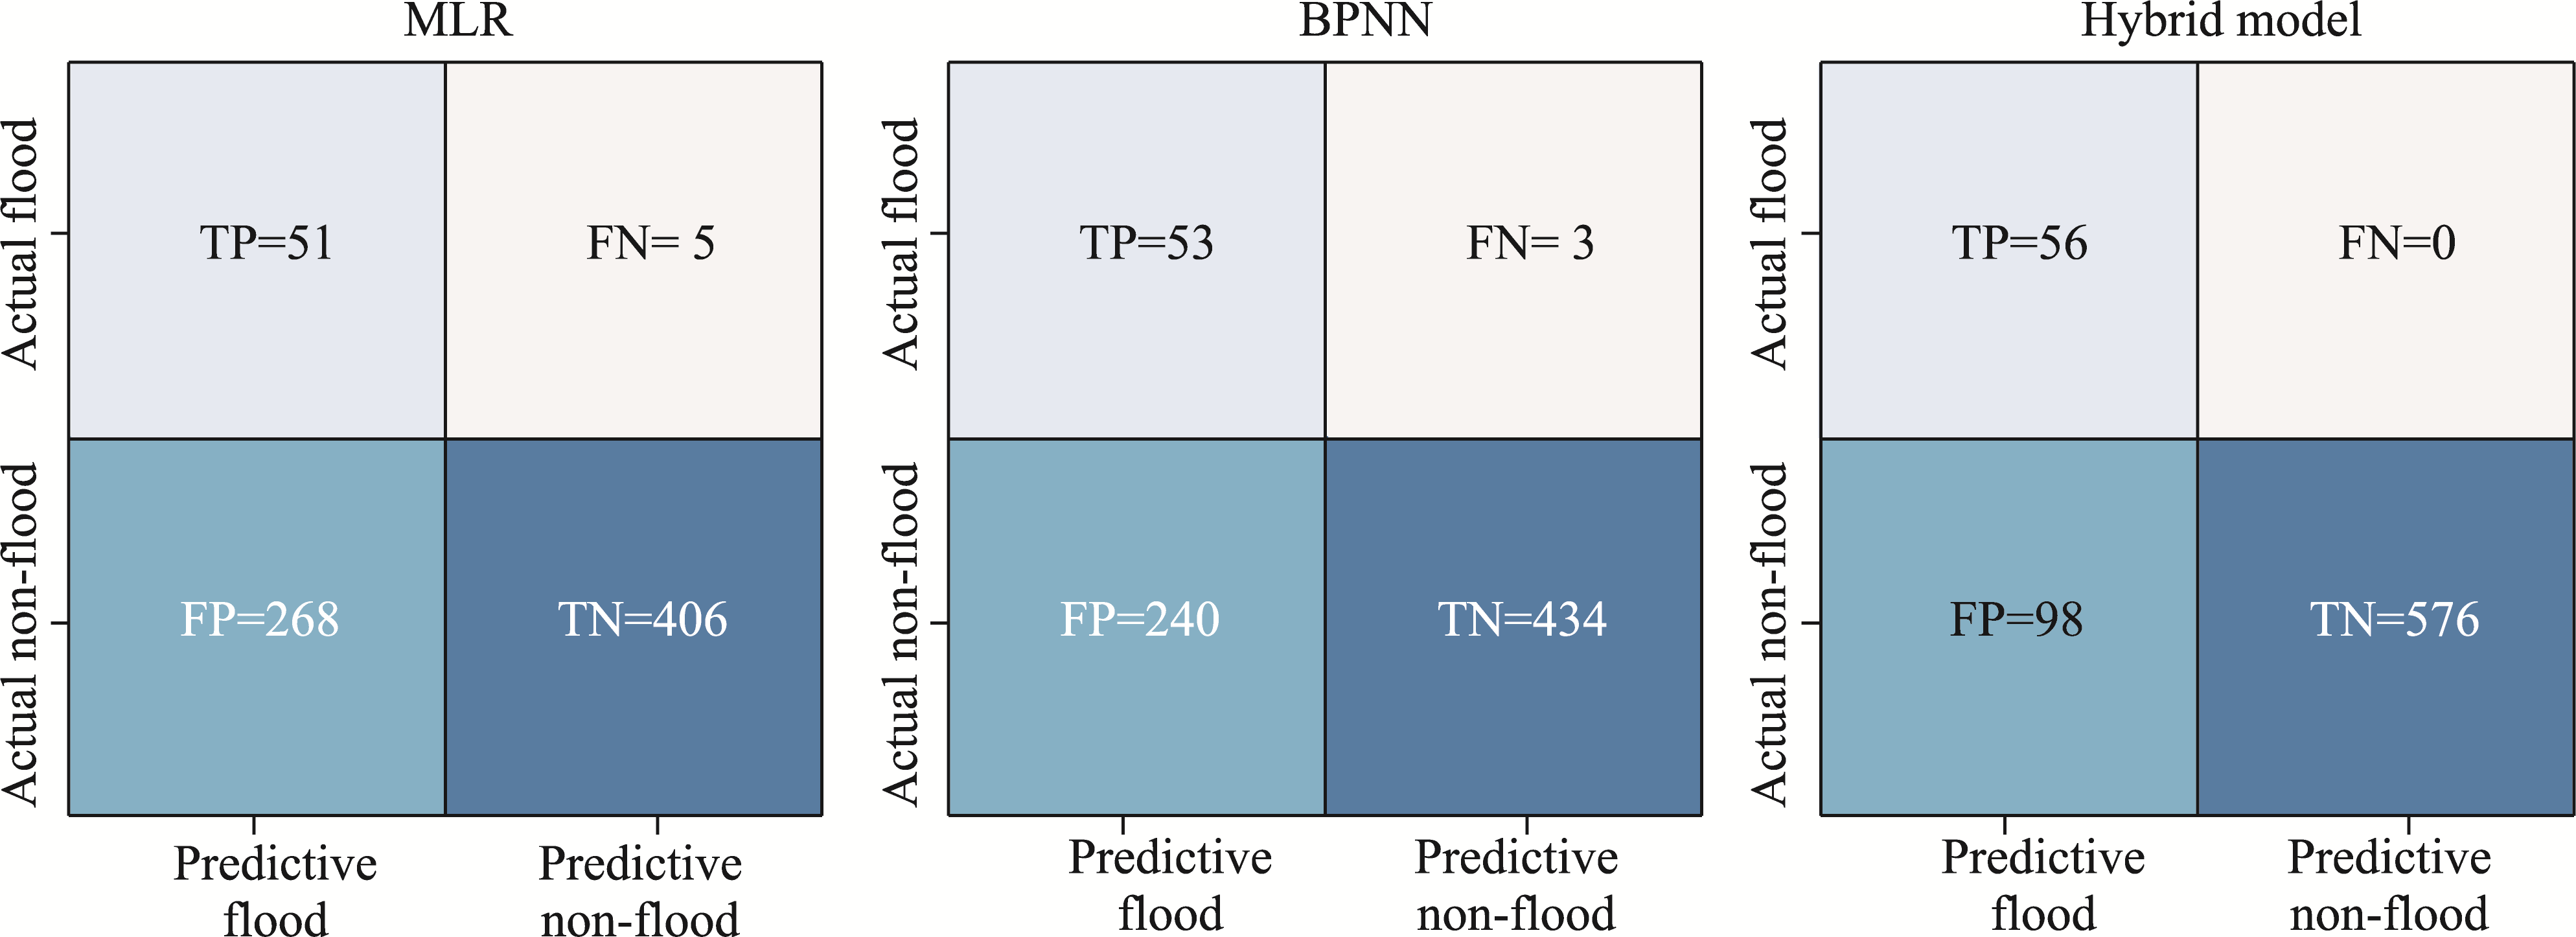
Fig. 8Confusion matrices of MLR, BPNN, and hybrid models for snowmelt flood classification during 2009-2011. TP, true positive; FP, false positive; FN, false negative; TN, true negative.
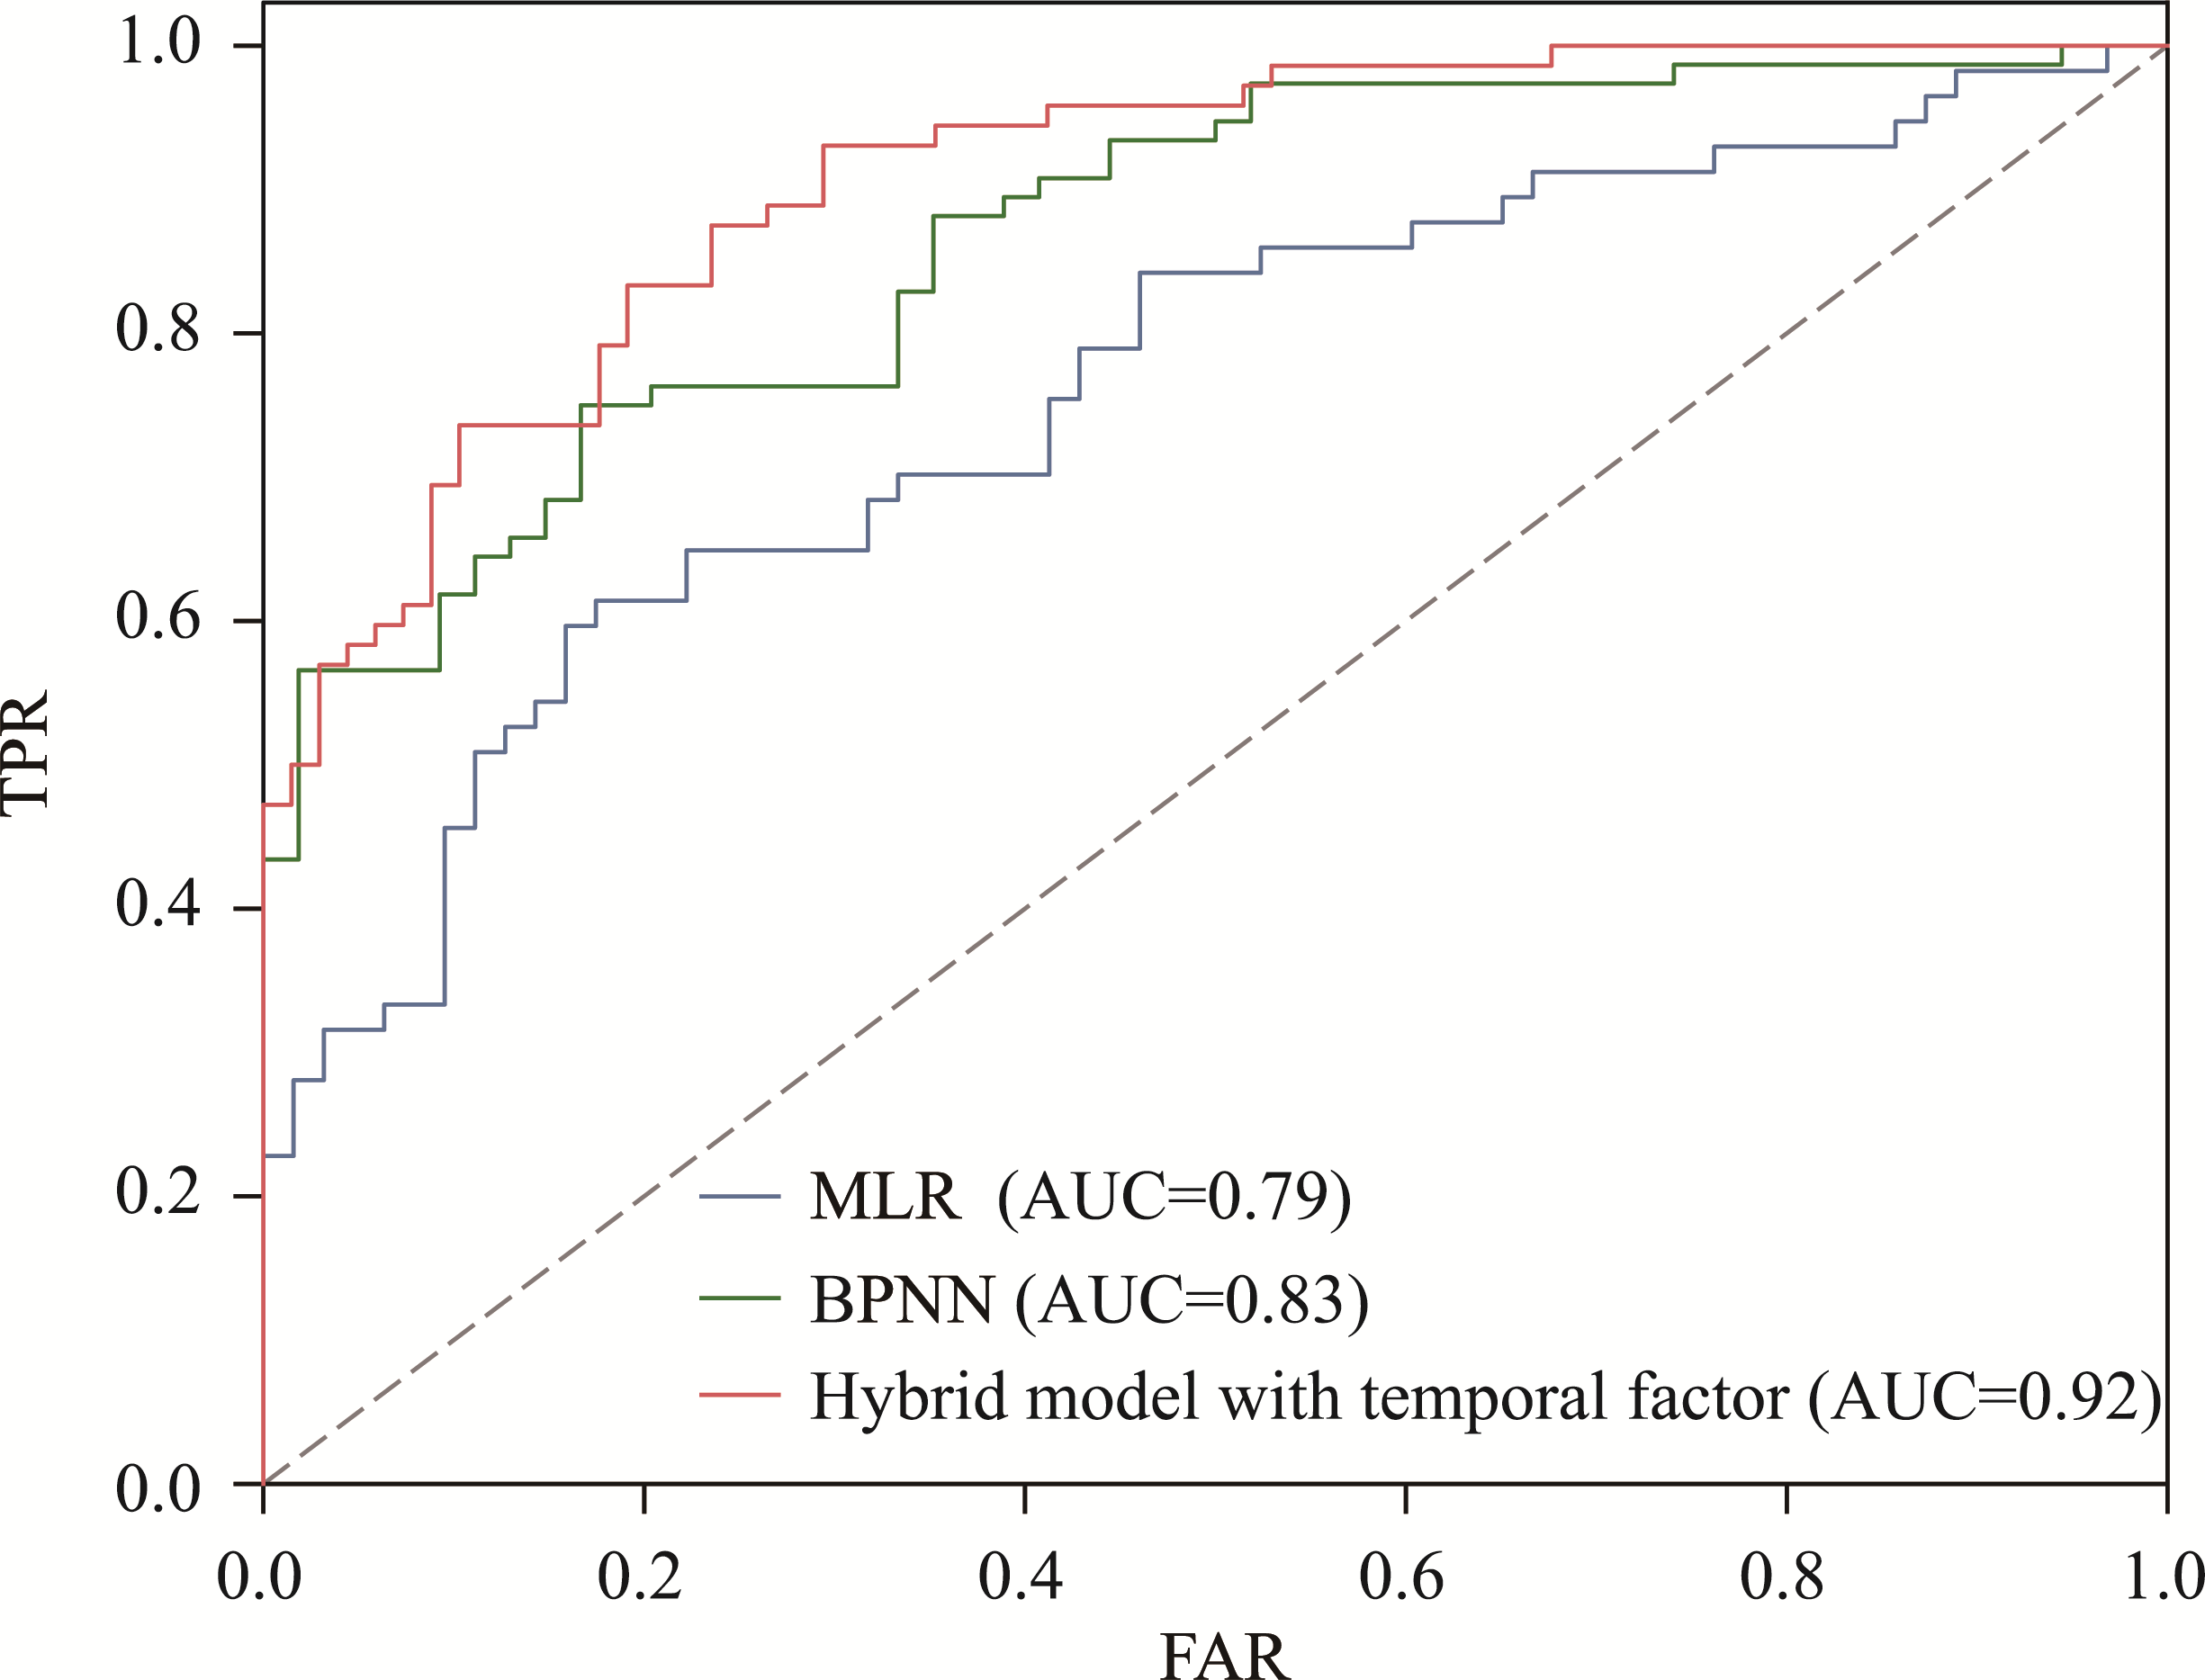
Fig. 9Comparative analysis of area under the Receiver Operating Characteristic (ROC) curve (AUC) values among MLR, BPNN, and hybrid models. TPR, true positive rate.
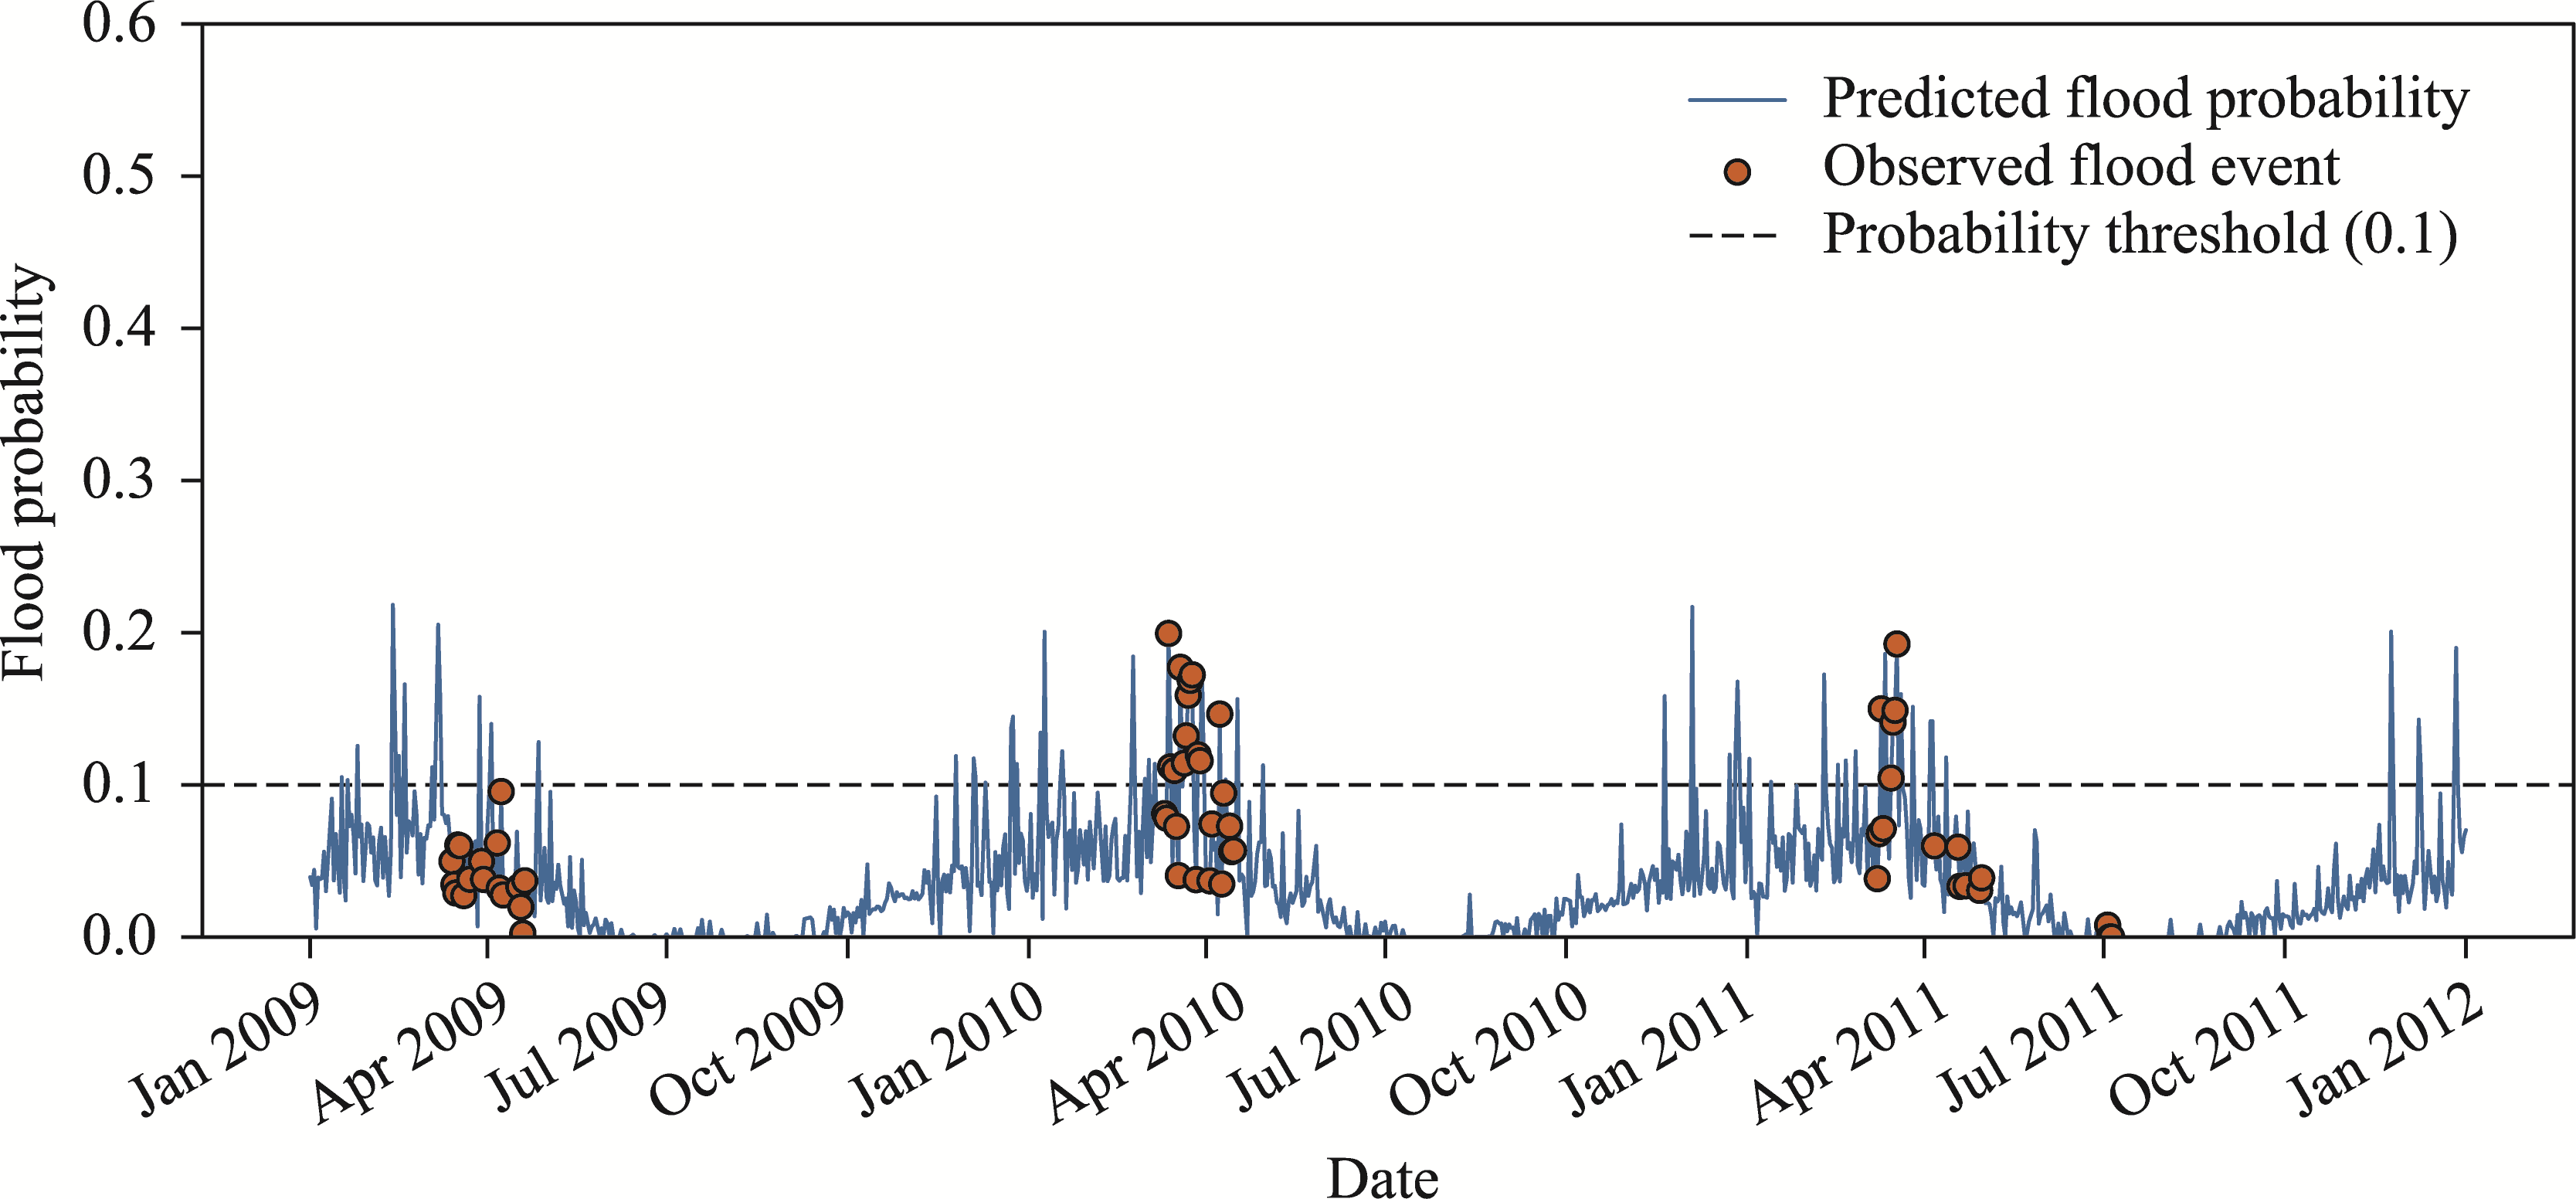
Fig. 10Comparison between predicted flood probability (without temporal factor) and observed flood events in the Hutubi River Basin during 2009-2011. A red marker positioned above the probability threshold line signifies a successful prediction (a true positive), whereas a marker below it indicates a missed event (a false negative).
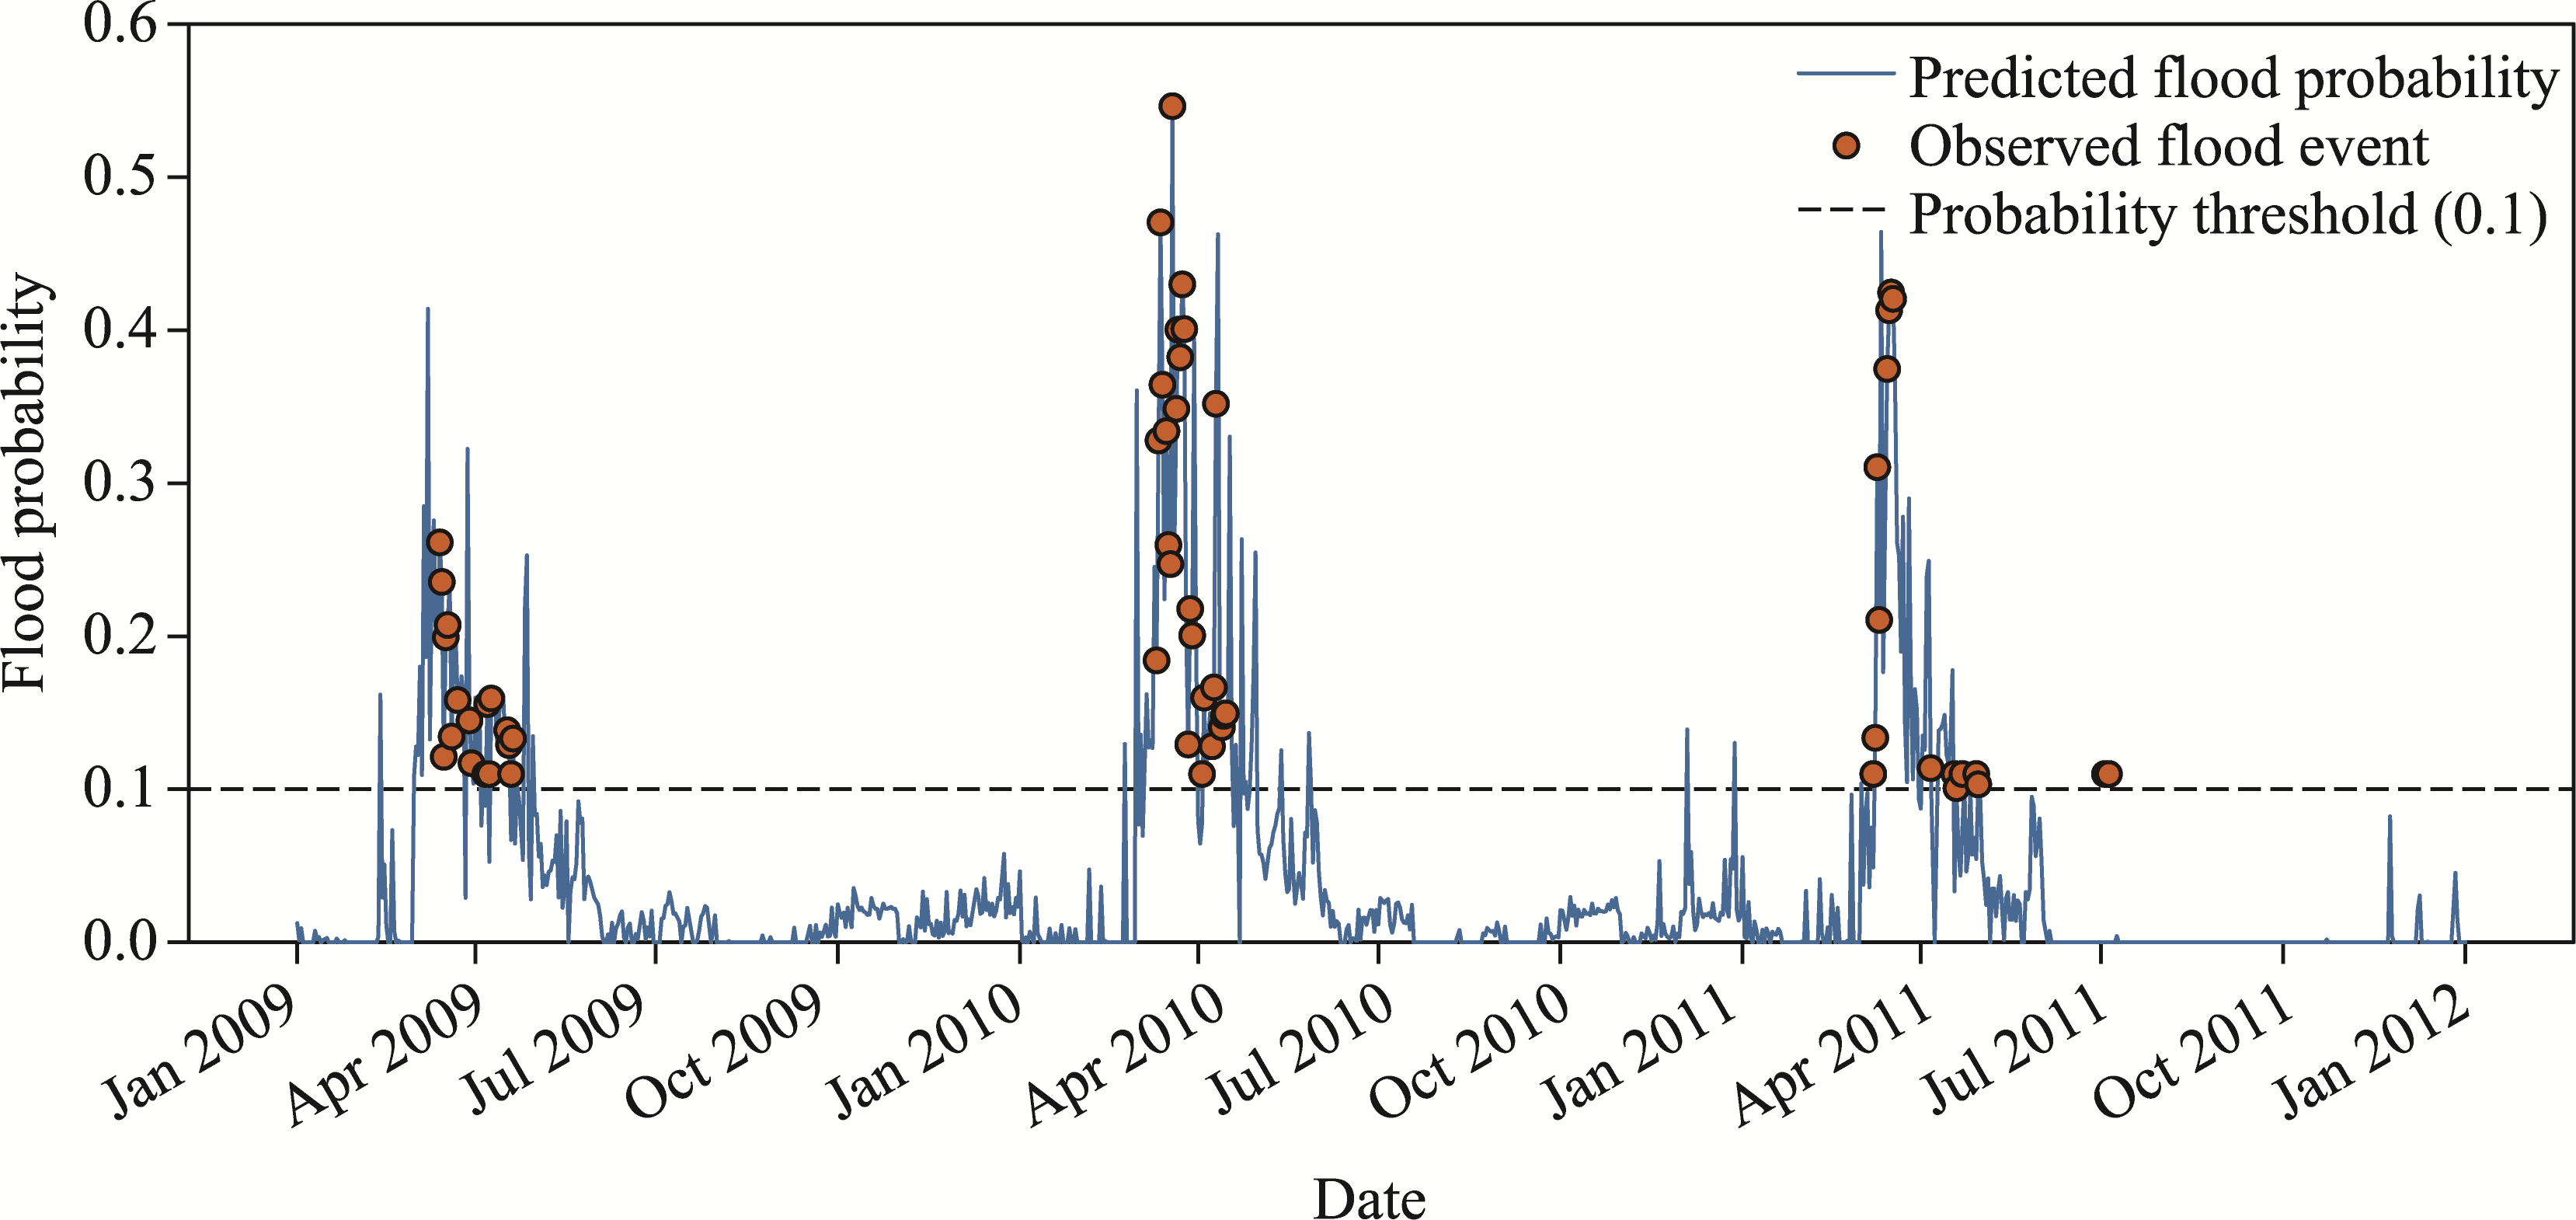
Fig. 11Comparison between predicted daily flood probability (with temporal factor) and observed flood events in the Hutubi River Basin (2009-2011). A red marker positioned above the probability threshold line signifies a successful prediction (a true positive), whereas a marker below it indicates a missed event (a false negative).
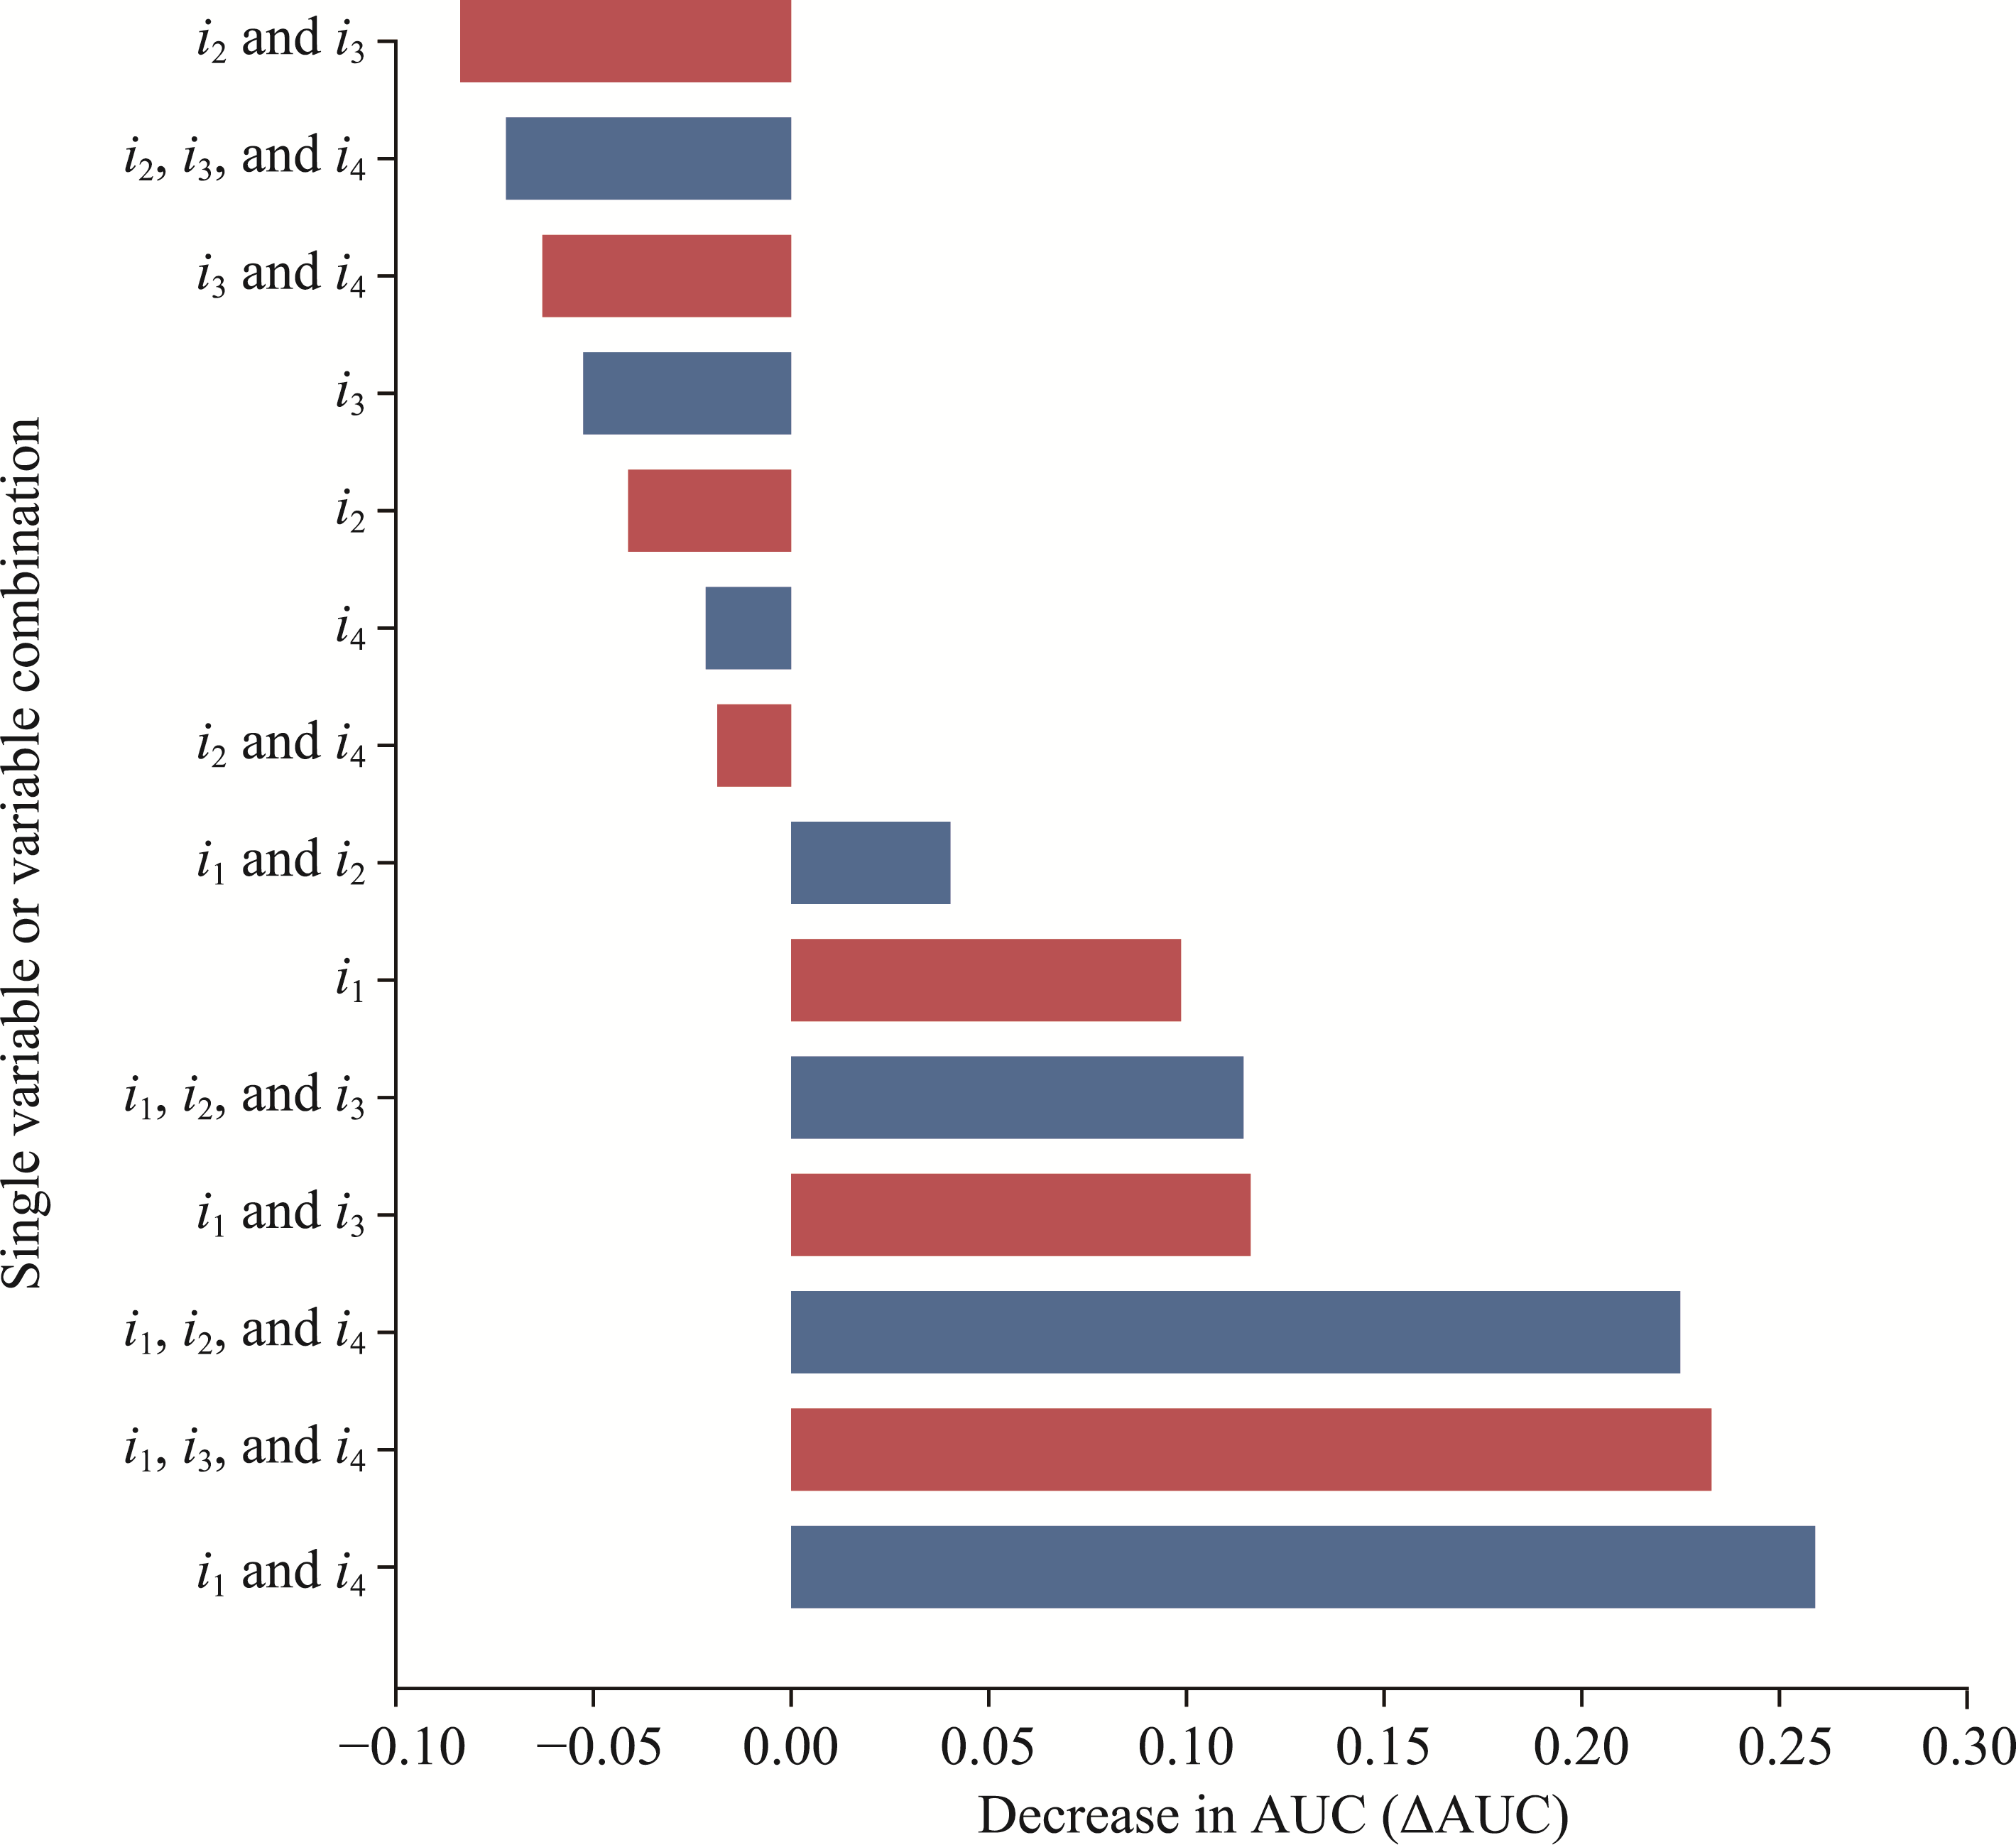
Fig. 12Sensitivity analysis of hydro-meteorological variables in the hybrid model by removing single variables or combinations of variables.
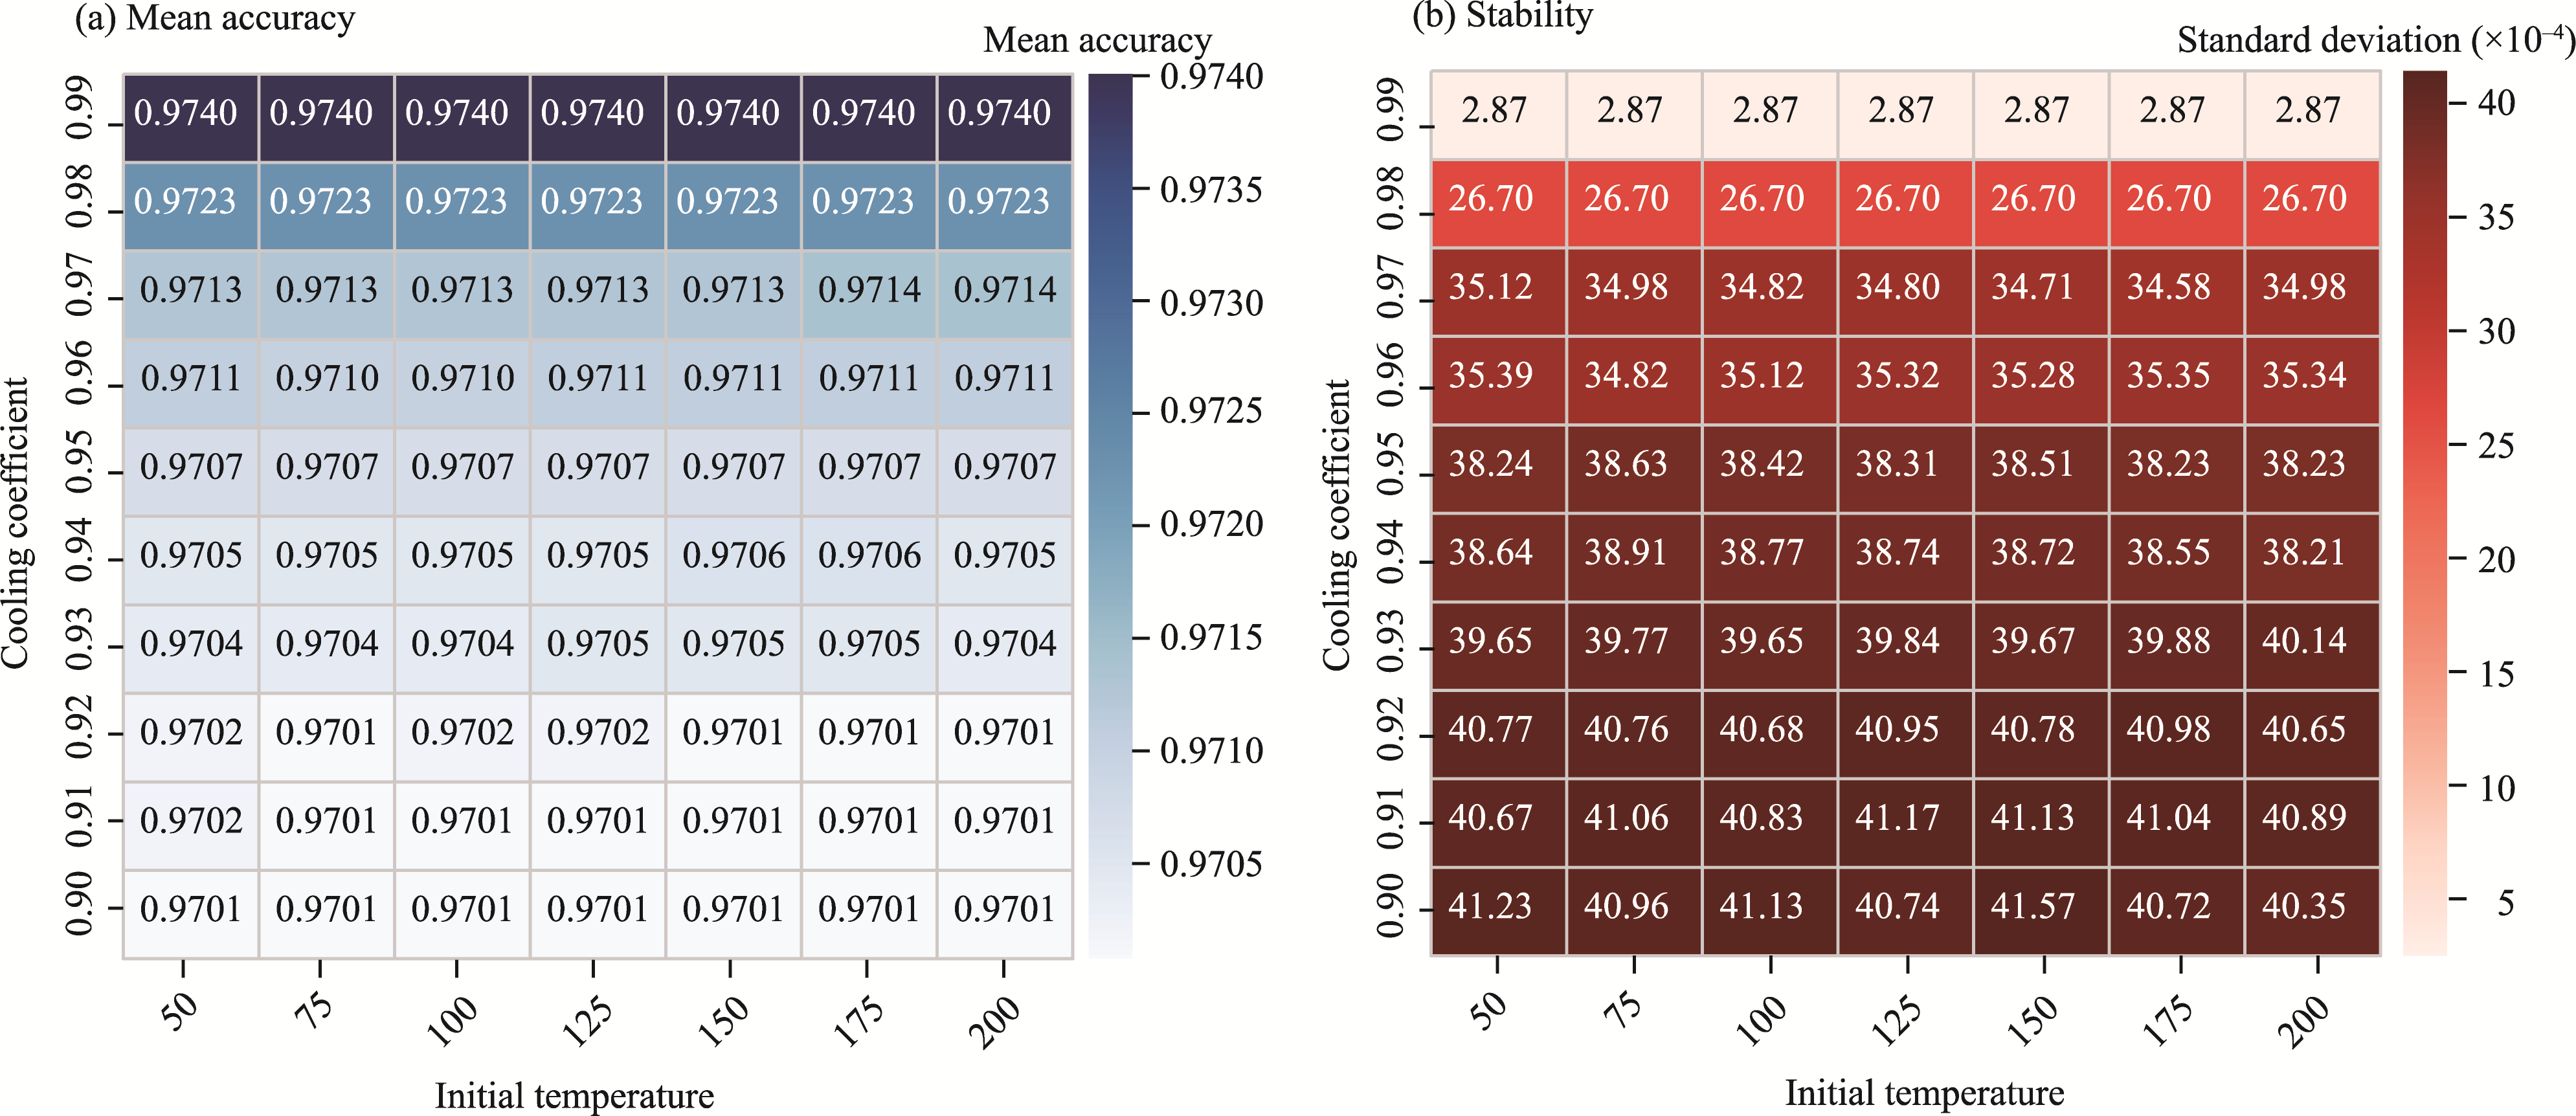
Fig. 14Sensitivity analysis of SA algorithm hyperparameters. (a), mean accuracy; (b), stability (indicated by the standard deviation of accuracy).
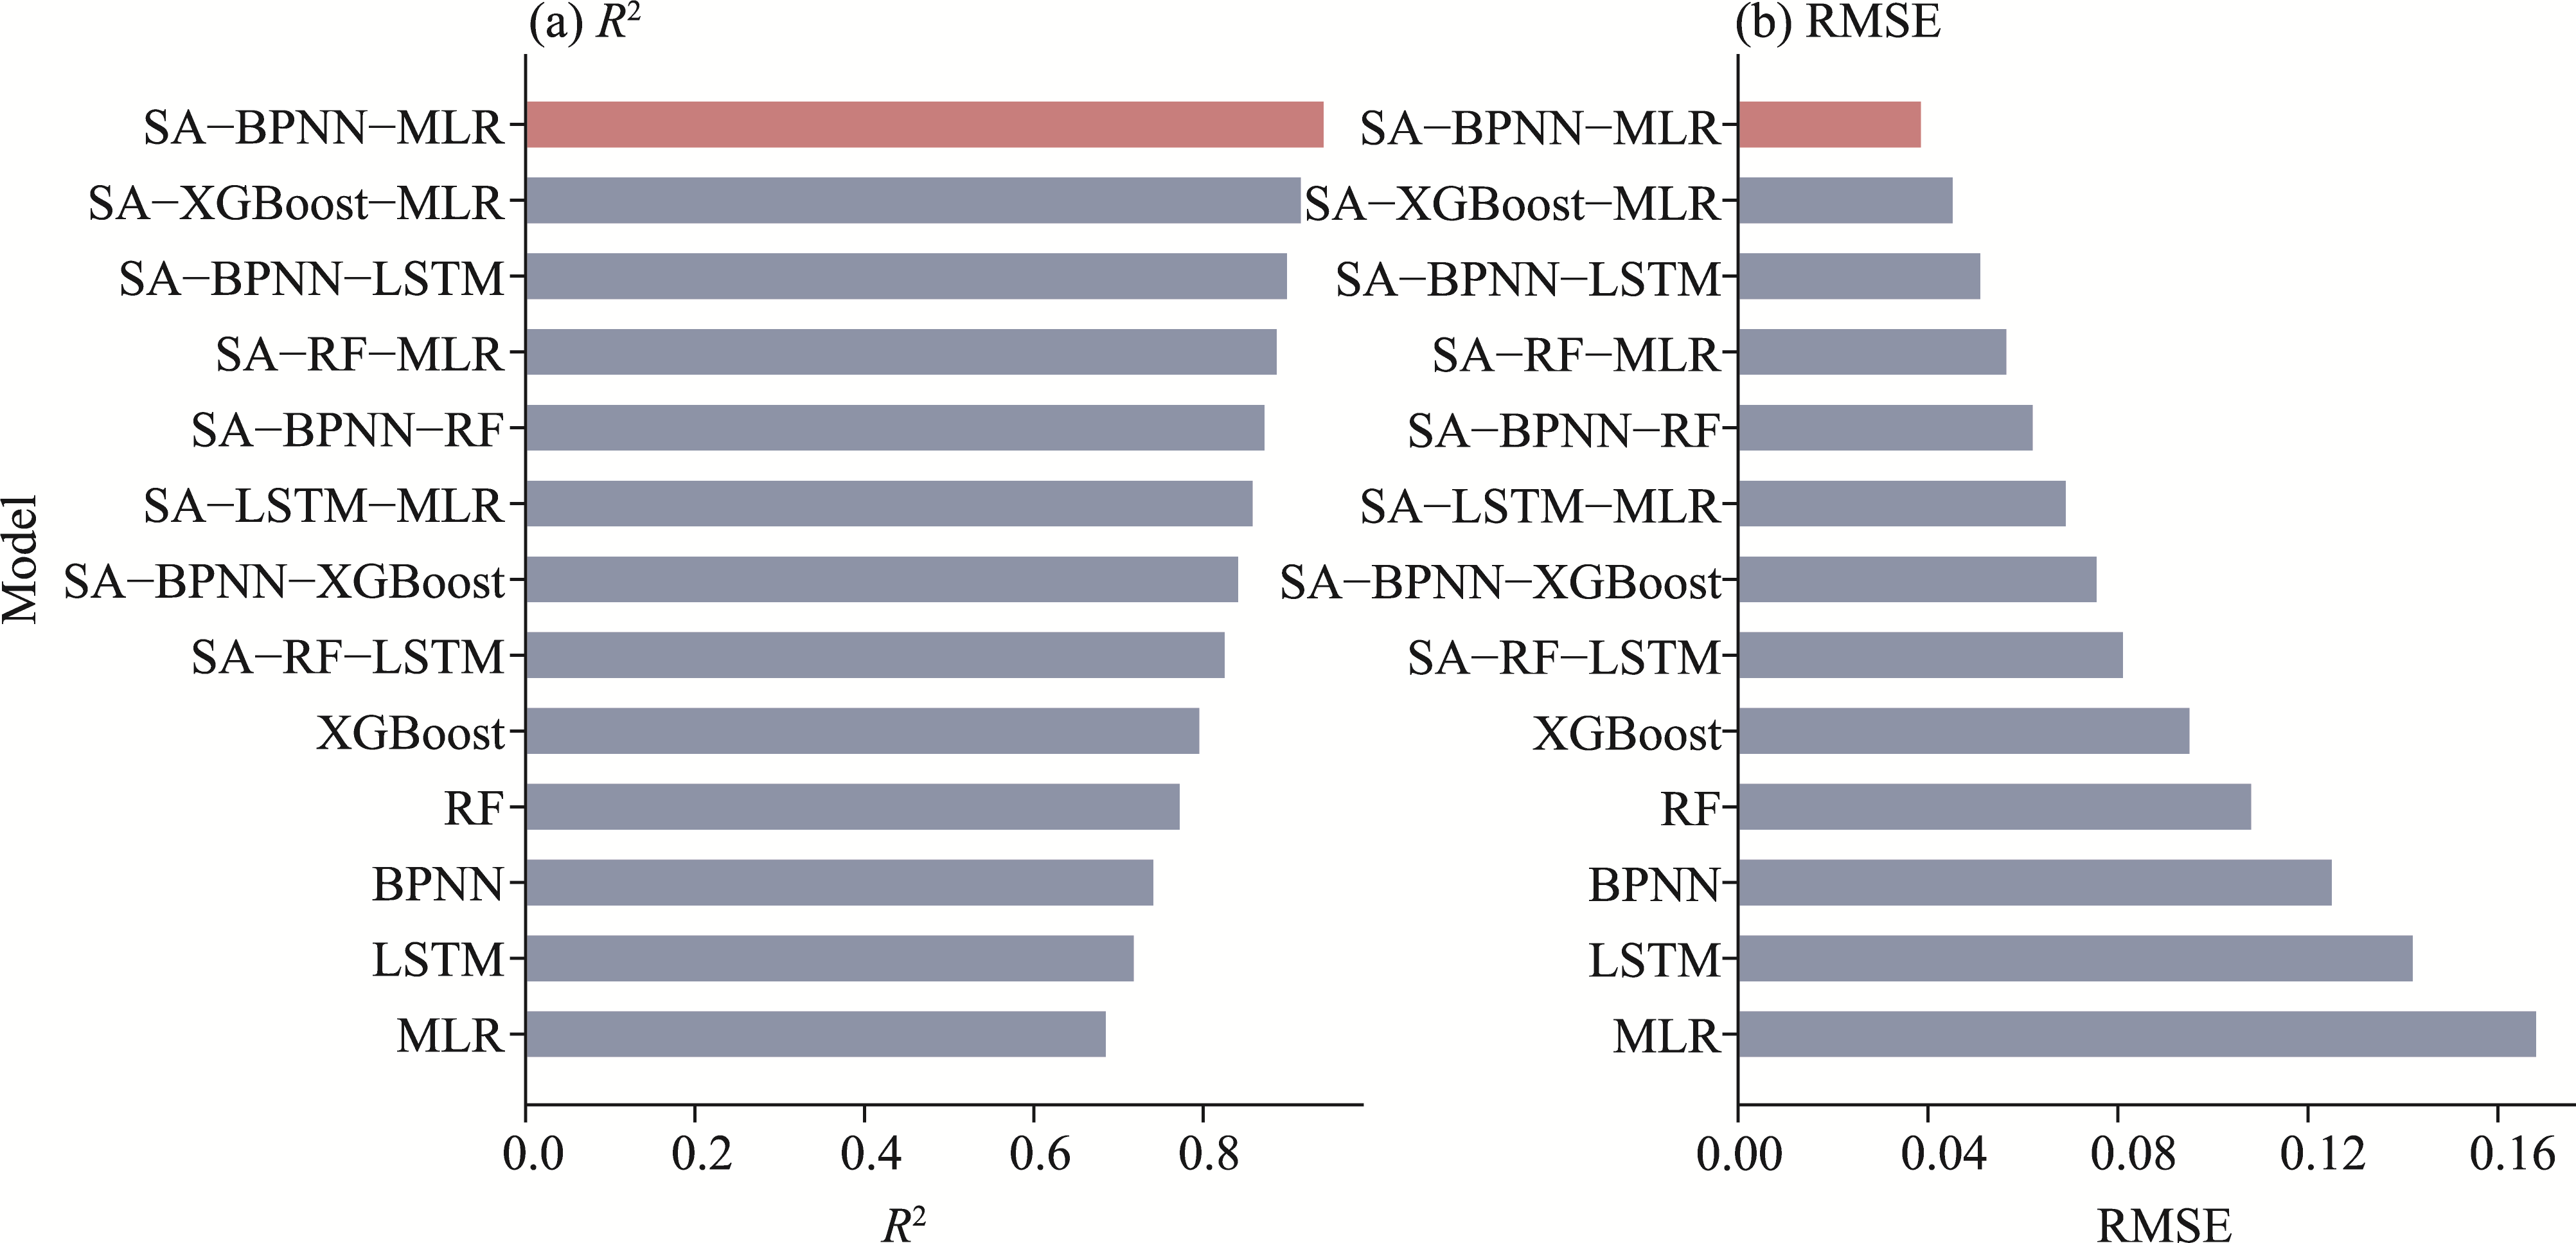
Fig. 15Predictive performance comparison of various models during the period 2009-2011. (a), coefficient of determination (R2); (b), RMSE. XGBoost, eXtreme Gradient Boosting; RF, Random Forest; LSTM, Long Short-Term Memory.
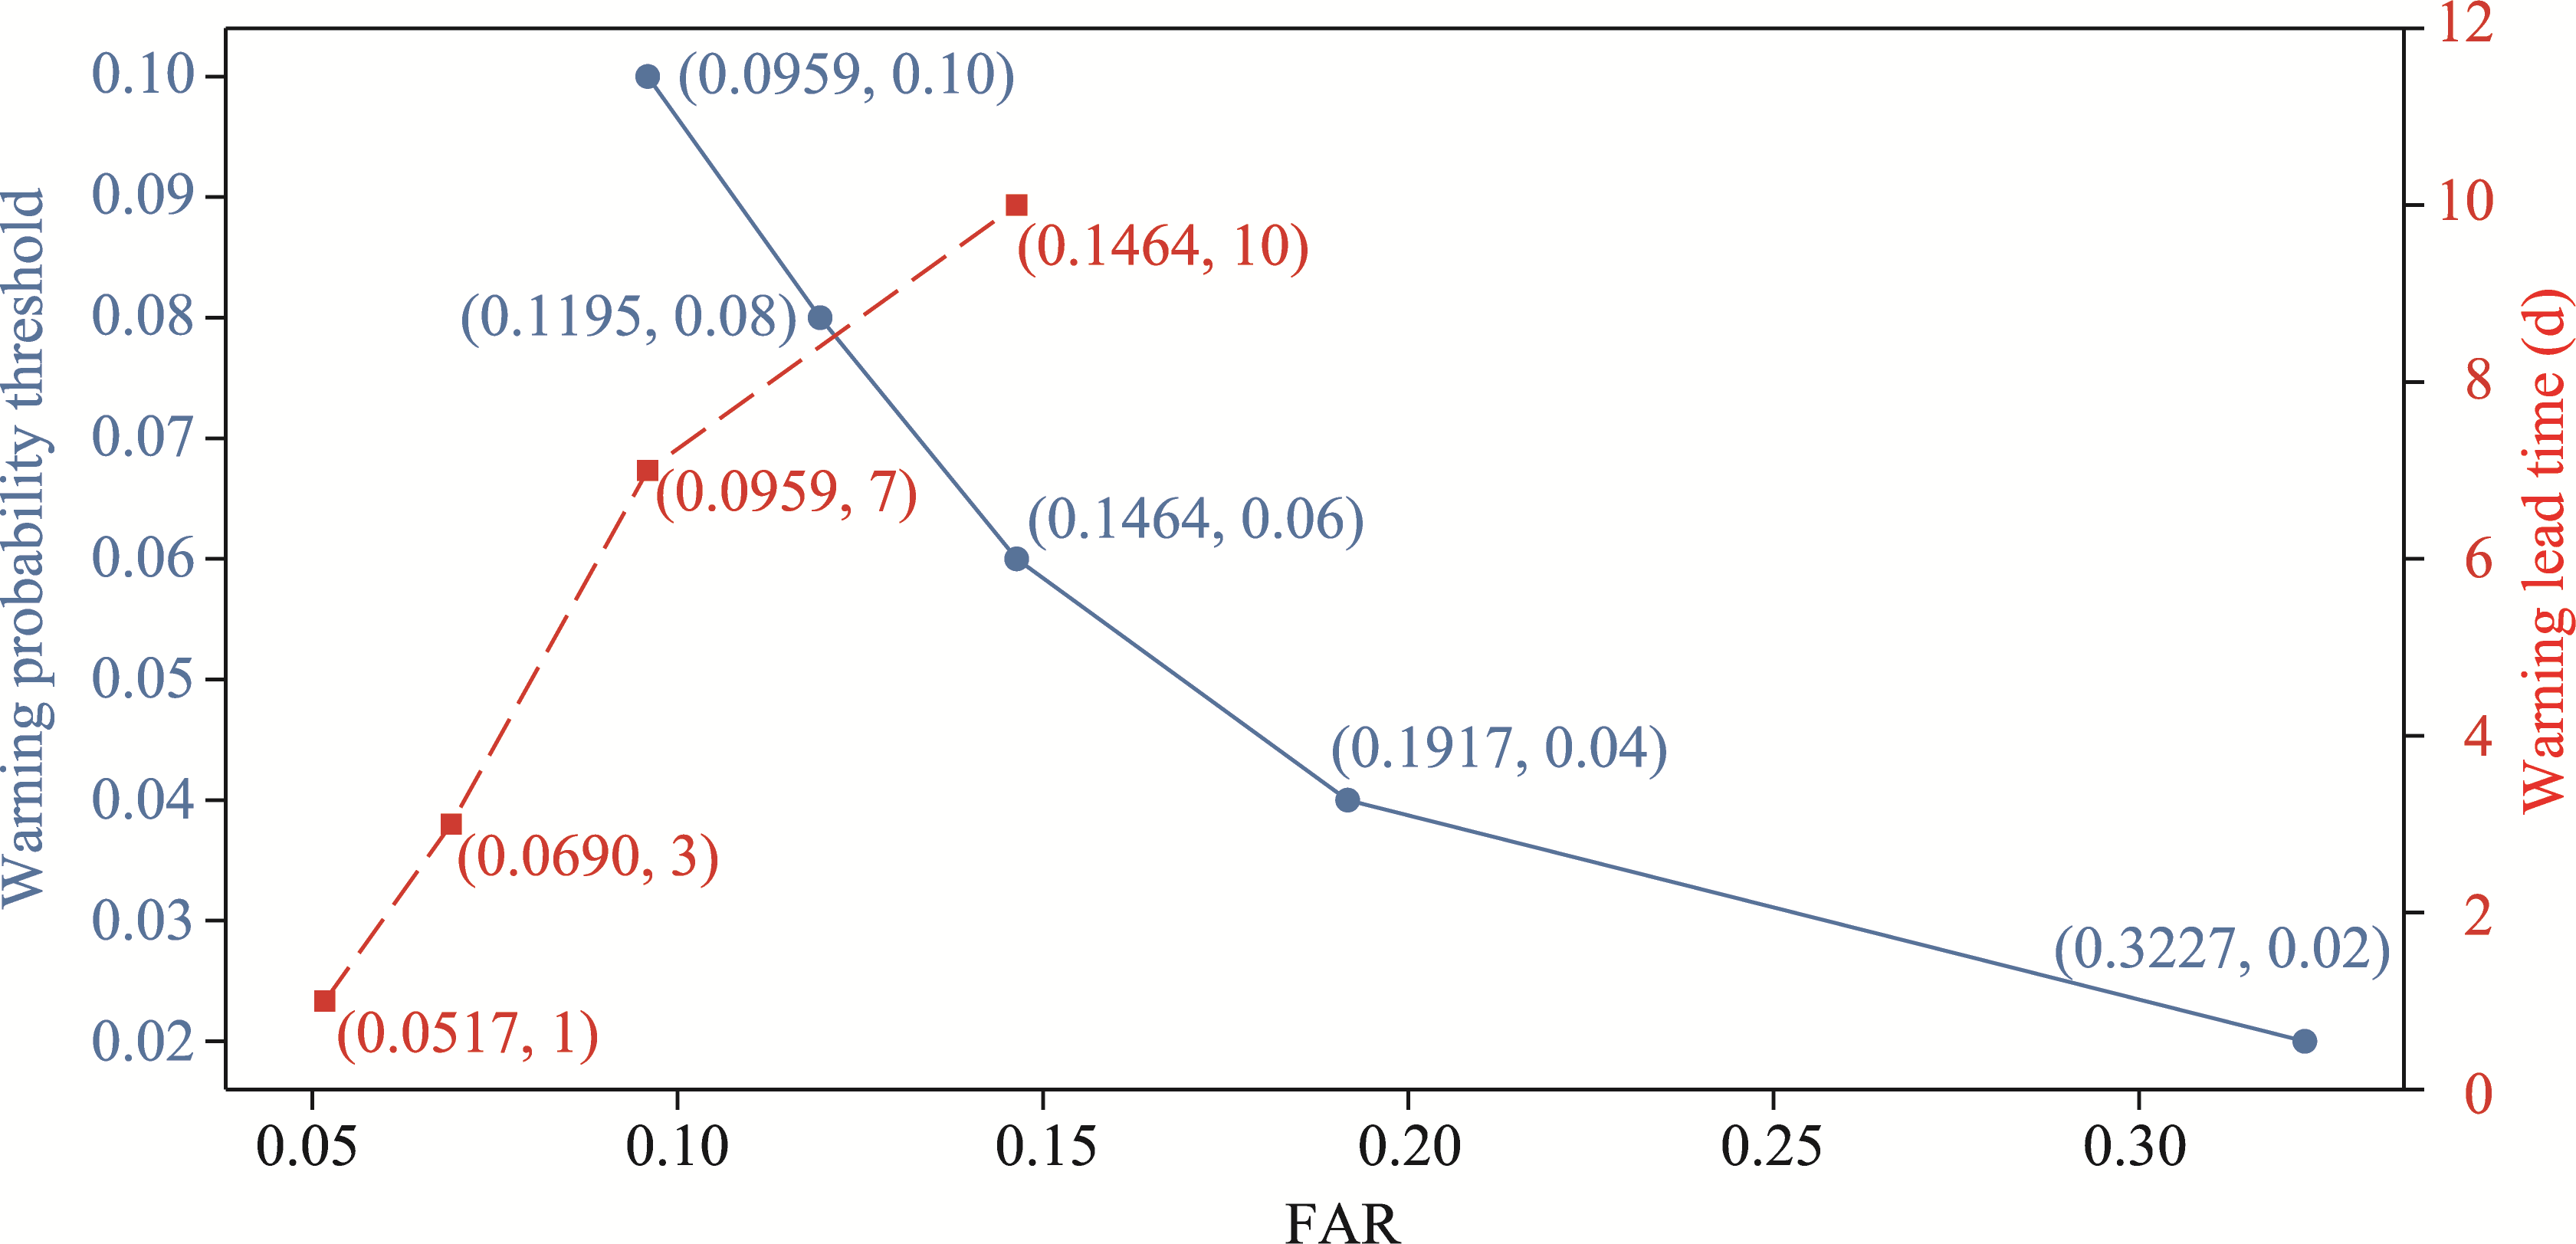
Fig. 16Relationships between the FAR, warning probability threshold, and warning lead time. The blue solid line maps the decreasing predefined warning probability thresholds against the corresponding increase in FAR. Concurrently, the red dashed line correlates the warning lead time with the FAR. The optimal intersection where forecast accuracy and adequate preparation time are balanced can be identified by superimposing these two distinct operational parameter curves onto a single continuous FAR scale.
[1]
Adamowski J, Prasher S O. 2012. Comparison of machine learning methods for runoff forecasting in mountainous watersheds with limited data. Journal of Water and Land Development, (17): 89-97.
[2]
Agnihotri J, Coulibaly P. 2020. Evaluation of snowmelt estimation techniques for enhanced spring peak flow prediction. Water, 12(5): 1290, doi: 10.3390/w12051290.
[3]
Argentin A L, Horton P, Schaefli B, et al. 2025. Scale dependency in modeling nivo-glacial hydrological systems: the case of the Arolla basin, Switzerland. Hydrology and Earth System Sciences, 29(6): 1725-1748.
doi: 10.5194/hess-29-1725-2025
[4]
Aryal Y. 2025. Assessing climate and watershed controls on rain-on-snow runoff using XGBoost-SHAP explainable AI (XAI). Geosciences, 15(12): 467, doi: 10.3390/geosciences15120467.
[5]
Atashi V, Barati R, Lim Y H. 2023a. Distributed Muskingum model with a Whale Optimization Algorithm for river flood routing. Journal of Hydroinformatics, 25(6): 2210-2222.
doi: 10.2166/hydro.2023.029
[6]
Atashi V, Barati R, Lim Y H. 2023b. Development of a distributed nonlinear Muskingum model by considering snowmelt effects for flood routing in the Red River. Scientific Reports, 13(1): 21356, doi: 10.1038/s41598-023-48895-8.
[7]
Bean B L, Watts E. 2024. Quantifying the impact of rain-on-snow induced flooding in the western United States. Water, 16(19): 2826, doi: 10.3390/w16192826.
[8]
Blöschl G, Sivapalan M. 1995. Scale issues in hydrological modelling: a review. Hydrological Processes, 9(3-4): 251-290.
doi: 10.1002/hyp.v9:3/4
[9]
Brooks P D, Solomon D K, Kampf S, et al. 2025. Groundwater dominates snowmelt runoff and controls streamflow efficiency in the western United States. Communications Earth & Environment, 6(1): 341, doi: 10.1038/s43247-025-02303-3.
[10]
Cui M Y, Zhou G, Zhang D H, et al. 2022. Global snowmelt flood disasters and their impact from 1900 to 2020. Journal of Glaciology and Geocryology, 44(6): 1898-1911. (in Chinese)
doi: 10.7522/j.issn.1000-0240.2022.0361
[11]
Davenport F V, Herrera-Estrada J E, Burke M, et al. 2020. Flood size increases nonlinearly across the western United States in response to lower snow-precipitation ratios. Water Resources Research, 56(1): e2019WR025571, doi: 10.1029/2019WR025571.
[12]
Ding Y J, Zhang S Q. 2018. Study on water internal recycle process and mechanism in typical mountain areas of inland basins, Northwest China: Progress and challenge. Advances in Earth Science, 33(7): 719-728.
doi: 10.11867/j.issn.1001-8166.2018.07.0719
[13]
Duan S H, Ullrich P, Risser M, et al. 2024. Using temporal deep learning models to estimate daily snow water equivalent over the Rocky Mountains. Water Resources Research, 60(4): e2023WR035009, doi: 10.1029/2023WR035009.
[14]
Editorial Board of China Meteorological Disaster Series. 2006. Records of Meteorological Disasters in China-Xinjiang Volume. Beijing: China Meteorological Press, 1-450. (in Chinese)
[15]
Fileni F, Fowler H J, Lewis E, et al. 2025. Flood risk assessments for small catchments under climate change—How can Scotland improve its policy for enhanced flood resilience and preparedness. Journal of Flood Risk Management, 18(1): e70035, doi: 10.1111/jfr3.70035.
[16]
Hotovy O, Nedelcev O, Seibert J, et al. 2025. Rain-on-snow events in mountainous catchments under climate change. Hydrology and Earth System Sciences, 29(17): 4199-4217.
doi: 10.5194/hess-29-4199-2025
[17]
Islam K I, Elias E, Brown C, et al. 2022. A statistical approach to using remote sensing data to discern streamflow variable influence in the snow melt dominated upper Rio Grande Basin. Remote Sensing, 14(23): 6076, doi: 10.3390/rs14236076.
[18]
Janjić J, Tadić L. 2023. Fields of application of SWAT hydrological model—A review. Earth, 4(2): 331-344.
doi: 10.3390/earth4020018
[19]
Jhong Y D, Chen C S, Lin H P, et al. 2018. Physical hybrid neural network model to forecast typhoon floods. Water, 10(5): 632, doi: 10.3390/w10050632.
[20]
Jiang C, Parteli E J R, Xia Q, et al. 2022. A regional hydrological model for arid and semi-arid river basins with consideration of irrigation. Environmental Modelling & Software, 157: 105531, doi: 10.1016/j.envsoft.2022.105531.
[21]
Koltsida E, Mamassis N, Kallioras A. 2023. Hydrological modeling using the Soil and Water Assessment Tool in urban and peri-urban environments: the case of Kifisos experimental subbasin (Athens, Greece). Hydrology and Earth System Sciences, 27(4): 917-931.
doi: 10.5194/hess-27-917-2023
[22]
Kratzert F, Klotz D, Brenner C, et al. 2018. Rainfall-runoff modelling using Long Short-Term Memory (LSTM) networks. Hydrology and Earth System Sciences, 22(11): 6005-6022.
doi: 10.5194/hess-22-6005-2018
[23]
Kuhaneswaran B, Sorwar G, Alaei A R, et al. 2025. Evolution of data-driven flood forecasting: trends, technologies, and gaps—A systematic mapping study. Water, 17(15): 2281, doi: 10.3390/w17152281.
[24]
Kumar V, Sharma K V, Mangukiya N K, et al. 2025. Machine learning applications in flood forecasting and predictions, challenges, and way-out in the perspective of changing environment. AIMS Environmental Science, 12(1): 72-105.
doi: 10.3934/environsci.2025004
[25]
Lane R A, Coxon G, Freer J E, et al. 2019. Benchmarking the predictive capability of hydrological models for river flow and flood peak predictions across over 1000 catchments in Great Britain. Hydrology and Earth System Sciences, 23(10): 4011-4032.
doi: 10.5194/hess-23-4011-2019
[26]
Latif Y, Ma Y M, Ma W Q, et al. 2020. Differentiating snow and glacier melt contribution to runoff in the Gilgit River Basin via degree-day modelling approach. Atmosphere, 11(10): 1023, doi: 10.3390/atmos11101023.
[27]
Luppichini M, Vailati G, Fontana L, et al. 2024. Machine learning models for river flow forecasting in small catchments. Scientific Reports, 14: 26740, doi: 10.1038/s41598-024-78012-2.
[28]
McEachran Z, Ghosh R, Renganathan A, et al. 2025. Knowledge-guided machine learning for operational flood forecasting. Water Resources Research, 61(11): e2024WR039064, doi: 10.1029/2024WR039064.
[29]
Mirboluki A, Mehraein M, Kisi O, et al. 2024. Groundwater level estimation using improved deep learning and soft computing methods. Earth Science Informatics, 17(3): 2587-2608.
doi: 10.1007/s12145-024-01300-y
[30]
Mosavi A, Ozturk P, Chau K. 2018. Flood prediction using machine learning models: literature review. Water, 10(11): 1536, doi: 10.3390/w10111536.
[31]
Nearing G, Cohen D, Dube V, et al. 2024. Global prediction of extreme floods in ungauged watersheds. Nature, 627: 559-563.
doi: 10.1038/s41586-024-07145-1
[32]
Nearing G S, Kratzert F, Sampson A K, et al. 2021. What role does hydrological science play in the age of machine learning? Water Resources Research, 57(3): e2020WR028091, doi: 10.1029/2020WR028091.
[33]
O’brien R M. 2007. A caution regarding rules of thumb for variance inflation factors. Quality & Quantity, 41(5): 673-690.
[34]
Samantaray S, Sahoo A, Agnihotri A. 2023. Prediction of flood discharge using hybrid PSO-SVM algorithm in Barak River Basin. MethodsX, 10: 102060, doi: 10.1016/j.mex.2023.102060.
[35]
Santos L B L, Escobar-Silva E V, Satolo L F, et al. 2025. Machine learning-based hydrological models for flash floods: a systematic literature review. Smart Construction and Sustainable Cities, 3(1): 21, doi: 10.1007/s44268-025-00071-9.
[36]
Stein L, Clark M P, Knoben W J M, et al. 2021. How do climate and catchment attributes influence flood generating processes? A large-sample study for 671 catchments across the contiguous USA. Water Resources Research, 57(4): e2020WR028300, doi: 10.1029/2020WR028300.
[37]
Tencate A J, Kalivas J H, White A J. 2016. Fusion strategies for selecting multiple tuning parameters for multivariate calibration and other penalty based processes: a model updating application for pharmaceutical analysis. Analytica Chimica Acta, 921: 28-37.
doi: S0003-2670(16)30396-8
pmid: 27126787
[38]
Teshome F T, Bayabil H K, Thakural L N, et al. 2020. Verification of the MIKE11-NAM model for simulating streamflow. Journal of Environmental Protection, 11(2): 152-167.
doi: 10.4236/jep.2020.112010
[39]
Thapa S, Zhao Z B, Li B, et al. 2020. Snowmelt-driven streamflow prediction using machine learning techniques (LSTM, NARX, GPR, and SVR). Water, 12(6): 1734, doi: 10.3390/w12061734.
[40]
Thapa U, Pati B M, Thapa S, et al. 2024. Comparative analysis of snowmelt-driven streamflow forecasting using machine learning techniques. Water, 16(15): 2095, doi: 10.3390/w16152095.
[41]
Tran Tuan T. 2024. Multiple conceptual hydrological models for simulating streamflow in data-sparse river basins: an application of the Vietnamese Cau river basin. Water Practice & Technology, 19(7): 2944-2958.
[42]
Venegas-Cordero N, Cherrat C, Kundzewicz Z W, et al. 2023. Model-based assessment of flood generation mechanisms over Poland: the roles of precipitation, snowmelt, and soil moisture excess. Science of The Total Environment, 891: 164626, doi: 10.1016/j.scitotenv.2023.164626.
[43]
Wang J J, Shi P, Jiang P, et al. 2017. Application of BP neural network algorithm in traditional hydrological model for flood forecasting. Water, 9(1): 48, doi: 10.3390/w9010048.
[44]
Wilks D S. 2011. Statistical Methods in the Atmospheric Sciences (3rd ed.). Boston: Academic Press, 1-676.
[45]
Xie Z H, Yuan F, Duan Q Y, et al. 2007. Regional parameter estimation of the VIC land surface model: methodology and application to river basins in China. Journal of Hydrometeorology, 8(3): 447-468.
doi: 10.1175/JHM568.1
[46]
Yan H X, Sun N, Wigmosta M S, et al. 2023. The role of snowmelt temporal pattern in flood estimation for a small snow-dominated basin in the Sierra Nevada. Water Resources Research, 59(10): e2023WR034496, doi: 10.1029/2023WR034496.
[47]
Yan K, Gao S, Wen J H, et al. 2023. A multi-factor combination model for medium to long-term runoff prediction based on improved BP neural network. Water, 15(20): 3559, doi: 10.3390/w15203559.
[48]
Yeganeh A, Ahmadi F, Wong Y J, et al. 2024. Shallow vs. deep learning models for groundwater level prediction: a multi-piezometer data integration approach. Water, Air, & Soil Pollution, 235(7): 441, doi: 10.1007/s11270-024-07247-6.
[49]
Yu X T, Xu Y P, Gu H T, et al. 2023. Multi-objective robust optimization of reservoir operation for real-time flood control under forecasting uncertainty. Journal of Hydrology, 620: 129421, doi: 10.1016/j.jhydrol.2023.129421.
[50]
Zhao Q D, Zhao C C, Qin Y, et al. 2020. Response of the hydrological processes to climate change in the Muzati River basin with high glacierization, southern slope of the Tianshan Mountains. Journal of Glaciology and Geocryology, 42(4): 1285-1298. (in Chinese)
[51]
Zhou M Q, Lu W J, Ma Q, et al. 2023. Study on the snowmelt flood model by machine learning method in Xinjiang. Water, 15(20): 3620, doi: 10.3390/w15203620.