Trade-offs between environmental benefits, energy efficiency, and economic returns in the wheat cropping system of arid irrigated areas in Northwest China
WANG Qi1, PAN Yingxin1, BAI Liaoxia1, ZHAO Tongliang1, SONG Wenbin1, MA Shile1, Allen David MCHUGH2, WANG Ting3, LYU Xiaodong1,*()
1School of Environmental and Municipal Engineering, Lanzhou Jiaotong University, Lanzhou 730070, China 2Center for Agricultural Engineering, University of Southern Queensland, Toowoomba 4350, Australia 3Institute of Soil, Fertilizer and Water-saving Agriculture, Gansu Academy of Agricultural Sciences, Lanzhou 730070, China
In the Hexi Corridor of Northwest China, oasis-irrigated agriculture depends on intensive water and fertilizer inputs to attain high yields. However, the synergy between resource efficiency and environmental sustainability remains unclear. Based on a two-year (2021-2022) field experiment in the arid irrigation areas of Hexi Corridor, this study evaluated four management practices for spring wheat systems: conventional practice (CP), optimized practice (OP), OP with nitrification inhibitor (OP-NI), and OP with slow-release fertilizer (OP-SRF). To identify the optimal strategies, we assessed their effects on carbon and nitrogen footprints, energy balances, and economic benefits using life cycle assessment (LCA), energy balance analysis, and economic calculation methods. Among the four treatments, two-year average cumulative soil direct greenhouse gas (GHG) emissions ranged from 7118.7 to 8353.6 kg CO2-eq/hm2. The GHG emissions from agricultural management ranged from 6823.0 to 7904.4 kg CO2-eq/hm2. Compared to CP, OP-NI and OP-SRF treatments significantly reduced the carbon footprint per unit area (by 232.9% and 267.4%, respectively) and the nitrogen footprint per unit area (by 32.5% and 35.5%, respectively), while improving energy use efficiency (by 35.7% and 39.0%, respectively). The OP-NI treatment achieved the highest economic returns, which was 18.4% higher than the OP-SRF treatment over the two-year average. The multi-dimensional trade-off analysis based on Z-score showed CP treatment with the lowest total score (-20.92) and OP-NI treatment with the highest (9.62). The OP-NI treatment was proven to be the optimal management strategy for spring wheat production in the arid irrigation areas of Hexi Corridor. It can maintain crop yield, enhance energy efficiency, and improve economic returns, while reducing carbon and nitrogen footprints, thereby promoting sustainable agriculture. This study provides a scientific basis and practical reference for sustainable, low-carbon wheat production in arid irrigation regions of Northwest China.
Received: 03 September 2025
Published: 30 September 2026
Conceptualization: WANG Qi; Data curation: WANG Qi, Formal analysis: WANG Qi, PAN Yingxin; Funding acquisition: LYU Xiaodong, WANG Ting; Investigation: WANG Qi; Methodology: WANG Qi, ZHAO Tongliang; Project administration: WANG Qi, PAN Yingxin; Resources: WANG Qi; Software: WANG Qi; Supervision: SONG Wenbin, MA Shile, LYU Xiaodong; Validation: WANG Qi; Visualization: WANG Qi; Writing - original draft: WANG Qi; Writing - review & editing: WANG Qi, LYU Xiaodong, WANG Ting, Allen David MCHUGH. All authors approved the manuscript.
WANG Qi, PAN Yingxin, BAI Liaoxia, ZHAO Tongliang, SONG Wenbin, MA Shile, Allen David MCHUGH, WANG Ting, LYU Xiaodong. Trade-offs between environmental benefits, energy efficiency, and economic returns in the wheat cropping system of arid irrigated areas in Northwest China. Journal of Arid Land, 2026, 18(9): 1577-1600.
Fig. 1Variation in precipitation and temperature at the experiment site from 2021 to 2023
Year
Date
CP
OP
OP-NI
OP-SRF
N application (kg N/hm2)
Irrigation (m3/hm2)
N application (kg N/hm2)
Irrigation (m3/hm2)
N application (kg N/hm2)
Irrigation (m3/hm2)
N application (kg N/hm2)
Irrigation (m3/hm2)
2021
10 March
196.0
0
126.0
0
126.0+6.3
0
180.0
0
10 May
84.0
1350
54.0
900
54.0+2.7
900
0.0
900
10 June
0.0
1350
0.0
1200
0.0
1200
0.0
1200
18 July
0.0
1350
0.0
900
0.0
900
0.0
900
10 November
0.0
600
0.0
600
0.0
600
0.0
600
2022
8 March
196.0
0
126.0
0
126.0+6.3
0
180.0
0
8 May
84.0
1350
54.0
900
54.0+2.7
900
0.0
900
8 June
0.0
1350
0.0
1200
0.0
1200
0.0
1200
15 July
0.0
1350
0.0
900
0.0
900
0.0
900
8 November
0.0
600
0.0
600
0.0
600
0.0
600
Table 1 Irrigation and fertilization schedules for different treatments
Fig. 2System boundary of farmland carbon and nitrogen footprint. NI, nitrification inhibitor; SRF, slow-release fertilizer.
Item
CO2 equivalent emission factor
Unit for each factor
Reference
Wheat seed
2.51
kg CO2-eq/kg
Zhang et al. (2016)
Transportation
103.00
kg CO2-eq/(t•km)
Liu et al. (2016)
Diesel
3.94
kg CO2-eq/kg
IPCC (2007)
Labor
0.86
kg CO2-eq/(worker•d)
Liu et al. (2013)
Pesticide
4.70
kg CO2-eq/kg
West and Marland (2002)
Irrigation electricity
1.12
kg CO2-eq/kWh
Liu et al. (2016)
Nitrogenous fertilizer
8.30
kg CO2-eq/kg
Zhang et al. (2013)
Phosphate fertilizer
1.14
kg CO2-eq/kg
Liu et al. (2013)
Potash fertilizer
0.66
kg CO2-eq/kg
Liu et al. (2013)
Table 2 CO2 equivalent emission factors for agricultural management inputs
Item
N emission factor
Unit for each factor
N emission under each treatment (g N-eq/hm2)
CP
OP
OP-NI
OP-SRF
Wheat seed
0.24
g N-eq/kg
72.0
72.0
72.0
72.0
Diesel
3.45
g N-eq/kg
121.4
121.4
121.4
121.4
Pesticide
4.96
g N-eq/kg
18.6
18.6
18.6
18.6
Irrigation electricity
0.11
g N-eq/kWh
81.9
53.2
53.2
53.2
Nitrogenous fertilizer
0.89
g N-eq/kg
249.2
160.2
168.2
160.2
Phosphate fertilizer
0.60
g N-eq/kg
43.8
54.0
54.0
54.0
Potash fertilizer
0.03
g N-eq/kg
0.0
1.0
1.0
1.0
Total N emission
586.9
480.4
488.4
480.4
Table 3 N emission factors and emissions for agricultural management under different treatments
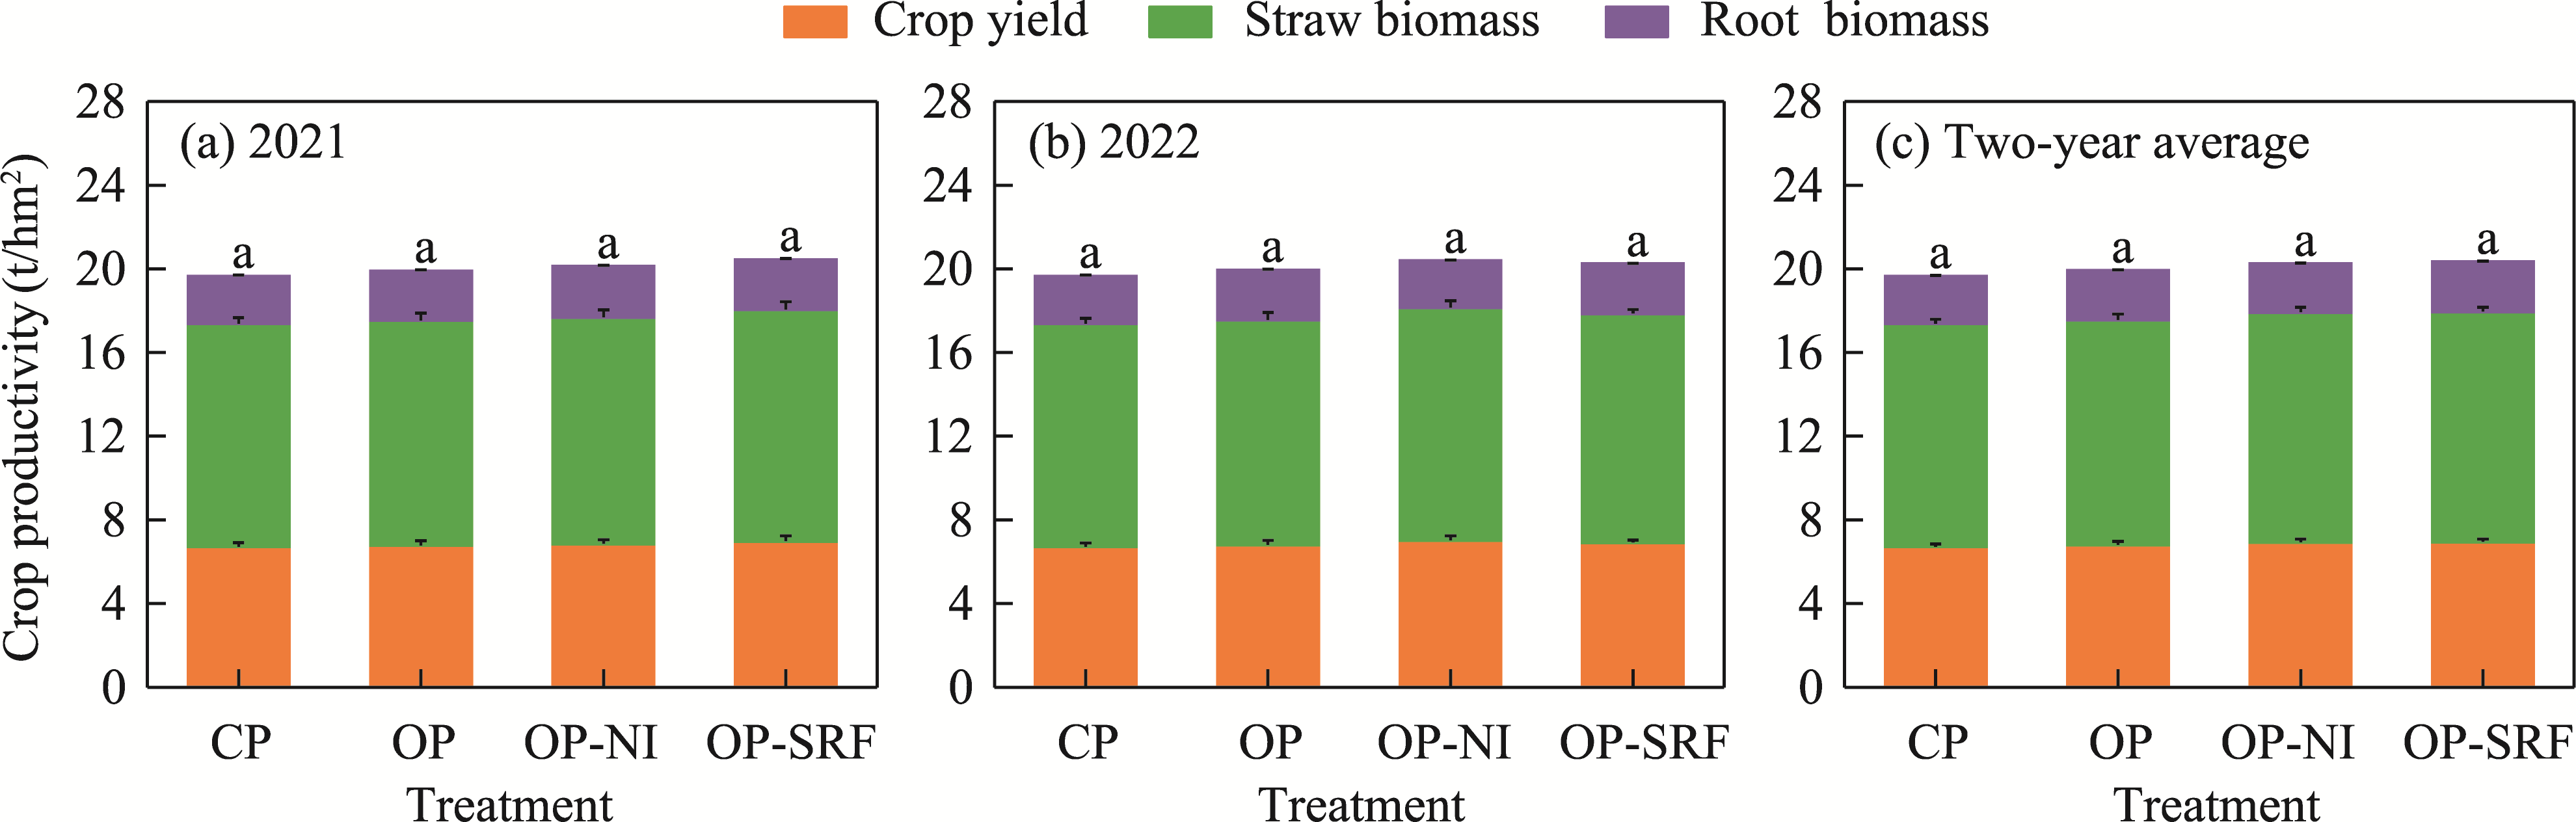
Fig. 3Crop productivity of spring wheat in 2021 (a) and 2022 (b) and two-year average crop productivity (c) under different treatments. CP, conventional practice; OP, optimized practice; OP-NI, OP with nitrification inhibitor; OP-SRF, OP with slow-release fertilizer. Bars are standard errors. No significant differences (P>0.050) were observed in total productivity or its components among treatments within either year.
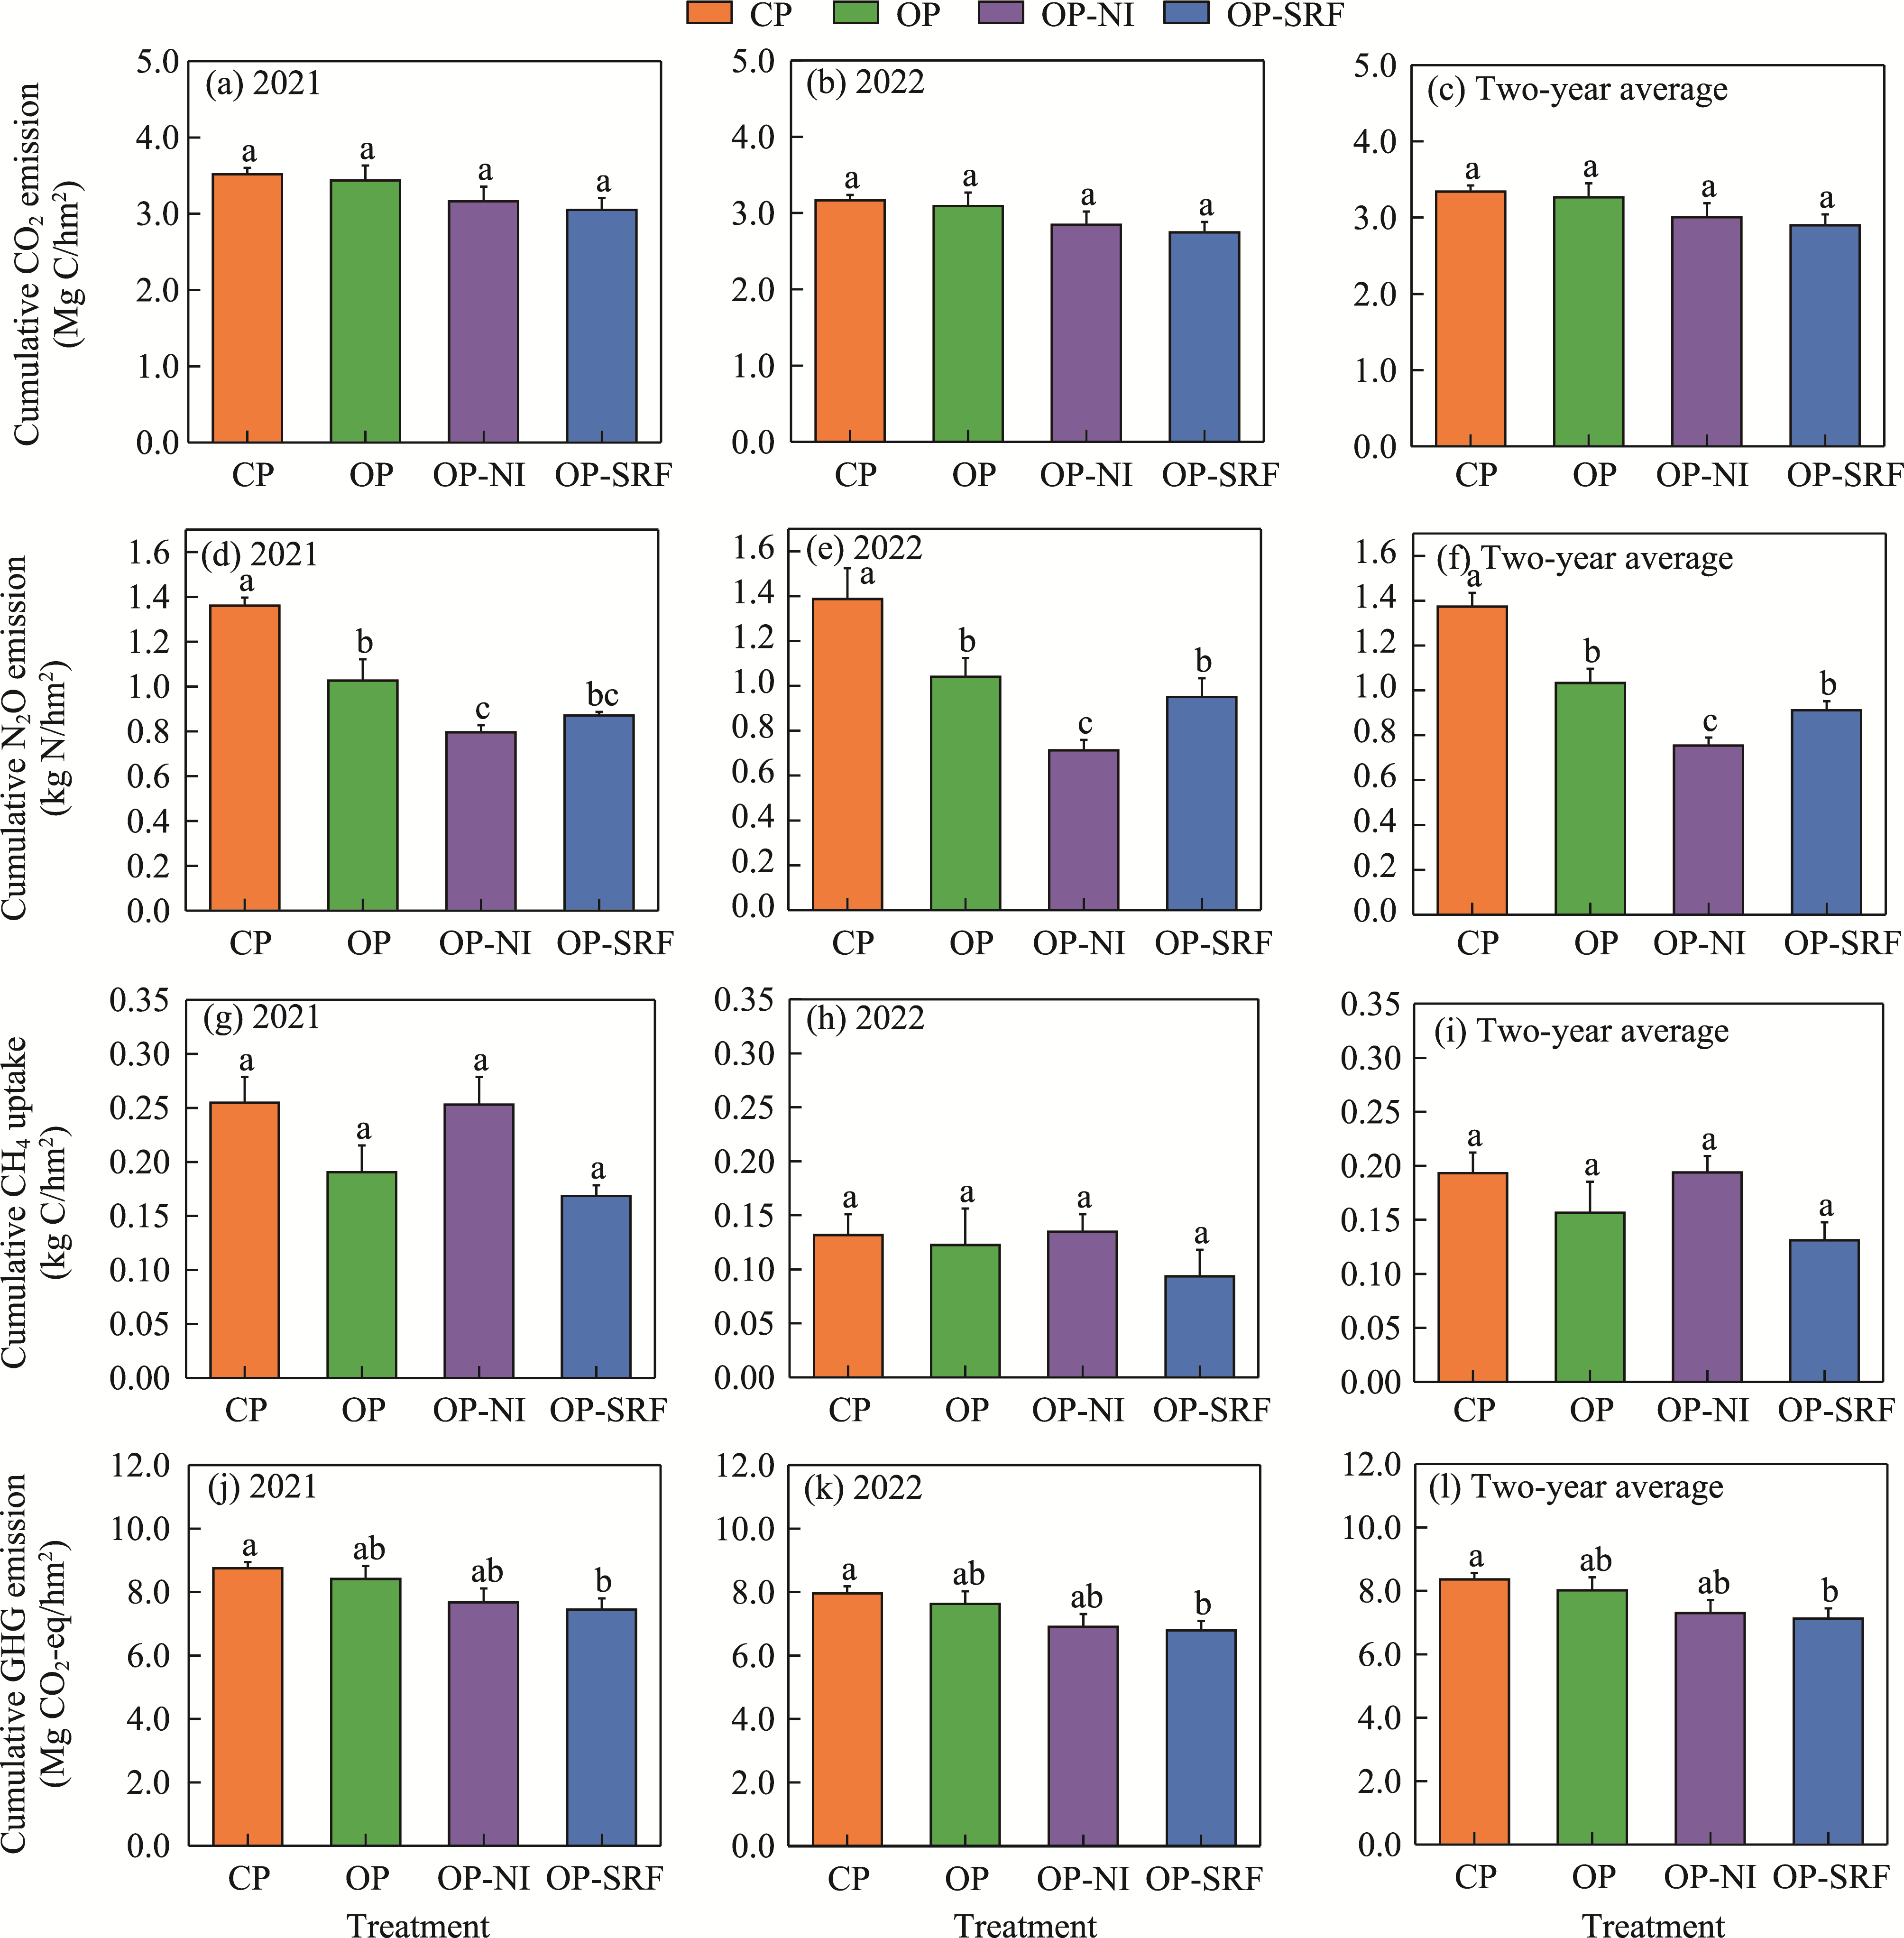
Fig. 4Effects of different treatments on soil greenhouse gas (GHG) fluxes in spring wheat system during 2021-2022. (a-c), cumulative CO2 emission; (d-f), cumulative N2O emission; (g-i), cumulative CH4 uptake; (j-l), cumulative soil direct GHG emission (including CO2, N2O, and CH4). Bars are standard errors. Different lowercase letters indicate significant differences among treatments (least significant difference (LSD) test, P<0.050).
Item
GHG emission under each treatment (kg CO2-eq/hm2)
CP
OP
OP-NI
OP-SRF
Wheat seeds
753.0
753.0
753.0
753.0
Transportation
3750.2
3750.2
3750.2
3750.2
Diesel
138.6
138.6
138.6
138.6
Labor
3.8
3.2
3.2
2.7
Pesticide
17.6
17.6
17.6
17.6
Irrigation electricity
834.0
541.5
541.5
541.5
Nitrogenous fertilizer
2324.0
1494.0
1568.7
1494.0
Phosphate fertilizer
83.2
102.6
102.6
102.6
Potash fertilizer
0.0
22.8
22.8
22.8
Total GHG emission
7904.4
6823.5
6898.3
6823.0
Table 4 Greenhouse gas (GHG) emissions for agricultural management under different treatments
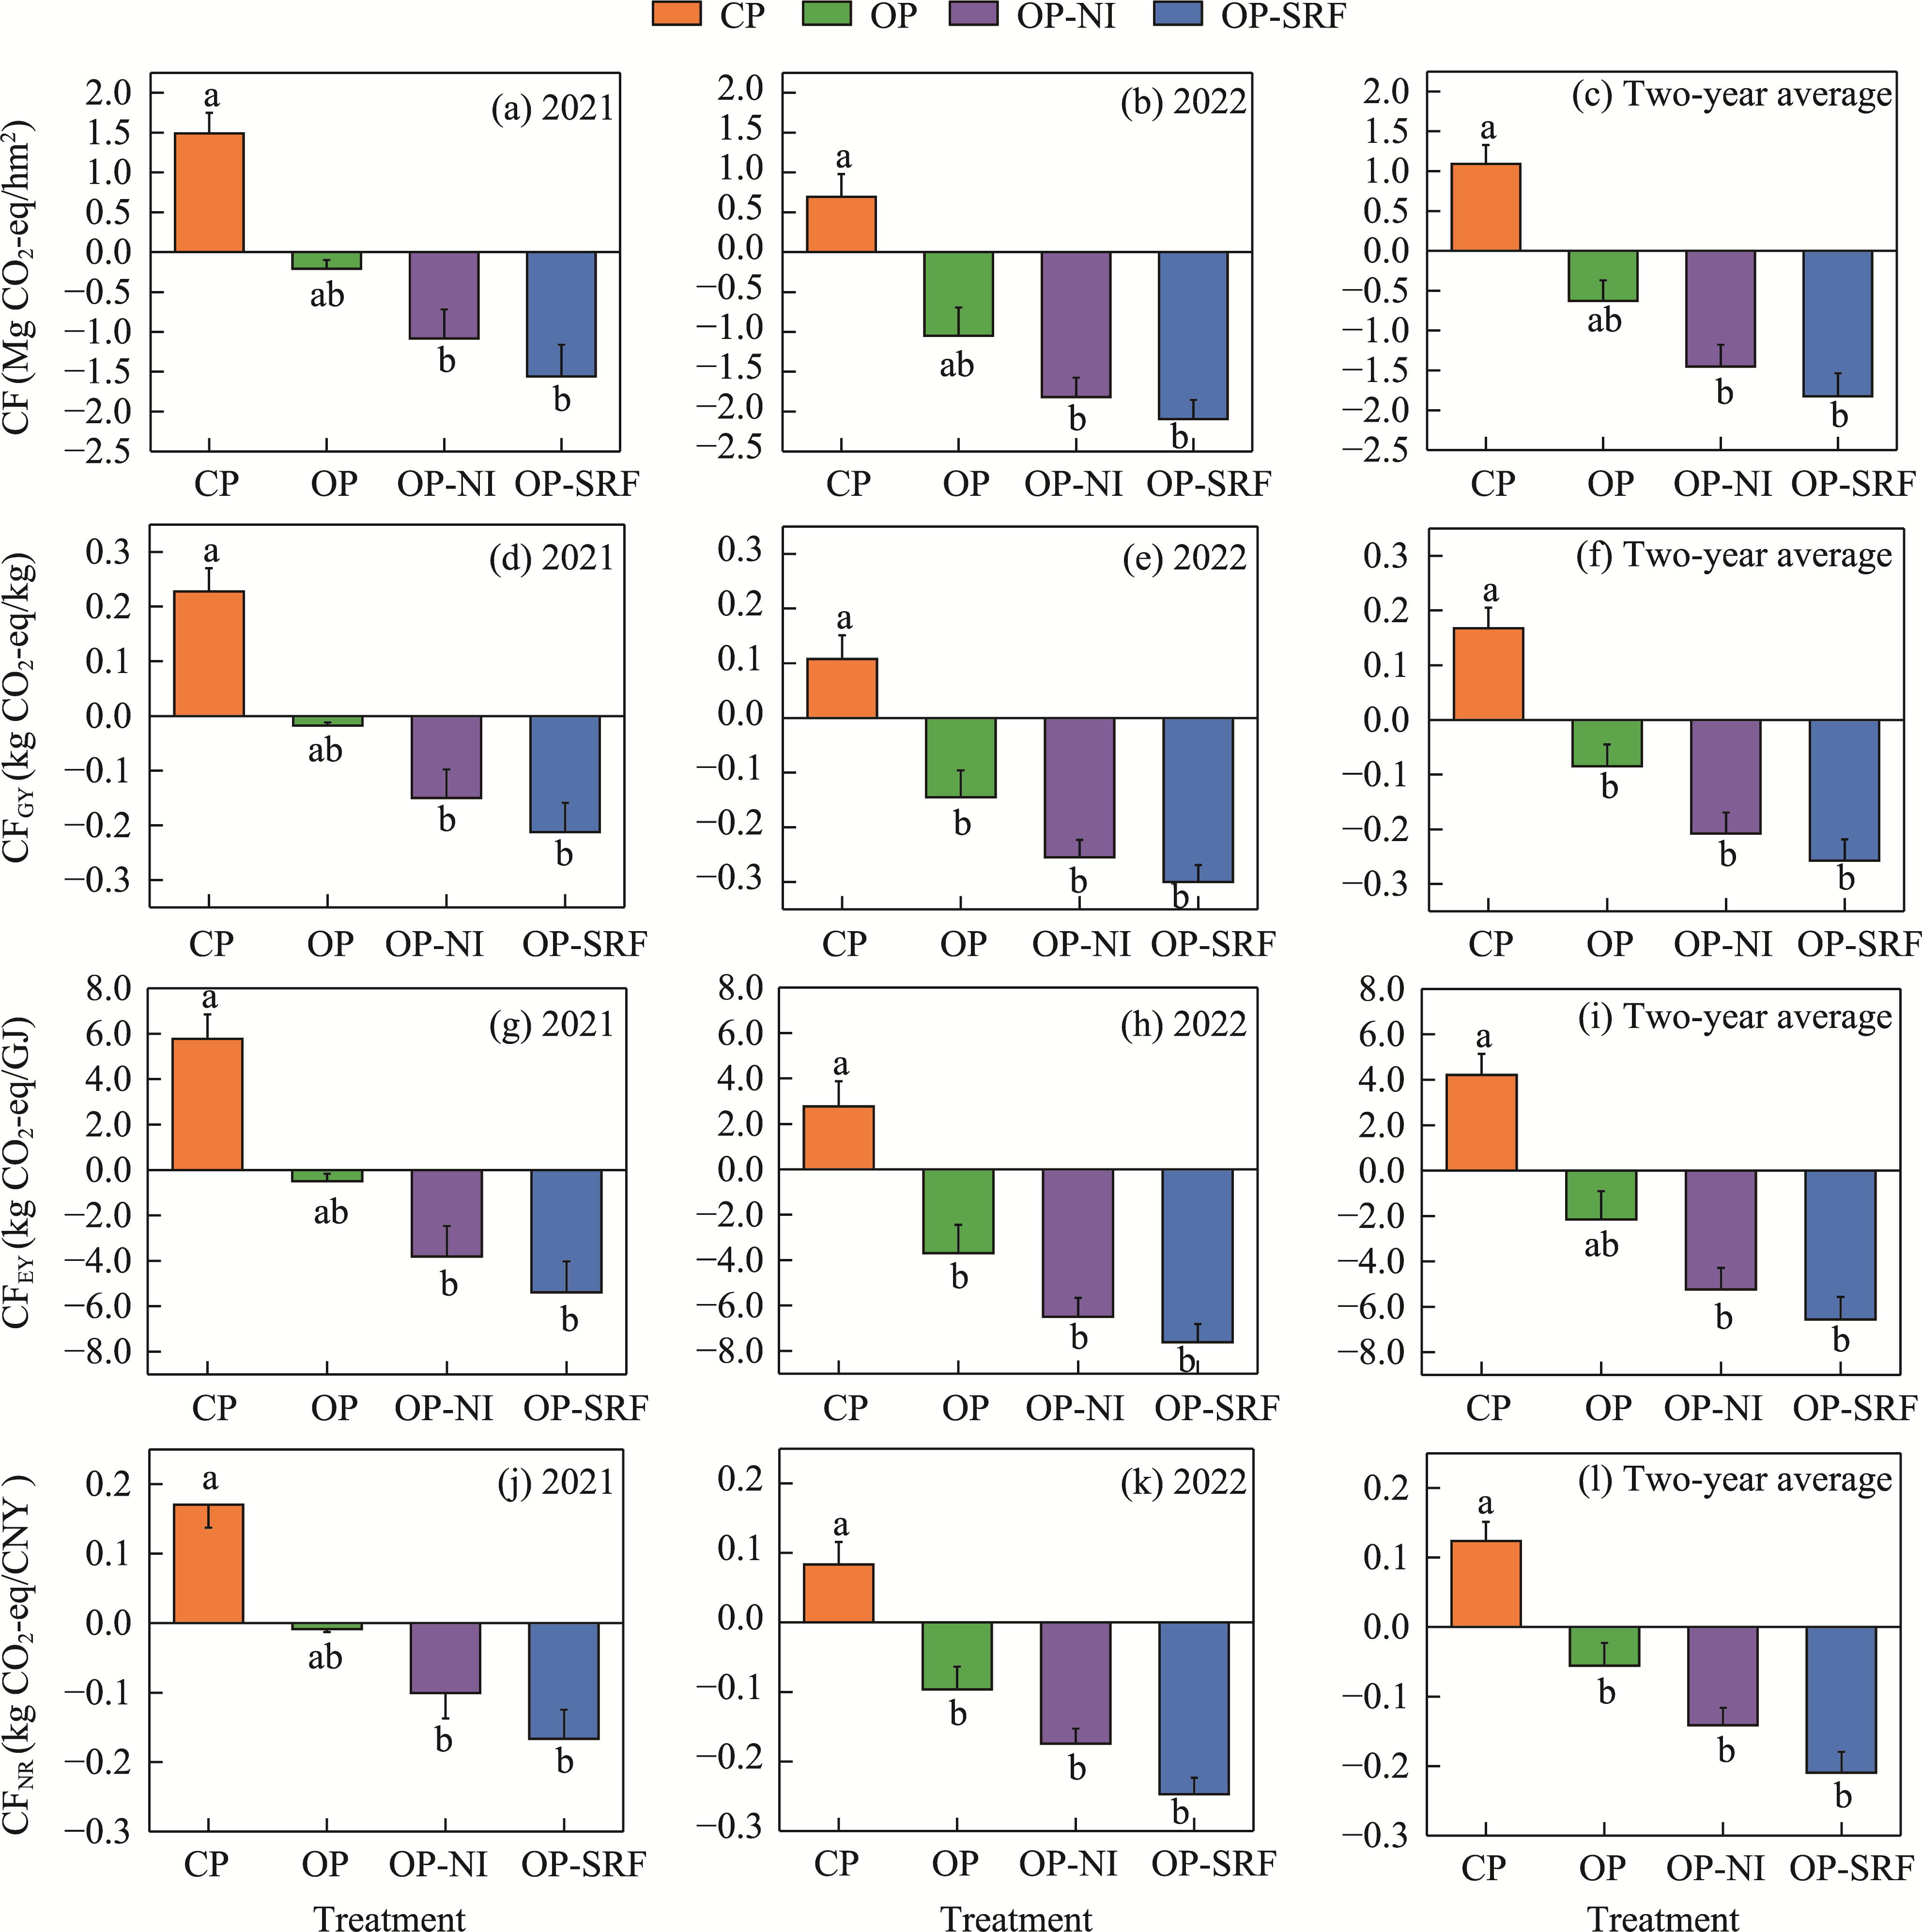
Fig. 5Effects of different treatments on the carbon footprint of spring wheat production during 2021-2022. (a-c), carbon footprint per unit area (CF); (d-f), carbon footprint per unit crop yield (CFGY); (g-i), carbon footprint per unit energy yield (CFEY); (j-l), carbon footprint per unit net revenue (CFNR). Bars are standard errors. Different lowercase letters indicate significant differences among treatments (LSD test, P<0.050).
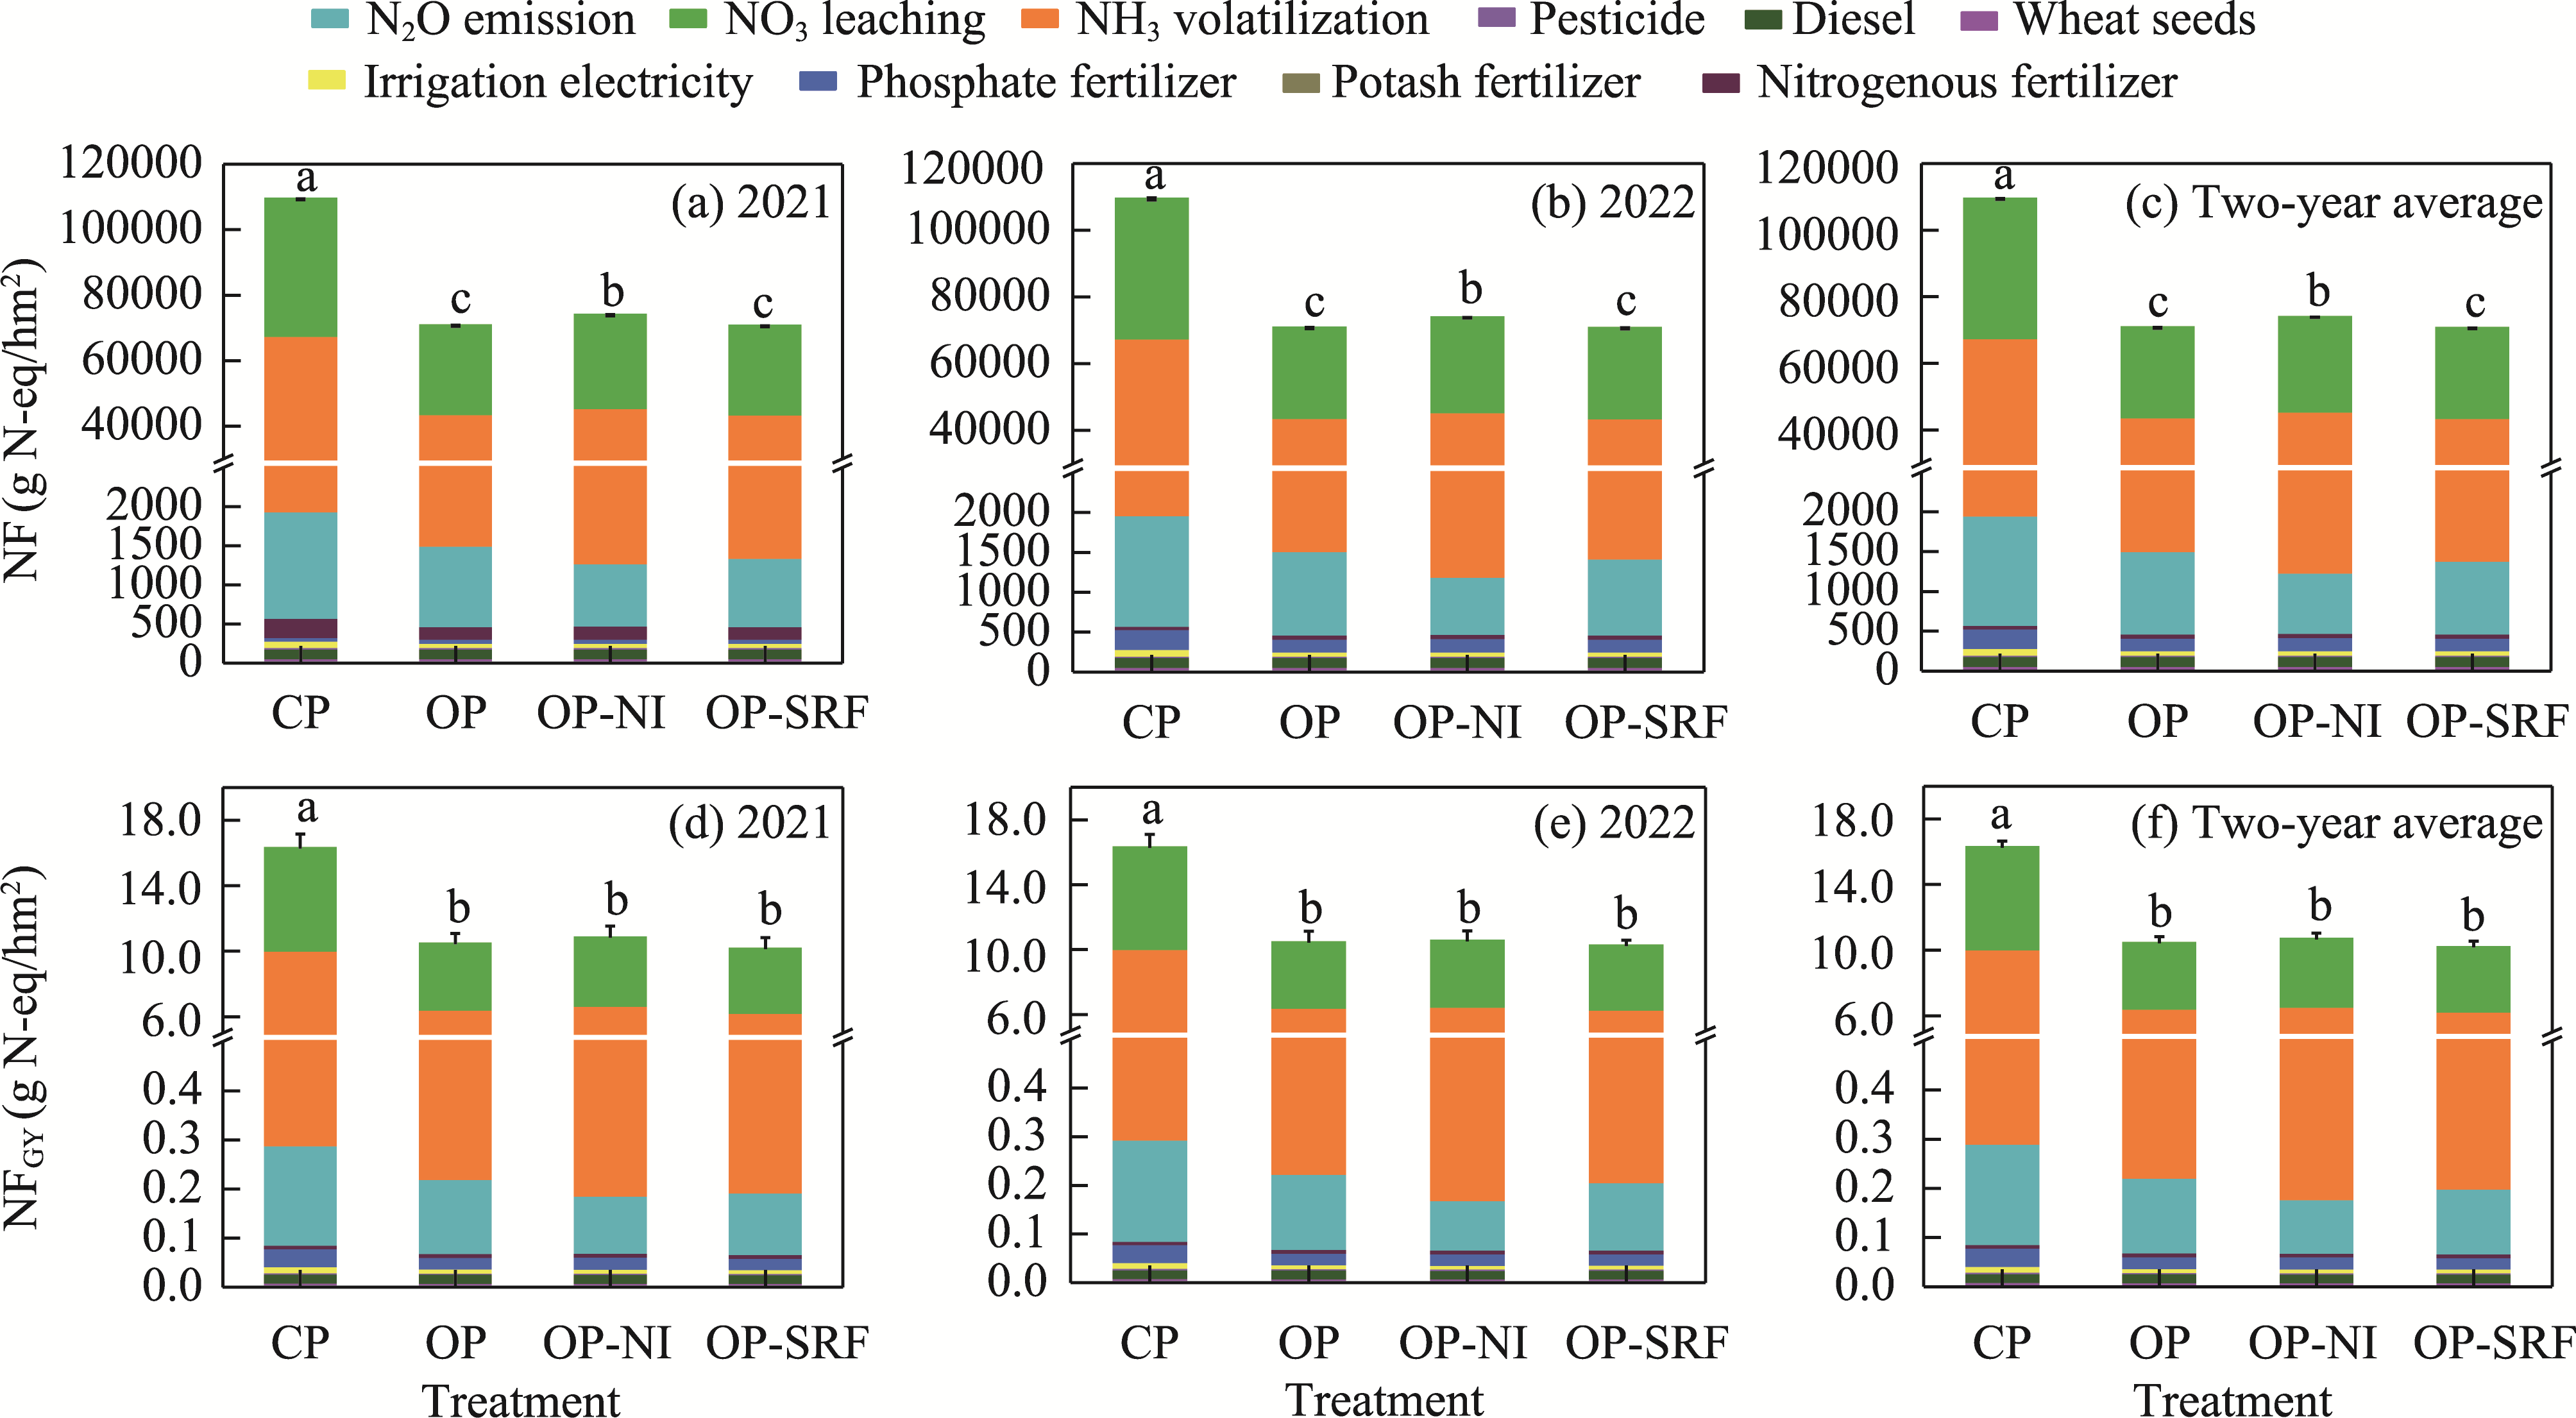
Fig. 6Effects of different treatments on nitrogen footprint per unit area (NF; a-c) and nitrogen footprint per unit crop yield (NFGY; d-f) during 2021-2022. Bars are standard errors. Different lowercase letters indicate significant differences among treatments (LSD test, P<0.050).
Treatment
Energy input (MJ/hm2)
EI (GJ/hm2)
Labor
Farm machinery
Diesel
Irrigation electricity
Irrigation water
Fertilizer
Pesticide
Wheat seed
CP
210
94
1981
8883
4743
17,778
692
4410
36.8
OP
174
94
1981
5768
3672
12,139
692
4410
28.9
OP-NI
177
94
1981
5768
3672
12,684
692
4410
29.5
OP-SRF
145
94
1981
5768
3672
12,139
692
4410
28.9
Mean
176
94
1981
6547
3940
13,685
692
4410
31.5
Table 5 Energy input during spring wheat production under different treatments
Year
Treatment
Energy output (GJ/hm2)
EO (GJ/hm2)
NE (GJ/hm2)
SE (GJ/kg)
Crop
Straw
Root
2021
CP
109.7±2.9a
155.5±4.1a
33.0±0.9a
298.2±7.9a
259.4±7.9a
5.8±0.2a
OP
110.7±3.5a
156.9±5.0a
34.4±0.8a
302.1±9.3a
273.1±9.3a
4.3±0.1b
OP-NI
111.7±3.5a
158.2±5.0a
35.4±0.7a
305.3±9.2a
275.8±9.2a
4.3±0.2b
OP-SRF
113.9±7.9a
161.4±5.6a
35.0±0.8a
310.3±10.4a
281.4±10.4a
4.2±0.2b
Mean
111.5
158.0
34.4
303.9
272.4
4.6
2022
CP
109.7±2.7a
155.5±3.8a
33.0±0.8a
298.2±7.2a
259.4±7.2a
5.8±0.1a
OP
110.9±3.7a
157.1±5.2a
34.8±0.6a
302.7±9.5a
273.8±9.5a
4.3±0.2b
OP-NI
114.6±3.4a
162.4±4.8a
32.6±0.4a
309.6±8.3a
280.1±8.3a
4.2±0.1b
OP-SRF
112.7±2.0a
159.7±2.9a
35.0±0.3a
307.3±5.2a
278.4±5.2a
4.2±0.1b
Mean
112.0
158.7
33.8
304.5
272.9
4.6
Two-year average
CP
109.7±2.1a
155.5±2.9a
33.0±0.6a
298.2±5.6a
259.4±5.6a
5.8±0.1a
OP
110.8±2.9a
157.0±4.2a
34.6±0.5a
302.4±7.6a
273.5±7.6a
4.3±0.1b
OP-NI
113.1±2.5a
160.3±3.5a
34.0±0.4a
307.4±6.3a
277.9±6.3a
4.3±0.1b
OP-SRF
113.3±2.2a
160.5±3.2a
35.0±0.4a
308.8±5.7a
279.9±5.7a
4.2±0.1b
Mean
111.7
158.3
34.1
304.2
272.7
4.6
Table 6 Energy output and energy efficiency for spring wheat production under different treatments during 2021-2022
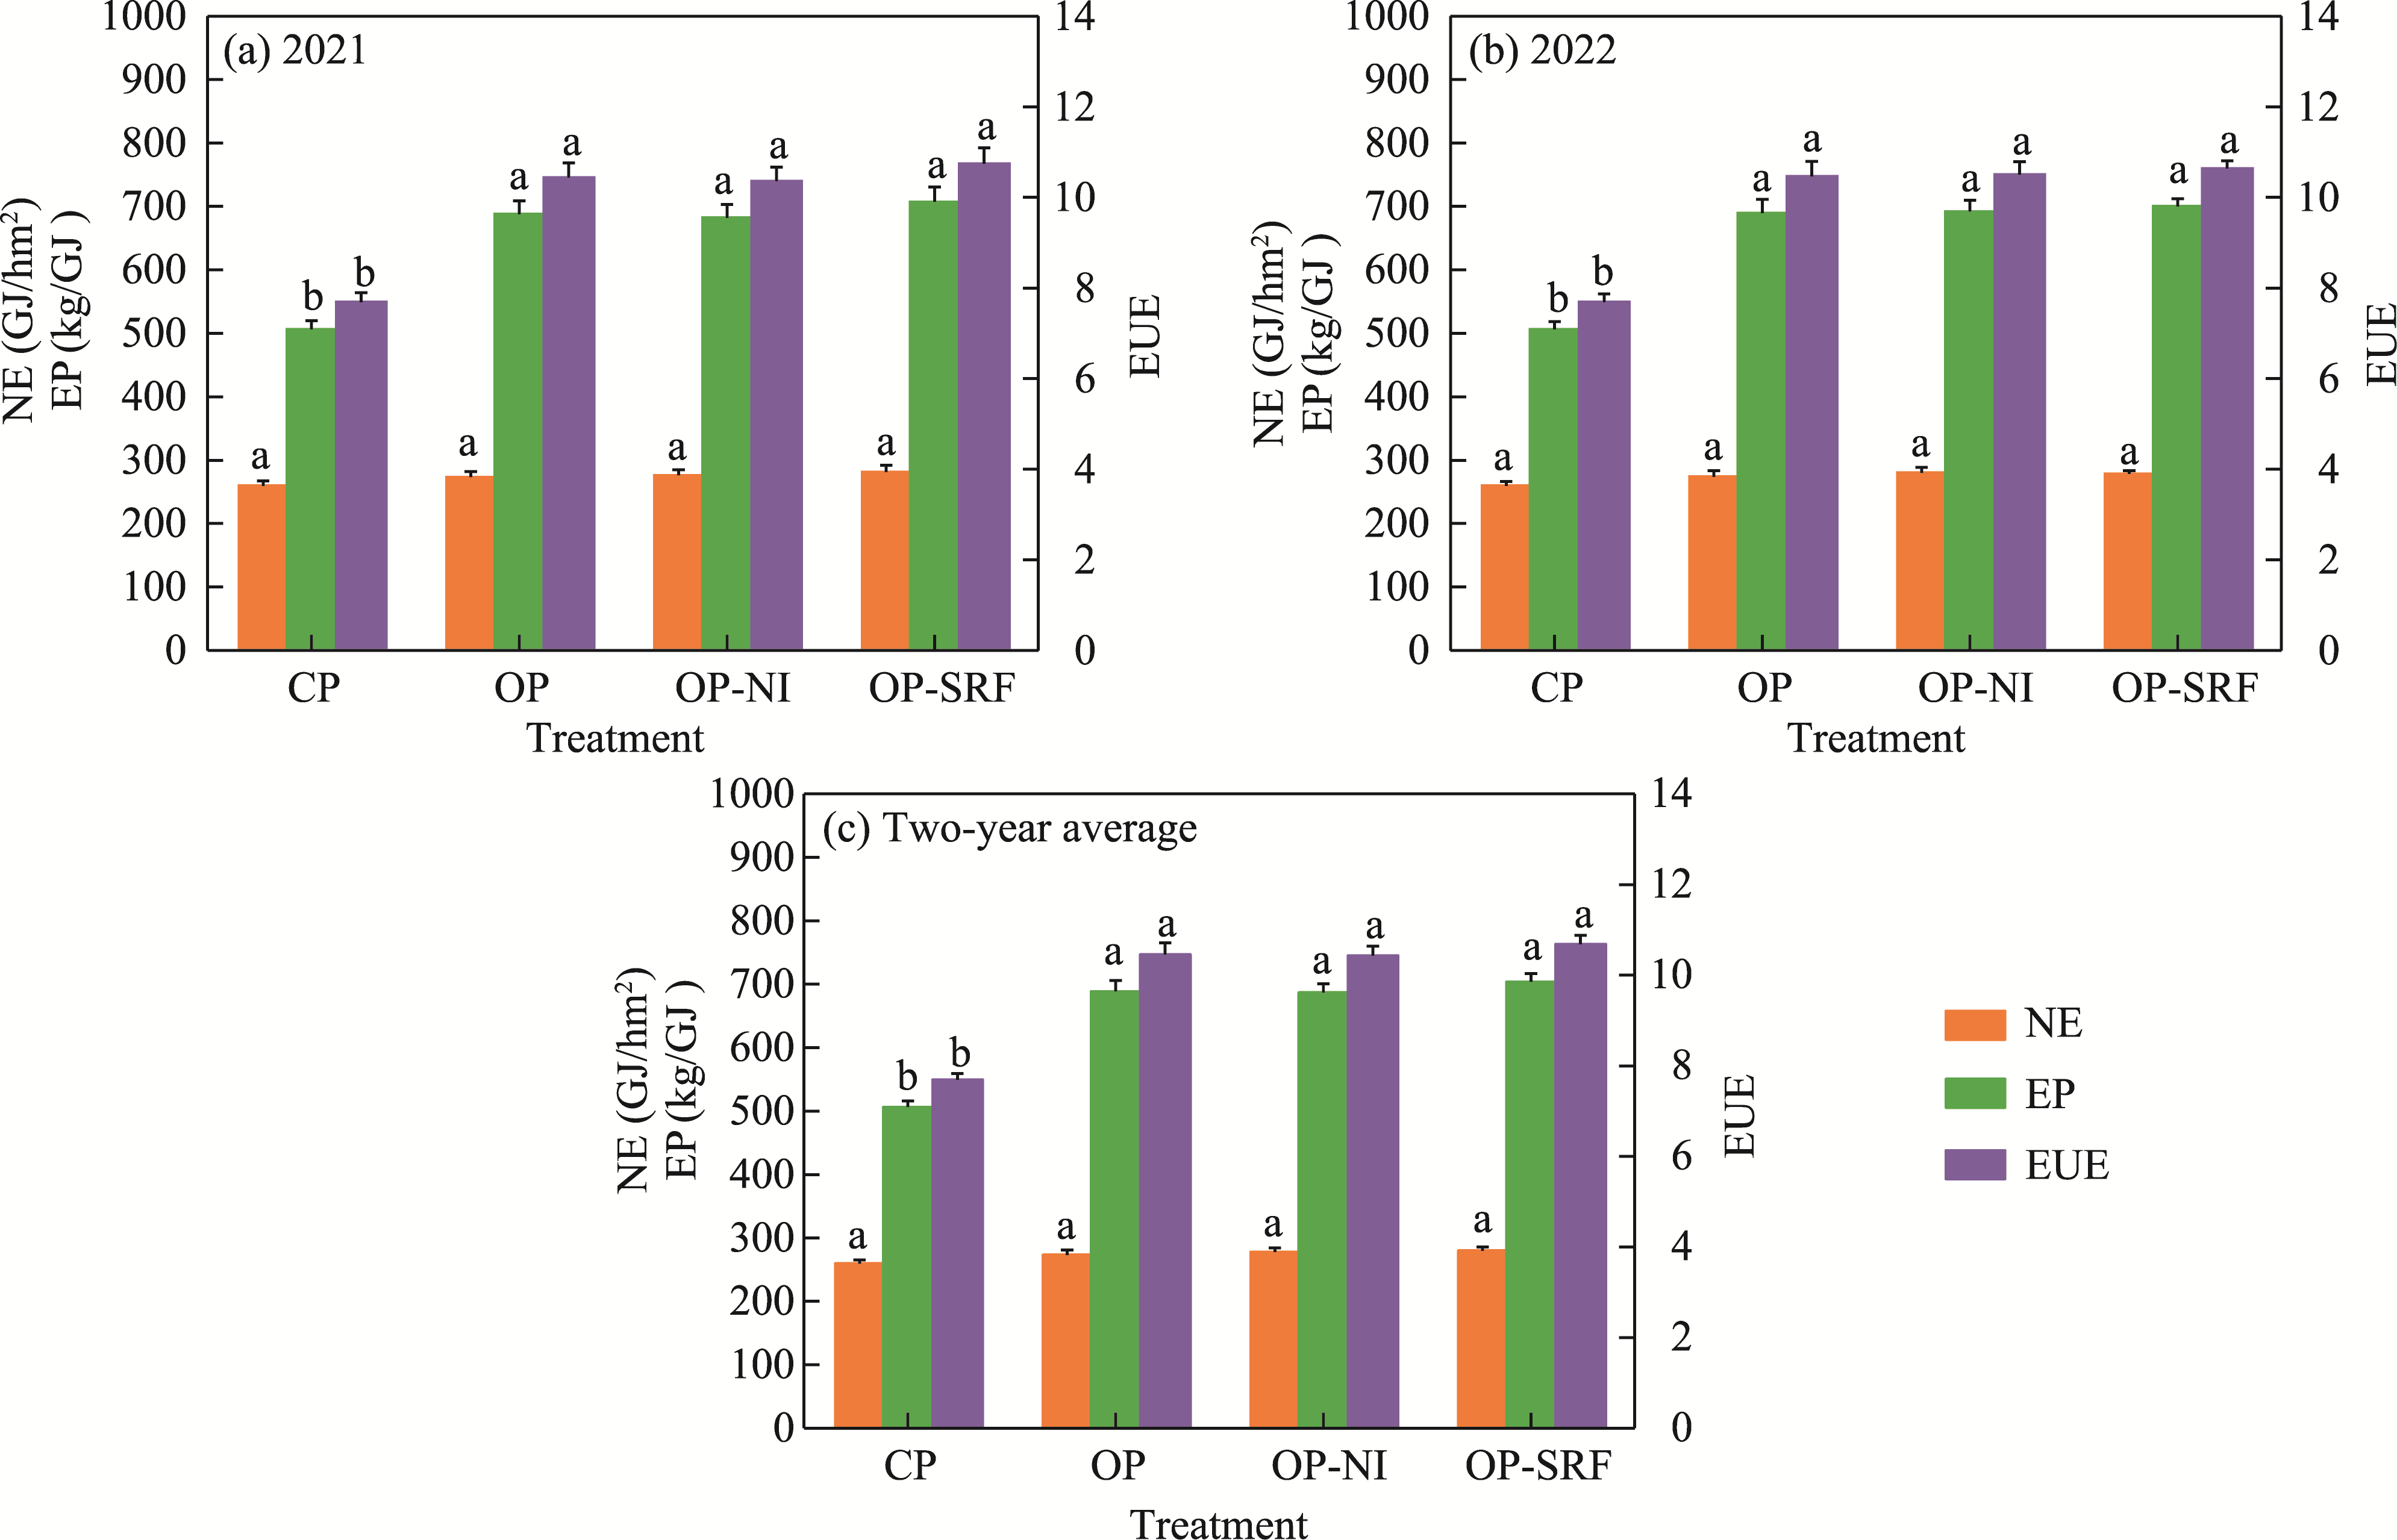
Fig. 7Effects of different treatments on net energy gain (NE), energy productivity (EP), and energy use efficiency (EUE) in spring-wheat cropping system for 2021 (a), 2022 (b), and the two-year average (c). Bars are standard errors. Different lowercase letters indicate significant differences among treatments (LSD test, P<0.050).
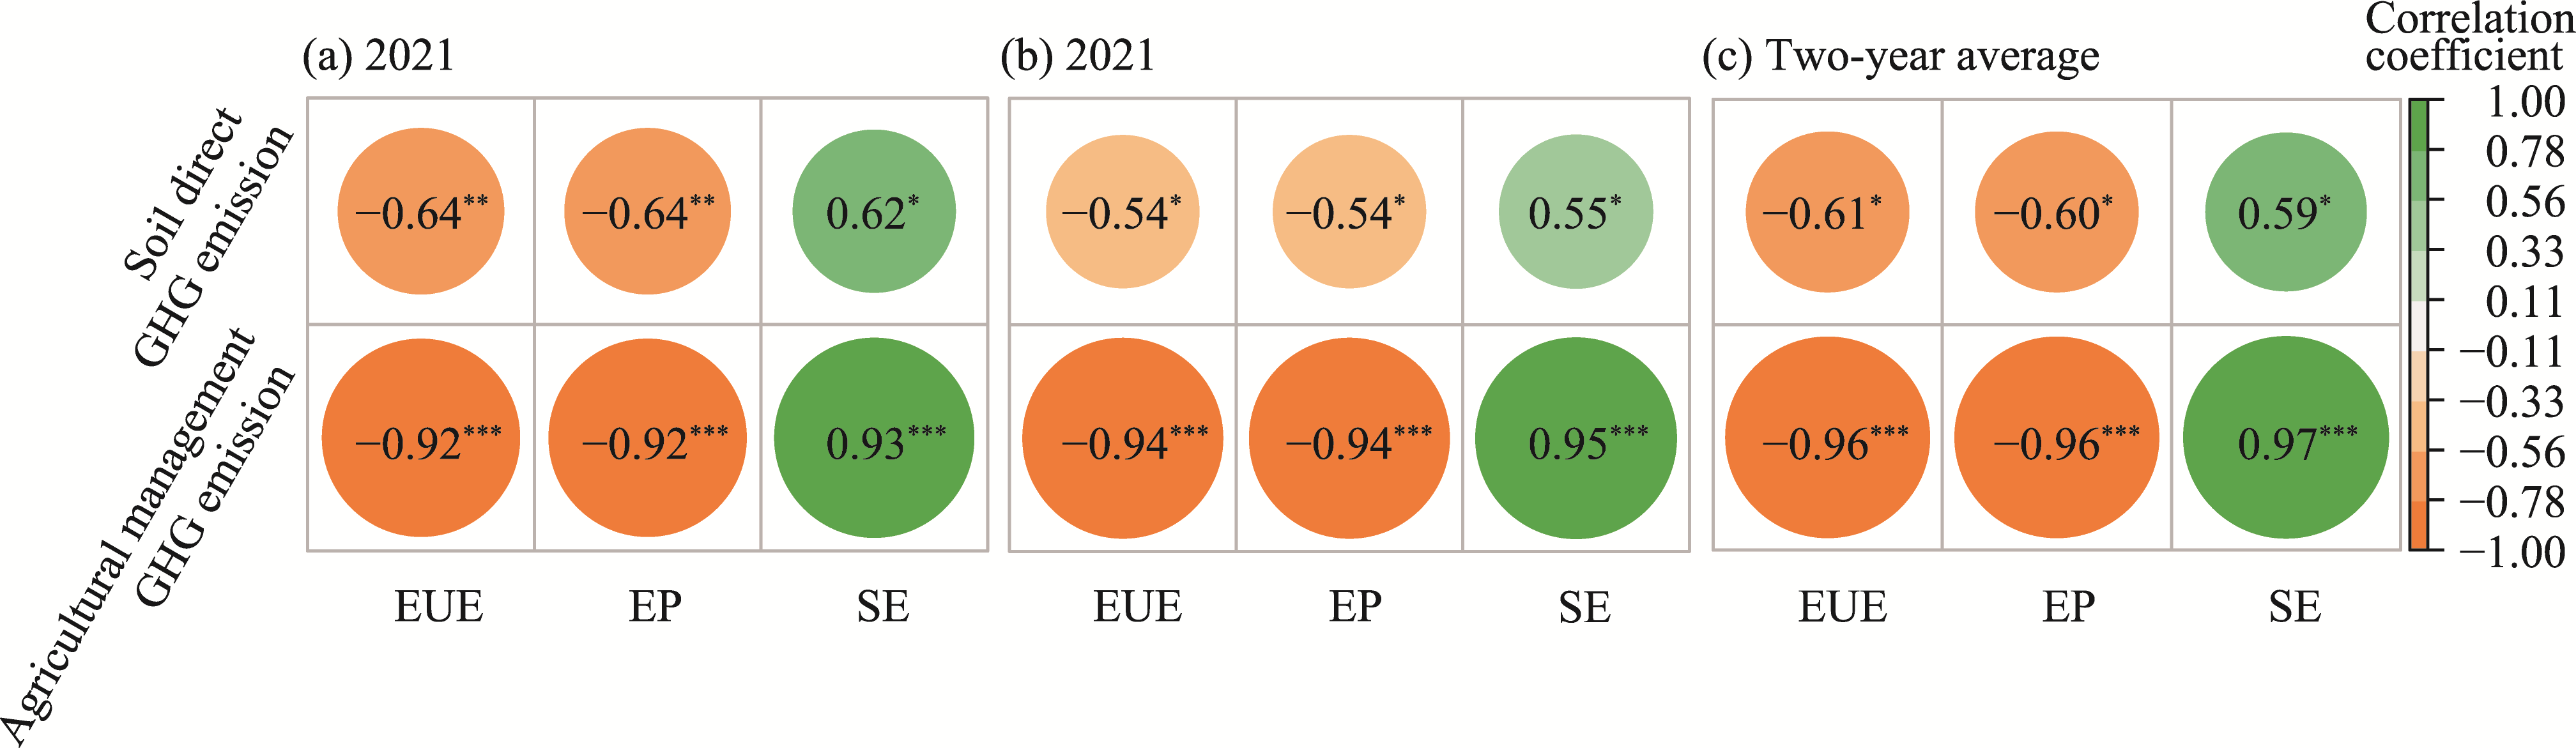
Fig. 8Correlation analysis between energy efficiency indicators (EUE, EP, and specific energy (SE)) and GHG emissions for 2021 (a), 2022 (b), and the two-year average (c). *, P<0.050 level; **, P<0.010 level; ***, P<0.001 level.
Year
Treatment
Grain revenue (CNY/hm2)
Agricultural inputs (CNY/hm2)
Net revenue (CNY/hm2)
Benefit-cost ratio
Carbon cost (CNY/hm2)
NEEB (CNY/hm2)
2021
CP
16,155.7±429.5a
6947.3
9208.4±429.5a
1.3±0.06a
154.4±27.0a
9054.1±422.4a
OP
16,305.8±520.5a
6413.3
9892.5±520.5a
1.5±0.08a
-21.4±11.1ab
9913.8±529.0a
OP-NI
16,440.8±520.2a
6604.5
9836.3±520.2a
1.5±0.08a
-112.4±37.7b
9948.6±545.6a
OP-SRF
16,770.8±582.0a
8251.6
8519.2±582.0a
1.0±0.07b
-161.5±41.1b
8680.7±620.5a
2022
CP
16,156.5±391.0a
6947.3
9209.2±391.0ab
1.3±0.06b
71.9±29.7a
9137.3±419.8ab
OP
16,322.3±543.9a
6413.3
9909.0±543.9a
1.5±0.08a
-108.8±36.7ab
10,017.7±572.7ab
OP-NI
16,870.5±497.2a
6604.5
10,266.0±497.2a
1.5±0.07a
-188.4±25.0b
10,454.4±499.7a
OP-SRF
16,590.0±298.2a
8251.6
8338.4±298.2b
1.0±0.04c
-217.3±25.0b
8555.7±318.3b
Two-year average
CP
16,156.1±305.2a
6947.3
9208.8±305.2ab
1.3±0.04b
113.1±24.4a
9095.7±328.4ab
OP
16,314.0±433.9a
6413.3
9900.7±433.9a
1.5±0.07a
-65.1±26.8ab
9965.8±456.4a
OP-NI
16,655.6±369.1a
6604.5
10,051.1±369.1a
1.5±0.06a
-150.4±28.0b
10,201.5±375.4a
OP-SRF
16,680.4±327.5a
8251.6
8428.8±327.5b
1.0±0.04c
-189.4±30.0b
8618.2±356.3b
Table 7 Net ecosystem economic benefit (NEEB) for spring wheat production during 2021-2022
Item
Energy equivalent coefficient
Item
Energy equivalent coefficient
Inputs
Potash fertilizer (kg/hm2)
6.70 MJ/kg
Labor (d/hm2)
1.96 MJ/d
Pesticide (kg/hm2)
184.63 MJ/kg
Farm machinery (d/hm2)
62.70 MJ/d
Wheat seed (kg/hm2)
14.70 MJ/kg
Diesel (L/hm2)
56.31 MJ/L
Outputs
Irrigation electricity (kWh/hm2)
11.93 MJ/kWh
Wheat grain (kg/hm2)
16.30 MJ/kg
Irrigation water (m3/hm2)
1.02 MJ/m3
Wheat straw (kg/hm2)
14.60 MJ/kg
Nitrogenous fertilizer (kg/hm2)
60.60 MJ/kg
Wheat root (kg/hm2)
14.60 MJ/kg
Phosphate fertilizer (kg/hm2)
11.10 MJ/kg
Table S1 Energy equivalent coefficients of agricultural production inputs and outputs
Item
Economic input per unit
Economic input (CNY/hm2)
CP
OP
OP-NI
OP-SRF
Nitrogenous fertilizer
2.95 CNY/kg
826.0
531.0
557.5
-
NI
18.00 CNY/kg
-
-
180.0
-
SRF
14.00 CNY/kg
-
-
-
2520.0
Phosphate fertilizer
4.40 CNY/kg
321.2
396.0
396.0
396.0
Potash fertilizer
3.15 CNY/kg
-
110.5
110.5
110.5
Irrigation electricity
0.19 CNY/kWh
158.5
102.9
102.9
102.9
Diesel
7.57 CNY/kg
2077.2
2077.2
2077.2
2077.2
Labor
80.00 CNY/d
1069.9
890.2
901.4
739.5
Machinery
150.00 CNY/h
225.0
225.0
225.0
225.0
Irrigation water
0.18 CNY/m3
837.0
648.0
648.0
648.0
Pesticide
60.00 CNY/kg
232.5
232.5
232.5
232.5
Wheat seed
4.00 CNY/kg
1200.0
1200.0
1200.0
1200.0
Total
6947.3
6413.3
6604.5
8251.6
Table S2 Economic inputs from spring wheat cropping systems under different water and fertilizer treatments
Year
Treatment
Direct GHG emissions from soil (kg CO2-eq/hm2)
GHG emissions from agricultural management (kg CO2-eq/hm2)
Table S3 Detailed carbon footprint components under different treatments during 2021-2022
Year
Treatment
CF (kg CO2-eq/hm2)
CFGY (kg CO2-eq/kg)
CFEY (kg CO2-eq/GJ)
CFNR (kg CO2-eq/CNY)
2021
CP
1488.6±259.4a
0.23±0.04a
5.77±1.07a
0.17±0.03a
OP
-211.3±108.7ab
-0.02±0.01ab
-0.49±0.32ab
-0.01±0.00ab
OP-NI
-1081.1±356.8b
-0.15±0.05b
-3.80±1.34b
-0.10±0.04b
OP-SRF
-1561.2±397.5b
-0.21±0.05b
-5.38±1.36b
-0.17±0.04b
2022
CP
692.3±291.1a
0.11±0.04a
2.77±1.10a
0.08±0.03a
OP
-1048.4±351.5ab
-0.15±0.05b
-3.69±1.25b
-0.10±0.03b
OP-NI
-1818.5±238.6b
-0.26±0.03b
-6.49±0.83b
-0.17±0.02b
OP-SRF
-2101.8±198.9b
-0.30±0.03b
-7.62±0.80b
-0.25±0.02b
Two-year average
CP
1090.9±238.5a
0.17±0.03a
4.22±0.93a
0.12±0.03a
OP
-628.7±261.4ab
-0.09±0.04b
-2.16±1.25ab
-0.06±0.03b
OP-NI
-1451.6±268.1b
-0.21±0.03b
-5.23±0.96b
-0.14±0.02b
OP-SRF
-1826.5±291.5b
-0.26±0.04b
-6.56±0.99b
-0.21±0.03b
Table S4 Carbon footprint from multiple perspectives under different treatments during 2021-2022
Treatment
N input (kg N/hm2)
Crop N uptake (kg N/hm2)
Initial inorganic N pool (kg N/hm2)
Final inorganic N pool (kg N/hm2)
Change in inorganic N pool (kg N/hm2)
Apparent N loss (kg N/hm2)
Apparent N loss rate (%)
CP
280
125.2±5.9a
18.7±3.6a
25.9±4.6a
+7.2±5.8a
147.6±8.3a
52.7±3.0a
OP
180
123.6±4.8a
18.7±3.6a
16.5±3.8c
-2.2±5.2c
58.6±7.1b
32.6±3.2b
OP-NI
189
128.2±5.0a
18.7±3.6a
20.3±3.5b
+1.6±5.0b
50.2±7.1c
27.9±3.9c
OP-SRF
180
128.8±4.6a
18.7±3.6a
21.1±3.5b
+2.4±5.0b
48.8±6.8c
27.1±3.8c
Table S5 Key indicators of soil nitrogen (N) balance in the 0-20 cm soil layer under different treatments during 2021-2022
Treatment
Crop yield
CF
NF
EUE
NEEB
Total score
CP
-1.72
-4.60
-6.69
-6.41
-1.50
-20.92
OP
-0.80
0.19
2.47
1.93
1.99
5.78
OP-NI
1.19
1.91
1.72
1.86
2.94
9.62
OP-SRF
1.33
2.88
2.50
2.63
-3.42
5.92
Table S6 Z index scores of different indicators under different water and fertilizer treatments
[1]
Ali S A, Tedone L, De Mastro G. 2013. A comparison of the energy consumption of rainfed durum wheat under different management scenarios in southern Italy. Energy, 61: 308-318.
[2]
Badr M A, El-Tohamy W A, Zaghloul A M. 2012. Yield and water use efficiency of potato grown under different irrigation and nitrogen levels in an arid region. Agricultural Water Management, 110: 9-15.
[3]
Bolinder M A, Janzen H H, Gregorich E G, et al. 2007. An approach for estimating net primary productivity and annual carbon inputs to soil for common agricultural crops in Canada. Agriculture, Ecosystems & Environment, 118(1-4): 29-42.
[4]
Chaudhary V P, Singh K K, Pratibha G, et al. 2017. Energy conservation and greenhouse gas mitigation under different production systems in rice cultivation. Energy, 130: 307-317.
[5]
Chen J, Wang P, Ma Z M, et al. 2018. Optimum water and nitrogen supply regulates root distribution and produces high grain yields in spring wheat (Triticum aestivum L.) under permanent raised bed tillage in arid northwest China. Soil and Tillage Research, 181: 117-126.
[6]
Chilundo M, Joel A, Wesström I, et al. 2017. Response of maize root growth to irrigation and nitrogen management strategies in semi-arid loamy sandy soil. Field Crops Research, 200: 143-162.
[7]
Cui Y, Khan S U, Sauer J, et al. 2022. Exploring the spatiotemporal heterogeneity and influencing factors of agricultural carbon footprint and carbon footprint intensity: Embodying carbon sink effect. Science of The Total Environment, 846: 157507, doi: 10.1016/j.scitotenv.2022.157507.
[8]
Dell C J, Han K, Bryant R B, et al. 2014. Nitrous oxide emissions with enhanced efficiency nitrogen fertilizers in a rainfed system. Agronomy Journal, 106(2): 723-731.
[9]
Ding W H, Zhang G L, Yi X P, et al. 2023. Improving potential of reactive nitrogen and carbon footprint of intensified greenhouse cucumber-tomato production with optimized drip irrigation with nitrogen reduction strategies. Journal of Cleaner Production, 424: 138898, doi: 10.1016/j.jclepro.2023.138898.
[10]
Du X B, He W C, Gao S Q, et al. 2022. Raised bed planting increases economic efficiency and energy use efficiency while reducing the environmental footprint for wheat after rice production. Energy, 245: 123256, doi: 10.1016/j.energy.2022.123256.
[11]
Du X B, Xi M, Kong L C, et al. 2023. Energy budgeting and carbon footprint of different wheat-rice cropping systems in China. Science of The Total Environment, 879: 163102, doi: 10.1016/j.scitotenv.2023.163102.
[12]
Feng J Y, Zhang H, Zhang H Y, et al. 2025. Optimization of fertilization combined with water-saving irrigation improves the water and nitrogen utilization efficiency of wheat and reduces nitrogen loss in the Nansi Lake Basin, China. Journal of Integrative Agriculture, 24(10): 4034-4047.
[13]
Feng X M, Sun T, Guo J R, et al. 2023. Climate-smart agriculture practice promotes sustainable maize production in northeastern China: Higher grain yield while less carbon footprint. Field Crops Research, 302: 109108, doi: 10.1016/j.fcr.2023.109108.
[14]
Gao Y X, Shao Y Q, Wang J Q, et al. 2024. Effects of straw returning combined with blended controlled-release urea fertilizer on crop yields, greenhouse gas emissions, and net ecosystem economic benefits: A nine-year field trial. Journal of Environmental Management, 356: 120633.
[15]
Ghafoor I, Habib-ur-Rahman M, Ali M, et al. 2021. Slow-release nitrogen fertilizers enhance growth, yield, NUE in wheat crop and reduce nitrogen losses under an arid environment. Environmental Science and Pollution Research, 28: 43528-43543.
[16]
Gou Z W, Yin W, Asibi A E, et al. 2022. Improving the sustainability of cropping systems via diversified planting in arid irrigation areas. Agronomy for Sustainable Development, 42(5): 88, doi: 10.1007/s13593-022-00823-2.
[17]
Hassan M U, Huang G Q, Arif M S, et al. 2024. Can urea-coated fertilizers be an effective means of reducing greenhouse gas emissions and improving crop productivity? Journal of Environmental Management, 367: 121927, doi: 10.1016/j.jenvman.2024.121927.
[18]
He C, Wang Y Q, Yu W B, et al. 2022. Comprehensive analysis of resource utilization efficiency under different tillage systems in North China Plain. Journal of Cleaner Production, 347: 131289, doi: 10.1016/j.jclepro.2022.131289.
[19]
Hu J, Gettel G, Fan Z B, et al. 2021. Drip fertigation promotes water and nitrogen use efficiency and yield stability through improved root growth for tomatoes in plastic greenhouse production. Agriculture, Ecosystems & Environment, 313: 107379, doi: 10.1016/j.agee.2021.107379.
[20]
Huang S H, Ding W C, Jia L L, et al. 2021. Cutting environmental footprints of maize systems in China through Nutrient Expert management. Journal of Environmental Management, 282: 111956, doi: 10.1016/j.jenvman.2021.111956.
[21]
IPCC (Intergovernmental Panel on Climate Change). 2007. Climate Change 2007: The Physical Science Basis. Cambridge: Cambridge University Press.
[22]
IPCC. 2019. Climate Change and Land:an IPCC special report on climate change, desertification, land degradation, sustainable land management, food security, and greenhouse gas fluxes in terrestrial ecosystems. Cambridge: Cambridge University Press.
[23]
Jat S L, Parihar C M, Singh A K, et al. 2019. Energy auditing and carbon footprint under long-term conservation agriculture-based intensive maize systems with diverse inorganic nitrogen management options. Science of The Total Environment, 664: 659-668.
[24]
Jin Z Q, Zhang L, Liu H Y, et al. 2021. Energy assessment of different rice-wheat rotation systems. Food and Energy Security, 10(2): 394-405.
[25]
Ju X T, Christie P. 2011. Calculation of theoretical nitrogen rate for simple nitrogen recommendations in intensive cropping systems: A case study on the North China Plain. Field Crops Research, 124(3): 450-458.
[26]
Ju X T, Zhang C. 2021. The principles and indicators of rational N fertilization. Acta Pedologica Sinica, 58(1): 1-13. (in Chinese)
[27]
Kamran M, Yan Z G, Ahmad I, et al. 2023. Assessment of greenhouse gases emissions, global warming potential and net ecosystem economic benefits from wheat field with reduced irrigation and nitrogen management in an arid region of China. Agriculture, Ecosystems & Environment, 341: 108197, doi: 10.1016/j.agee.2022.108197.
[28]
Kumar A, Rana K S, Choudhary A K, et al. 2021. Energy budgeting and carbon footprints of zero-tilled pigeonpea-wheat cropping system under sole or dual crop basis residue mulching and Zn-fertilization in a semi-arid agro-ecology. Energy, 231: 120862, doi: 10.1016/j.energy.2021.120862.
[29]
Kumar R, Bordoloi N. 2024. Role of slow-release fertilizers and nitrification inhibitors in greenhouse gas nitrous oxide (N2O) emission reduction from rice-wheat agroecosystem. In: BordoloiN, BauddhK, Baruah KK. Agricultural Greenhouse Gas Emissions:Problems and Solutions. Singapore: Springer, 245-259.
[30]
Li B, Fan C H, Zhang H, et al. 2015. Combined effects of nitrogen fertilization and biochar on the net global warming potential, greenhouse gas intensity and net ecosystem economic budget in intensive vegetable agriculture in southeastern China. Atmospheric Environment, 100: 10-19.
[31]
Li C L, Shi Y, Yu Z W, et al. 2025a. Reducing nitrogen application under water saving irrigation reduces greenhouse gas emissions by regulating the population of functional microorganisms, compatible with improving the wheat yield in the North China Plain. Plant and Soil, 514: 1007-1025.
[32]
Li J L, Li Y E, Wan Y F, et al. 2018. Combination of modified nitrogen fertilizers and water saving irrigation can reduce greenhouse gas emissions and increase rice yield. Geoderma, 315: 1-10.
[33]
Li P F, Zhang A F, Liu H L, et al. 2025b. Managing trade-offs among yield, carbon, and nitrogen footprints of wheat-maize cropping system under straw mulching and N fertilizer application in China's Loess Plateau. Field Crops Research, 325: 109821, doi: 10.1016/j.fcr.2025.109821.
[34]
Liu C, Cutforth H, Chai Q, et al. 2016. Farming tactics to reduce the carbon footprint of crop cultivation in semiarid areas. A review. Agronomy for Sustainable Development, 36: 69, doi: 10.1007/s13593-016-0404-8.
[35]
Liu X H, Xu W X, Li Z J, et al. 2013. The missteps, improvement and application of carbon footprint methodology in farmland ecosystems with the case study of analyzing the carbon efficiency of China's intensive farming. Journal of China Agricultural Resources and Regional Planning, 34(6): 1-11. (in Chinese)
[36]
Luo X Q, Guo Y T, Wang R, et al. 2021. Carbon footprint of a winter wheat-summer maize cropping system under straw and plastic film mulching in the Loess Plateau of China. Science of The Total Environment, 794: 148590, doi: 10.1016/j.scitotenv.2021.148590.
[37]
Ma Q, Wang M Y, Zheng G L, et al. 2021. Twice-split application of controlled-release nitrogen fertilizer met the nitrogen demand of winter wheat. Field Crops Research, 267: 108163, doi: 10.1016/j.fcr.2021.108163.
[38]
Mateo-Marín N, Quílez D, Guillén M, et al. 2020. Feasibility of stabilised nitrogen fertilisers decreasing greenhouse gas emissions under optimal management in sprinkler irrigated conditions. Agriculture, Ecosystems & Environment, 290: 106725, doi: 10.1016/j.agee.2019.106725.
[39]
Mikula K, Izydorczyk G, Skrzypczak D, et al. 2020. Controlled release micronutrient fertilizers for precision agriculture-A review. Science of The Total Environment, 712: 136365, doi: 10.1016/j.scitotenv.2019.136365.
[40]
Monaghan R M, Smith L C, De Klein C A M. 2013. The effectiveness of the nitrification inhibitor dicyandiamide (DCD) in reducing nitrate leaching and nitrous oxide emissions from a grazed winter forage crop in southern New Zealand. Agriculture, Ecosystems & Environment, 175: 29-38.
[41]
Ning J, He X Z, Hou F J, et al. 2020. Optimizing alfalfa productivity and persistence versus greenhouse gases fluxes in a continental arid region. PeerJ, 8: e8738, doi: 10.7717/peerj.8738.
[42]
Nisar S, Benbi D K, Toor A S. 2021. Energy budgeting and carbon footprints of three tillage systems in maize-wheat sequence of north-western Indo-Gangetic Plains. Energy, 229: 120661, doi: 10.1016/j.energy.2021.120661.
[43]
Parihar C M, Jat S L, Singh A K, et al. 2018. Energy auditing of long-term conservation agriculture based irrigated intensive maize systems in semi-arid tropics of India. Energy, 142: 289-302.
[44]
Qin J X, Duan W L, Zou S, et al. 2024. Global energy use and carbon emissions from irrigated agriculture. Nature Communications, 15(1): 3084, doi: 10.1038/s41467-024-47383-5.
[45]
Qiu Y P, Zhang Y, Zhang K C, et al. 2024. Intermediate soil acidification induces highest nitrous oxide emissions. Nature Communications, 15(1): 2695, doi: 10.1038/s41467-024-46931-3.
[46]
Rajanna G A, Dass A, Singh V K, et al. 2023. Energy and carbon budgeting in a soybean-wheat system in different tillage, irrigation and fertilizer management practices in South-Asian semi-arid agroecology. European Journal of Agronomy, 148: 126877, doi: 10.1016/j.eja.2023.126877.
[47]
Shao G D, Zhou J, Liu B C, et al. 2024. Carbon footprint of maize-wheat cropping system after 40-year fertilization. Science of The Total Environment, 926: 172082, doi: 10.1016/j.scitotenv.2024.172082.
[48]
Smith P, Bustamante M, Ahammad H, et al. 2014. Agriculture, forestry and other land use (AFOLU). In: EdenhoferO, Pichs-MadrugaR, SokonaY, et al. Climate Change 2014:Mitigation of Climate Change. New York: Cambridge University Press, 811-922.
[49]
Song J R, Jiao Y, Wu W Q, et al. 2025. Legume straw incorporation with optimal nitrogen fertilizer improves soil quality and reduces the carbon footprint of farmland ecosystems in semiarid areas. Industrial Crops and Products, 230: 121081, doi: 10.1016/j.indcrop.2025.121081.
[50]
Sun J, Wang Z, Du Y D, et al. 2022. Optimized tillage improves yield and energy efficiency while reducing carbon footprint in winter wheat-summer maize rotation systems. Science of The Total Environment, 820: 153278, doi: 10.1016/j.scitotenv.2022.153278.
[51]
Sun T, Zhao C, Feng X M, et al. 2021. Maize‐based intercropping systems achieve higher productivity and profitability with lesser environmental footprint in a water‐scarce region of northwest China. Food and Energy Security, 10(1): e260, doi: 10.1002/fes3.260.
[52]
Tuti M D, Prakash V, Pandey B M, et al. 2012. Energy budgeting of colocasia-based cropping systems in the Indian sub-Himalayas. Energy, 45(1): 986-993.
[53]
Wang Q, Hu H W, Shen J P, et al. 2017. Effects of the nitrification inhibitor dicyandiamide (DCD) on N2Oemissions and the abundance of nitrifiers and denitrifiers in two contrasting agricultural soils. Journal of Soils and Sediments, 17(6): 1635-1643.
[54]
Wang X, Xiang Y Z, Guo J J, et al. 2023. Coupling effect analysis of drip irrigation and mixed slow-release nitrogen fertilizer on yield and physiological characteristics of winter wheat in Guanzhong area. Field Crops Research, 302: 109103, doi: 10.1016/j.fcr.2023.109103.
[55]
West T O, Marland G. 2002. A synthesis of carbon sequestration, carbon emissions, and net carbon flux in agriculture: comparing tillage practices in the United States. Agriculture, Ecosystems & Environment, 91(1-3): 217-232.
[56]
Xiao C, Zhang F C, Li Y, et al. 2024. Optimizing drip irrigation and nitrogen fertilization regimes to reduce greenhouse gas emissions, increase net ecosystem carbon budget and reduce carbon footprint in saline cotton fields. Agriculture, Ecosystems & Environment, 366: 108912, doi: 10.1016/j.agee.2024.108912.
[57]
Xing S L, Wang J X, Yang J F, et al. 2025. Effects of fertilizer management on wheat yield, carbon and nitrogen footprint under drip irrigation. Transactions of the Chinese Society of Agricultural Engineering, 41(2): 103-111.
[58]
Xu C C, Chen Z D, Ji L, et al. 2022. Carbon and nitrogen footprints of major cereal crop production in China: A study based on farm management surveys. Rice Science, 29(3): 288-298.
[59]
Xu Q, Hu K L, Liang H, et al. 2020. Incorporating the WHCNS model to assess water and nitrogen footprint of alternative cropping systems for grain production in the North China Plain. Journal of Cleaner Production, 263: 121548, doi: 10.1016/j.jclepro.2020.121548.
[60]
Xu X P, He P, Wei J L, et al. 2021. Use of controlled-release urea to improve yield, nitrogen utilization, and economic return and reduce nitrogen loss in wheat-maize crop rotations. Agronomy, 11(4): 723, doi: 10.3390/agronomy11040723.
[61]
Yadav G S, Babu S, Das A, et al. 2020. No-till and mulching enhance energy use efficiency and reduce carbon footprint of a direct-seeded upland rice production system. Journal of Cleaner Production, 271: 122700, doi: 10.1016/j.jclepro.2020.122700.
[62]
Yan S C, Wu Y, Fan J L, et al. 2020. Dynamic change and accumulation of grain macronutrient (N, P and K) concentrations in winter wheat under different drip fertigation regimes. Field Crops Research, 250: 107767, doi: 10.1016/j.fcr.2020.107767.
[63]
Yang S L, Shahzad A, Wang M, et al. 2024. Urease and nitrification inhibitors with drip fertigation strategies to mitigate global warming potential and improve water-nitrogen efficiency of maize under semi-arid regions. Agricultural Water Management, 295: 108750, doi: 10.1016/j.agwat.2024.108750.
[64]
Yang Y H, Zou J, Huang W H, et al. 2022. Farm-scale practical strategies to increase nitrogen use efficiency and reduce nitrogen footprint in crop production across the North China Plain. Field Crops Research, 283: 108526, doi: 10.1016/j.fcr.2022.108526.
[65]
Yin W, Chai Q, Fan Z L, et al. 2022. Energy budgeting, carbon budgeting, and carbon footprints of straw and plastic film management for environmentally clean of wheat-maize intercropping system in northwestern China. Science of The Total Environment, 826: 154220, doi: 10.1016/j.scitotenv.2022.154220.
[66]
Yuan S, Peng S B, Wang D, et al. 2018. Evaluation of the energy budget and energy use efficiency in wheat production under various crop management practices in China. Energy, 160: 184-191.
[67]
Zhang L, Liang Z Y, Hu Y C, et al. 2021a. Integrated assessment of agronomic, environmental and ecosystem economic benefits of blending use of controlled-release and common urea in wheat production. Journal of Cleaner Production, 287: 125572, doi: 10.1016/j.jclepro.2020.125572.
[68]
Zhang W F, Dou Z X, He P, et al. 2013. New technologies reduce greenhouse gas emissions from nitrogenous fertilizer in China. Proceedings of the National Academy of Sciences, 110(21): 8375-8380.
[69]
Zhang X F, Cui X W, Liang S M. 2024. Evolution and optimization of an ecological network in an arid region based on MSPA-MCR: A case study of the Hexi Corridor. Sustainability, 16(4): 1704, doi: 10.3390/su16041704.
[70]
Zhang X Q, Pu C, Zhao X, et al. 2016. Tillage effects on carbon footprint and ecosystem services of climate regulation in a winter wheat-summer maize cropping system of the North China Plain. Ecological indicators, 67: 821-829.
[71]
Zhang Z, Yu Z W, Zhang Y L, et al. 2022. Impacts of fertilization optimization on soil nitrogen cycling and wheat nitrogen utilization under water-saving irrigation. Frontiers in Plant Science, 13: 878424, doi: 10.3389/fpls.2022.878424.
[72]
Zhang Z G, An J, Han Y C, et al. 2021b. Advantages of an Orychophragmus violaceus-maize rotation in reducing greenhouse gas emissions and reactive nitrogen losses and increasing net ecosystem economic benefits on the North China Plain. Journal of Cleaner Production, 317: 128426, doi: 10.1016/j.jclepro.2021.128426.
[73]
Zhao G C, Chang X H, Wang D M, et al. 2018. General situation and development of wheat production. Crops, 34(4): 1-7. (in Chinese)
[74]
Zhao W Z, Ren H, Du J, et al. 2023. Thoughts and suggestions on oasis ecological construction and agricultural development in Hexi Corridor. Bulletin of Chinese Academy of Sciences (Chinese Version), 38(3): 424-434. (in Chinese)
[75]
Zhao Y, Wang Q M, Jiang S, et al. 2020. Irrigation water and energy saving in well irrigation district from a water-energy nexus perspective. Journal of Cleaner Production, 267: 122058, doi: 10.1016/j.jclepro.2020.122058.
[76]
Zhao Y X, Wang L, Lei X Y, et al. 2021. Reducing carbon footprint without compromising grain security through relaxing cropping rotation system in the North China Plain. Journal of Cleaner Production, 318: 128465, doi: 10.1016/j.jclepro.2021.128465.
[77]
Zhou J, Li B, Xia L L, et al. 2019. Organic-substitute strategies reduced carbon and reactive nitrogen footprints and gained net ecosystem economic benefit for intensive vegetable production. Journal of Cleaner Production, 225: 984-994.
[78]
Zhou X, Wang S W, Ma S T, et al. 2020. Effects of commonly used nitrification inhibitors-dicyandiamide (DCD), 3, 4-dimethylpyrazole phosphate (DMPP), and nitrapyrin-on soil nitrogen dynamics and nitrifiers in three typical paddy soils. Geoderma, 380: 114637, doi: 10.1016/j.geoderma.2020.114637.
[79]
Zou H Y, Fan J L, Zhang F C, et al. 2020. Optimization of drip irrigation and fertilization regimes for high grain yield, crop water productivity and economic benefits of spring maize in Northwest China. Agricultural Water Management, 230: 105986, doi: 10.1016/j.agwat.2019.105986.