| Research article |
|

|
|
|
| Asymmetric glacier sensitivity to the Last Glacial Maximum paleoclimate in the monsoon-westerlies transition zone, southern Xizang Plateau, China |
YU Yue1, LIU Chang2, LIU Liang1,*( ), Jonathan M HARBOR3, HAN Shuting1, ZHANG Hongjie4, WU Yuhua5 |
1 School of Geography, Liaoning Normal University, Dalian 116029, China
2 Key Laboratory of Western China's Environmental Systems (Ministry of Education), College of Earth and Environmental Sciences, Lanzhou University, Lanzhou 730000, China
3 Department of Earth, Atmospheric, and Planetary Sciences, Purdue University, West Lafayette 47907, USA
4 College of Tourism and Resource Environment, Zaozhuang University, Zaozhuang 277160, China
5 Shen Kan Engineering & Technology Corporation, Metallurgical Corporation of China (MCC), Shenyang 110169, China |
|
|
|
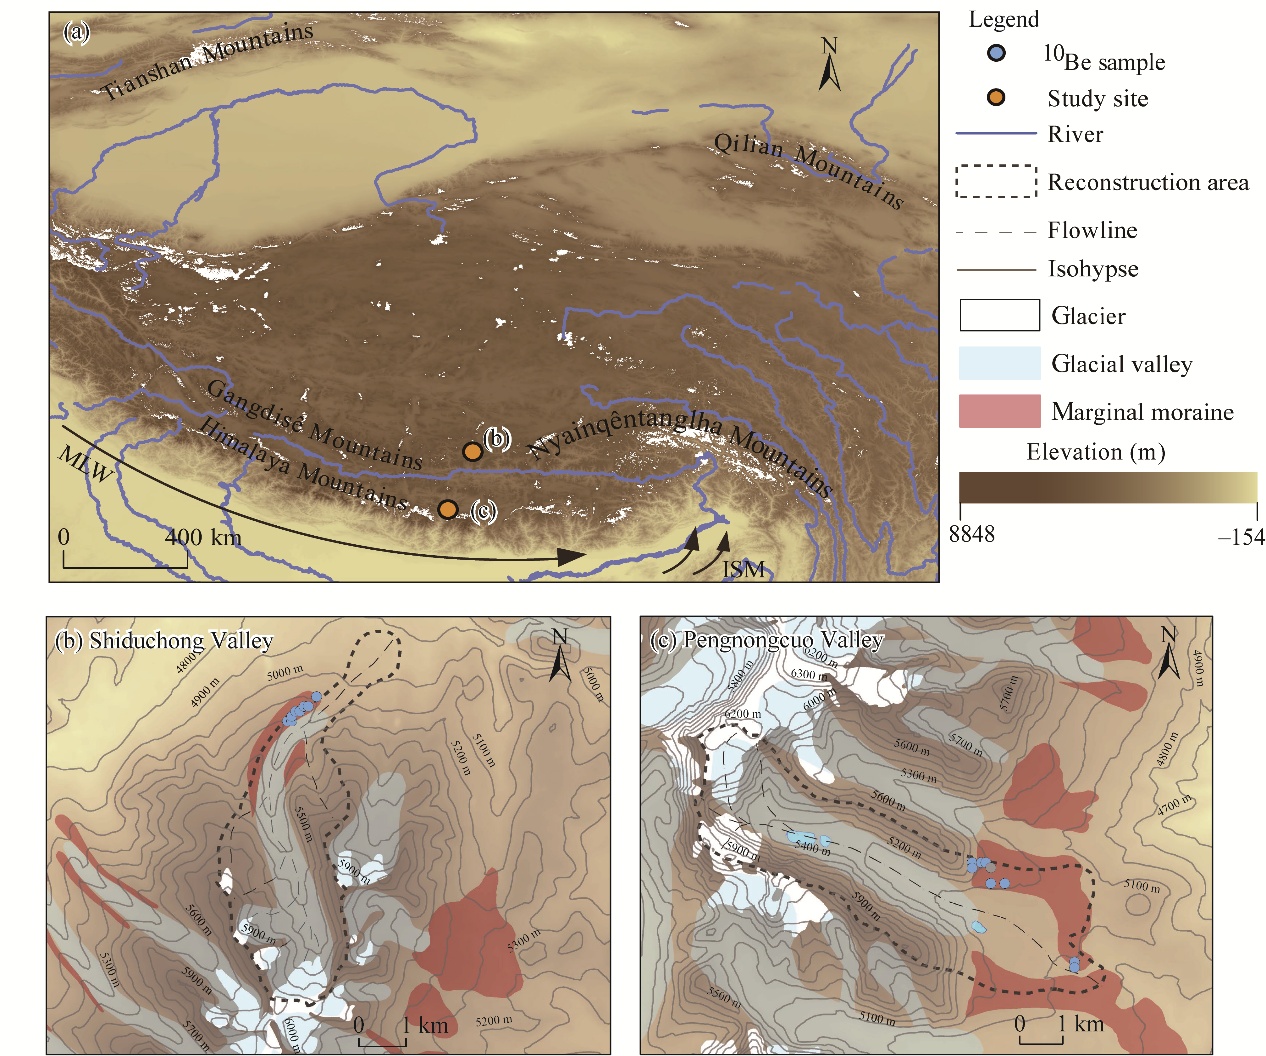
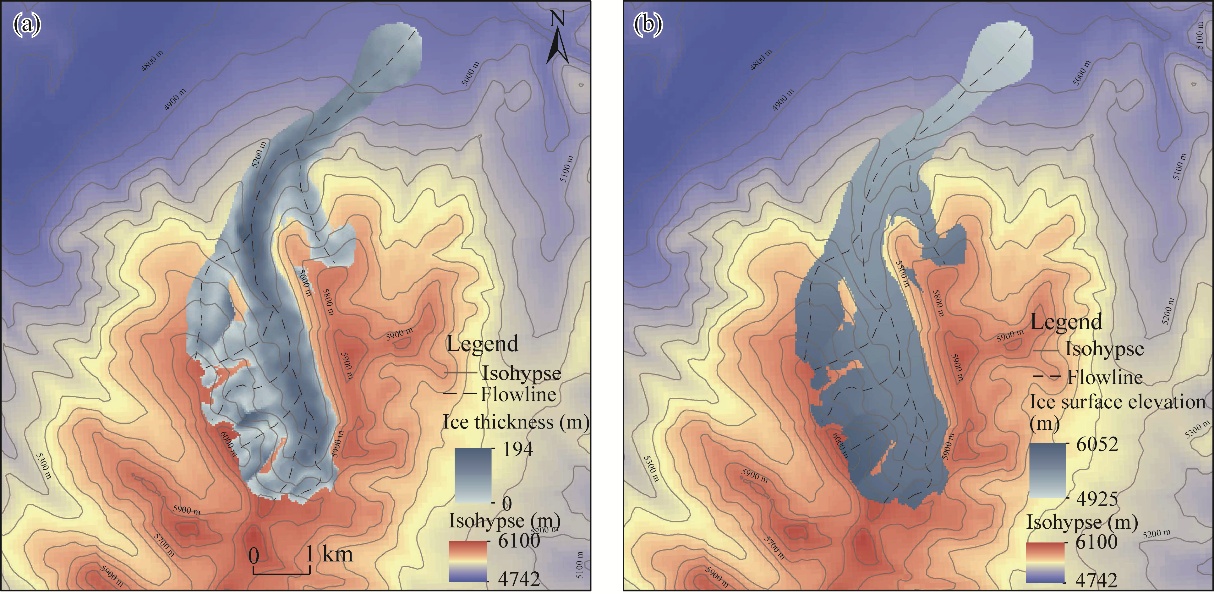
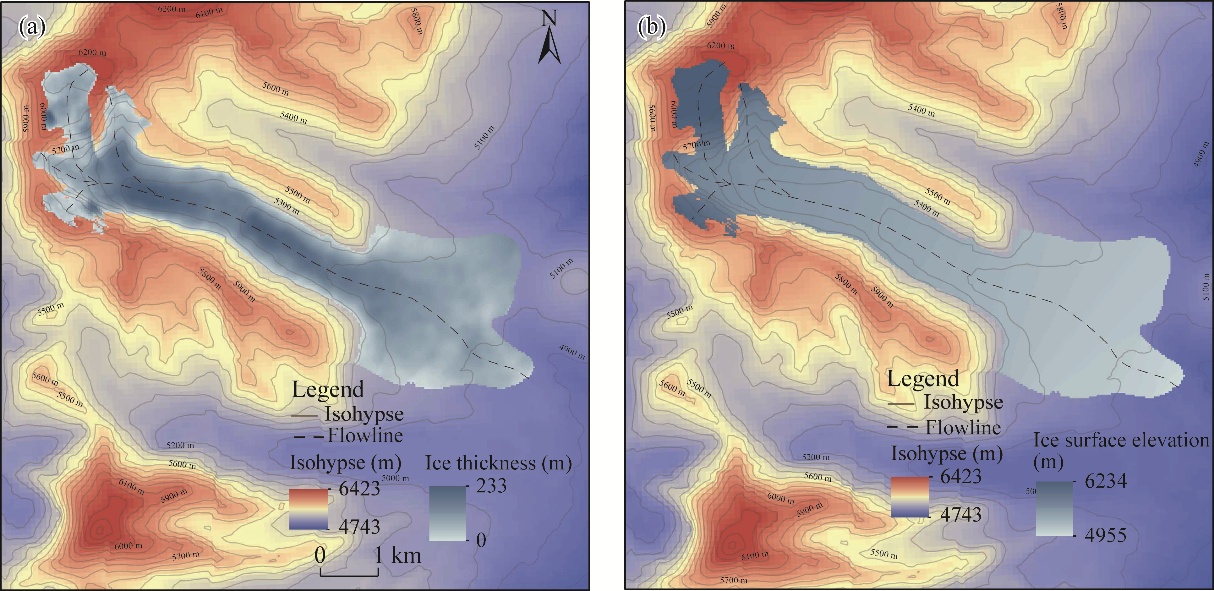
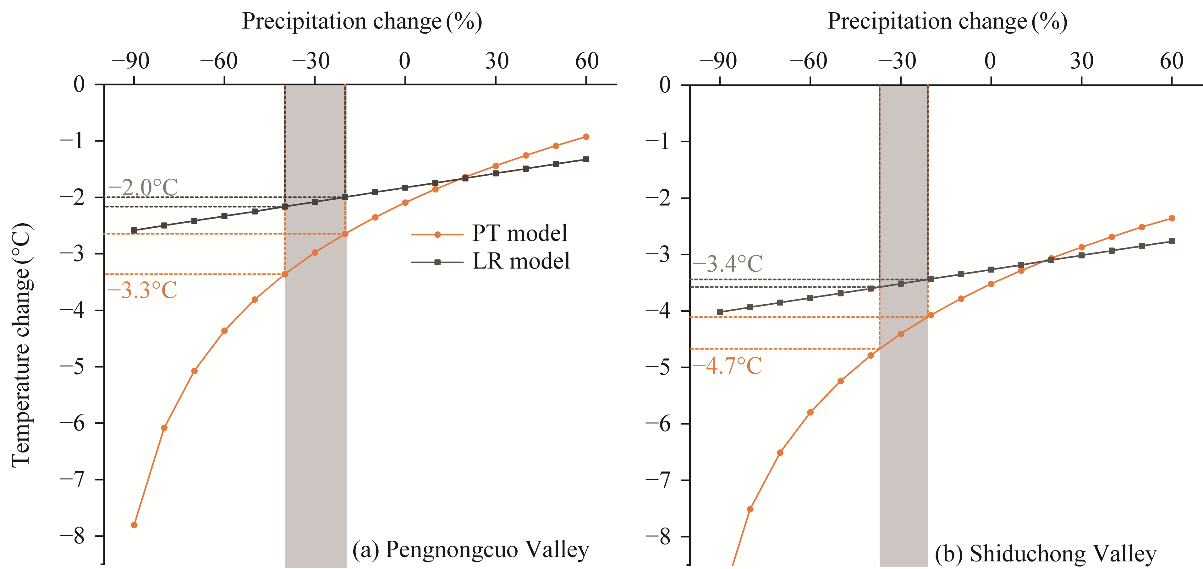
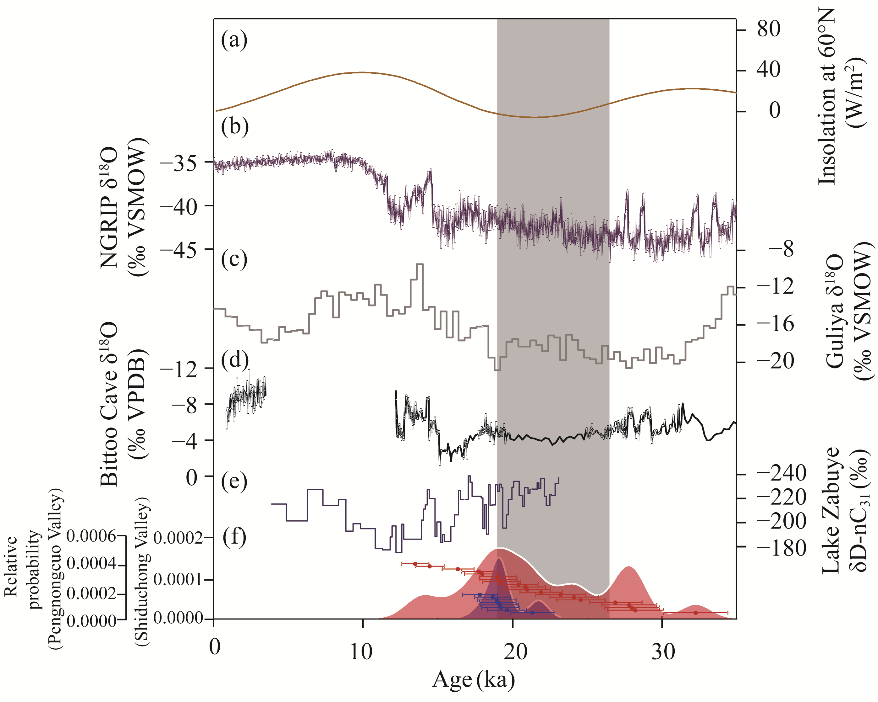
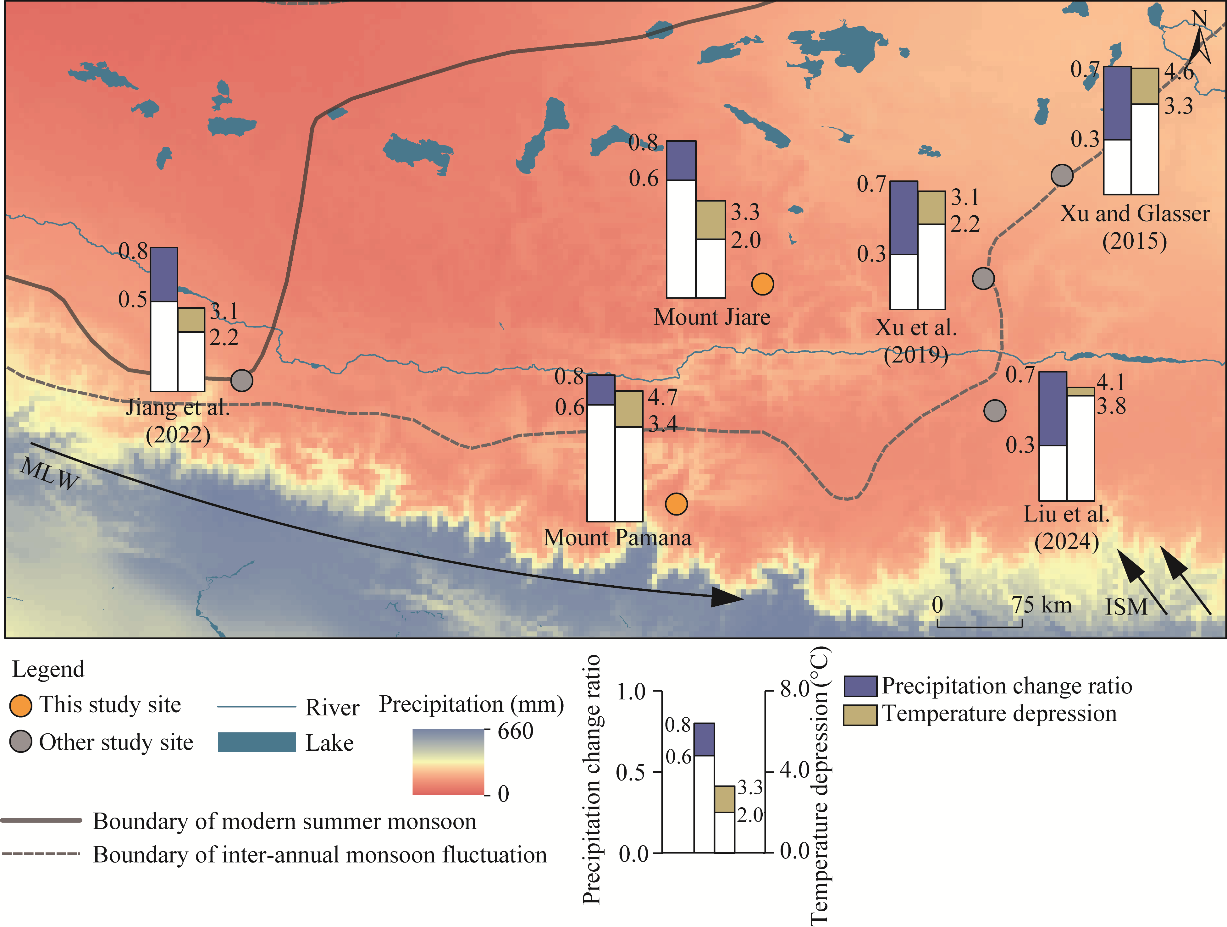
Abstract The southern Xizang Plateau, China, lies within the transition zone between the Asian summer monsoon and mid-latitude westerlies, where complex climate interactions drove extensive paleoglaciation during the Last Glacial Maximum (LGM). However, quantitative paleoclimatic constraints remain limited in this area. To address this gap, we compared two valleys that were glaciated during the LGM, the Pengnongcuo Valley on Mount Jiare in the eastern Gangdisê Mountains and the Shiduchong Valley on Mount Pamana in the central Himalaya Mountains. Using a two-dimensional numerical model constrained by Google Earth imagery and digital elevation model (DEM) data, we reconstructed paleoglacier geometries in the two valleys to constrain equilibrium line altitude (ELA) changes and to infer paleoclimatic conditions during the LGM. Precipitation-temperature (PT) and lapse-rate (LR) models were used to reconstruct paleoclimatic conditions during the LGM. The Pengnongcuo Valley had a maximum LGM ice thickness of 194 m, covered an area of 12.2 km2 with a volume of 0.94 km3, and had an ELA depression of 331 m; the Shiduchong Valley had a maximum ice thickness of 234 m with an area of 14.1 km2, a volume of 1.34 km3, and an ELA depression of 559 m. Despite having nearly identical modern ELAs (5819 m and 5835 m a.s.l. for Pengnongcuo Valley and Shiduchong Valley, respectively), the two glaciers exhibited dramatically different responses during the LGM. By constraining paleo precipitation to 60.0%-80.0% and 63.0%-79.0% of modern values, respectively, based on regional proxies and distinct moisture sources, reconstructed summer temperature depressions were 2.0°C-3.3°C and 3.4°C-4.7°C respectively. Glacial expansion during the LGM in the monsoon-westerlies transition zone of the southern Xizang Plateau resulted from the combined effects of a regional temperature depression, enhanced fluctuations in moisture supply from the Asian summer monsoon, and intensified mid-latitude westerly circulation, which enhanced cold-season precipitation. This study provides quantitative constraints on the LGM glacier-climate interactions in the monsoon-westerlies transition zone and highlights the critical role of coupled temperature and moisture forcing in shaping paleoglacial evolution on the southern Xizang Plateau.
|
|
Received: 23 March 2026
Published: 30 November 2026
|
|
Corresponding Authors:
*LIU Liang (E-mail: liuliangdm@126.com)
|
About author: The first and second authors contributed equally to this work.
Author contributions
Conceptualization: LIU Liang, YU Yue; Methodology: LIU Chang, LIU Liang, HAN Shuting, ZHANG Hongjie; Formal analysis: LIU Liang, YU Yue; Writing - original draft preparation: LIU Chang, YU Yue, LIU Liang, HAN Shuting; Writing - review and editing: LIU Chang, LIU Liang, Jonathan M HARBOR; Funding acquisition: LIU Liang; Resources: LIU Liang; Supervision: LIU Liang, WU Yuhua. All authors approved the manuscript.
|
| Cite this article:
YU Yue, LIU Chang, LIU Liang, Jonathan M HARBOR, HAN Shuting, ZHANG Hongjie, WU Yuhua. Asymmetric glacier sensitivity to the Last Glacial Maximum paleoclimate in the monsoon-westerlies transition zone, southern Xizang Plateau, China. Journal of Arid Land, 2026, 18(11): 1851-1869.
URL:
http://jal.xjegi.com/10.1016/j.jaridl.2026.11.001 OR http://jal.xjegi.com/Y2026/V18/I11/1851
|
|
|
| [1] |
An Z S, Colman S M, Zhou W J, et al. 2012. Interplay between the westerlies and Asian monsoon recorded in Lake Qinghai sediments since 32 ka. Scientific Reports, 2(1): 619, doi: 10.1038/srep00619.
|
|
|
| [2] |
Balco G, Stone J O, Lifton N A, et al. 2008. A complete and easily accessible means of calculating surface exposure ages or erosion rates from 10Be and 26Al measurements. Quaternary Geochronology, 3(3): 174-195.
|
|
|
| [3] |
Benn D I, Lehmkuhl F. 2000. Mass balance and equilibrium-line altitudes of glaciers in high-mountain environments. Quaternary International, 65: 15-29.
|
|
|
| [4] |
Benn D I, Hulton N R J. 2010. An ExcelTM spreadsheet program for reconstructing the surface profile of former mountain glaciers and ice caps. Computers & Geosciences, 36(5): 605-610.
|
|
|
| [5] |
Berger A, Loutre M F. 1991. Insolation values for the climate of the last 10 million years. Quaternary Science Reviews, 10(4): 297-317.
|
|
|
| [6] |
Bush A B. 2002. A comparison of simulated monsoon circulations and snow accumulation in Asia during the mid-Holocene and at the Last Glacial Maximum. Global and Planetary Change, 32(4): 331-347.
|
|
|
| [7] |
Chen F H, Chen J H, Huang W, et al. 2019. Westerlies Asia and monsoonal Asia: spatiotemporal differences in climate change and possible mechanisms on decadal to sub-orbital timescales. Earth-Science Reviews, 192: 337-354.
|
|
|
| [8] |
Chevalier M L, Hilley G, Tapponnier P, et al. 2011. Constraints on the late Quaternary glaciations in Tibet from cosmogenic exposure ages of moraine surfaces. Quaternary Science Reviews, 30(5-6): 528-554.
|
|
|
| [9] |
Clark P U, Dyke A S, Shakun J D, et al. 2009. The last glacial maximum. Science, 325(5941): 710-714.
|
|
|
| [10] |
Cui H, Wang J. 2013. Models for climatic reconstruction upon glacier equilibrium-line altitude variation. Marine Geology & Quaternary Geology, 33(4): 17-24. (in Chinese)
|
|
|
| [11] |
Dong G C, Zhou W J, Yi C L, et al. 2018. The timing and cause of glacial activity during the last glacial in central Tibet based on 10Be surface exposure dating east of Mount Jaggang, the Xainza range. Quaternary Science Reviews, 186: 284-297.
|
|
|
| [12] |
Fick S E, Hijmans R J. 2017. WorldClim 2: new 1-km spatial resolution climate surfaces for global land areas. International Journal of Climatology, 37(12): 4302-4315.
|
|
|
| [13] |
Furbish D J, Andrews J T. 1984. The use of hypsometry to indicate long-term stability and response of valley glaciers to changes in mass transfer. Journal of Glaciology, 30(105): 199-211.
|
|
|
| [14] |
Herzschuh U. 2006. Palaeo-moisture evolution in monsoonal Central Asia during the last 50,000 years. Quaternary Science Reviews, 25(1-2): 163-178.
|
|
|
| [15] |
Heyman J. 2014. Paleoglaciation of the Tibetan Plateau and surrounding mountains based on exposure ages and ELA depression estimates. Quaternary Science Reviews, 91: 30-41.
|
|
|
| [16] |
Hu G, Yi C L, Liu J H, et al. 2020. Glacial advances and stability of the moraine dam on Mount Namcha Barwa since the Last Glacial Maximum, eastern Himalayan syntaxis. Geomorphology, 365: 107246, doi: 10.1016/j.geomorph.2020.107246.
|
|
|
| [17] |
Huang L X, Chen J, Yang K, et al. 2023. The northern boundary of the Asian summer monsoon and division of westerlies and monsoon regimes over the Tibetan Plateau in present-day. Science China Earth Sciences, 66(4): 882-893.
|
|
|
| [18] |
Jiang D B, Lang X M, Tian Z P, et al. 2011. Last glacial maximum climate over China from PMIP simulations. Palaeogeography, Palaeoclimatology, Palaeoecology, 309(3-4): 347-357.
|
|
|
| [19] |
Jiang Z H, Zhang Q, Xu H Y, et al. 2022. Palaeoclimate reconstruction of the central Gangdise Mountains, southern Tibetan Plateau, based on glacier modelling. Land, 11(8): 1314, doi: 10.3390/land11081314.
|
|
|
| [20] |
Jin S, Li Z Q, Wang Z M, et al. 2020. Ice thickness distribution and volume estimation of Burqin Glacier No. 18 in the Chinese Altay Mountains. Journal of Arid Land, 12(6): 905-916.
|
|
|
| [21] |
Kathayat G, Cheng H, Sinha A, et al. 2016. Indian monsoon variability on millennial-orbital timescales. Scientific Reports, 6(1): 24374, doi: 10.1038/srep24374.
|
|
|
| [22] |
Kern Z, László P. 2010. Size specific steady-state accumulation-area ratio: an improvement for equilibrium-line estimation of small palaeoglaciers. Quaternary Science Reviews, 29(19-20): 2781-2787.
|
|
|
| [23] |
Lal D. 1991. Cosmic ray labeling of erosion surfaces: in situ nuclide production rates and erosion models. Earth and Planetary Science Letters, 104(2-4): 424-439.
|
|
|
| [24] |
Lifton N, Sato T, Dunai T J. 2014. Scaling in situ cosmogenic nuclide production rates using analytical approximations to atmospheric cosmic-ray fluxes. Earth and Planetary Science Letters, 386: 149-160.
|
|
|
| [25] |
Ling Y, Zeng F G, Bendle J, et al. 2025. Hydroclimatic evolution of the southwestern Tibetan Plateau since the Last Glacial Maximum inferred from multi-proxy data in Lake Zabuye. Palaeogeography, Palaeoclimatology, Palaeoecology, 664: 112809, doi: 10.1016/j.palaeo.2025.112809.
|
|
|
| [26] |
Liu J H, Yi C L, Li Y K, et al. 2017. Glacial fluctuations around the Karola Pass, eastern Lhagoi Kangri Range, since the Last Glacial Maximum. Journal of Quaternary Science, 32(4): 516-527.
|
|
|
| [27] |
Liu J H, Li Y K, Yi C L, et al. 2024. Glacier changes since the Last Glacial Maximum on two slopes of Mt Noijin Kang-Sang, Southern Tibetan Plateau. Journal of Quaternary Science, 39(1): 70-81.
|
|
|
| [28] |
Liu L, Zhang H J, Zhang W, et al. 2022. Global last glacial maximum climate inferred from reconstructing the Eryehai Valley, Mount Taibai, Qinling Mountains, eastern China. Palaeogeography, Palaeoclimatology, Palaeoecology, 590: 110858, doi: 10.1016/j.palaeo.2022.110858.
|
|
|
| [29] |
Mehta M, Majeed Z, Dobhal D P, et al. 2012. Geomorphological evidences of post-LGM glacial advancements in the Himalaya: a study from Chorabari Glacier, Garhwal Himalaya, India. Journal of Earth System Science, 121: 149-163.
|
|
|
| [30] |
Miehe G, Miehe S, Bach K, et al. 2011. Ecological stability during the LGM and the mid-Holocene in the Alpine Steppes of Tibet? Quaternary Research, 76(2): 243-252.
|
|
|
| [31] |
Nye J F. 2015. The mechanics of a glacier snout. Journal of Glaciology, 61(230): 1118-1120.
|
|
|
| [32] |
Ohmura A, Kasser P, Funk M. 1992. Climate at the equilibrium line of glaciers. Journal of Glaciology, 38(130): 397-411.
|
|
|
| [33] |
Owen L A, Benn D I. 2005. Equilibrium-line altitudes of the Last Glacial Maximum for the Himalaya and Tibet: an assessment and evaluation of results. Quaternary International, 138-139: 55-78.
|
|
|
| [34] |
Pellitero R, Rea B R, Spagnolo M, et al. 2015. A GIS tool for automatic calculation of glacier equilibrium-line altitudes. Computers & Geosciences, 82: 55-62.
|
|
|
| [35] |
Pellitero R, Rea B R, Spagnolo M, et al. 2016. GlaRe, a GIS tool to reconstruct the 3D surface of palaeoglaciers. Computers & Geosciences, 94: 77-85.
|
|
|
| [36] |
Prell W L, Kutzbach J E. 1987. Monsoon variability over the past 150,000 years. Journal of Geophysical Research: Atmospheres, 92(D7): 8411-8425.
|
|
|
| [37] |
Qiu J. 2008. China: the third pole. Nature, 454: 393-396.
|
|
|
| [38] |
Qiu J K, Wang J. 2024. Analysis strategies and methods of surface exposure chronology data for Quaternary glaciation. Journal of Glaciology and Geocryology, 46(6): 1908-1920. (in Chinese)
|
|
|
| [39] |
Rasmussen S O, Andersen K K, Svensson A M, et al. 2006. A new Greenland ice core chronology for the last glacial termination. Journal of Geophysical Research: Atmospheres, 111(D6): D06102, doi: 10.1029/2005JD006079.
|
|
|
| [40] |
Rea B R. 2009. Defining modern day Area-Altitude Balance Ratios (AABRs) and their use in glacier-climate reconstructions. Quaternary Science Reviews, 28(3-4): 237-248.
|
|
|
| [41] |
Schmidt J, Opgenoorth L, Martens J, et al. 2011. Neoendemic ground beetles and private tree haplotypes: two independent proxies attest a moderate last glacial maximum summer temperature depression of 3-4°C for the southern Tibetan Plateau. Quaternary Science Reviews, 30(15-16): 1918-1925.
|
|
|
| [42] |
Seltzer G O. 1994. Climatic interpretation of alpine snowline variations on millennial time scales. Quaternary Research, 41(2): 154-159.
|
|
|
| [43] |
Shen C M, Tang L Y, Wang S M. 1996. Vegetation and climate during the last 250,000 years in Zoige region. Acta Micropalaeontologica Sinica, 13(4): 373-385. (in Chinese)
|
|
|
| [44] |
Shi Y F, Zheng B C, Li S J, et al. 1995. Studies on altitude and climatic environment in the middle and east parts of Tibetan Plateau during Quaternary maximum glaciation. Journal of Glaciology and Geocryology, 17(2): 97-112. (in Chinese)
|
|
|
| [45] |
Shi Y F, Zheng B C, Yao T D. 1997. Glaciers and environments during the Last Glacial Maximum (LGM) on the Tibetan Plateau. Journal of Glaciology and Geocryology, 19(2): 97-113. (in Chinese)
|
|
|
| [46] |
Stone J O. 2000. Air pressure and cosmogenic isotope production. Journal of Geophysical Research, 105(B10): 23753-23759.
|
|
|
| [47] |
Tang L Y, Wang S L. 1988. Palynoflora of Gonghe formation in Gonghe Basin, Qinghai. Acta Palaeontologica Sinica, 27(5): 583-590. (in Chinese)
|
|
|
| [48] |
Thompson L G, Yao T, Davis M E, et al. 1997. Tropical climate instability: the last glacial cycle from a Qinghai-Tibetan ice core. Science, 276(5320): 1821-1825.
|
|
|
| [49] |
Van der Veen C J. 2013. Fundamentals of Glacier Dynamics (2nd ed.). Boca Raton: CRC Press.
|
|
|
| [50] |
Wang P P, Li Z Q, Xu C H, et al. 2021. Region-wide glacier area and mass budgets for the Shaksgam River Basin, Karakoram Mountains, during 2000-2016. Journal of Arid Land, 13(2): 175-188.
|
|
|
| [51] |
Wang T X, Chen F L, Long A H, et al. 2024. Glacier area change and its impact on runoff in the Manas River Basin, Northwest China from 2000 to 2020. Journal of Arid Land, 16(7): 877-894.
|
|
|
| [52] |
Xu X K, Glasser N F. 2015. Glacier sensitivity to equilibrium line altitude and reconstruction for the Last Glacial cycle: glacier modeling in the Payuwang Valley, western Nyaiqentanggulha Shan, Tibetan Plateau. Palaeogeography, Palaeoclimatology, Palaeoecology, 440: 614-620.
|
|
|
| [53] |
Xu X K, Yao T D, Xu B Q, et al. 2019. Last Glacial Maximum glacier modeling in the Quemuqu Valley, southern Tibetan Plateau, and its climatic implications. Boreas, 49(2): 286-295.
|
|
|
| [54] |
Xu X K, Yao T D, Xu B Q, et al. 2020. Glacial events during the last glacial termination in the Pagele valley, Qiongmu Gangri peak, southern Tibetan Plateau, and their links to oceanic and atmospheric circulation. Quaternary Research, 95: 129-141.
|
|
|
| [55] |
Yao T D, Thompson L, Yang W, et al. 2012. Different glacier status with atmospheric circulations in Tibetan Plateau and surroundings. Nature Climate Change, 2(9): 663-667.
|
|
|
| [56] |
Yao T D, Masson Delmotte V, Gao J, et al. 2013. A review of climatic controls on δ18O in precipitation over the Tibetan Plateau: observations and simulations. Reviews of Geophysics, 51(4): 525-548.
|
|
|
| [57] |
Zhang Q, Yi C L, Dong G C, et al. 2018. Quaternary glaciations in the Lopu Kangri area, central Gangdise Mountains, southern Tibetan Plateau. Quaternary Science Reviews, 201: 470-482.
|
|
|
| [58] |
Zheng B X, Xu Q Q, Shen Y P. 2002. The relationship between climate change and Quaternary glacial cycles on the Qinghai-Tibetan Plateau: review and speculation. Quaternary International, 97-98: 93-101.
|
|
|
| [59] |
Zhou Z H, Han N, Liu J J, et al. 2020. Glacier variations and their response to climate change in an arid inland river basin of Northwest China. Journal of Arid Land, 12(3): 357-373.
|
|
|
| [60] |
Zhu L P, Lü X M, Wang J B, et al. 2015. Climate change on the Tibetan Plateau in response to shifting atmospheric circulation since the LGM. Scientific Reports, 5(1): 13318, doi: 10.1038/srep13318.
|
|
|
|
Viewed |
|
|
|
Full text
|
|
|
|
|
Abstract
|
|
|
|
|
Cited |
|
|
|
|
| |
Shared |
|
|
|
|
| |
Discussed |
|
|
|
|