| Research article |
|


|
|
|
| Analysis of morphological characteristics of gravels based on digital image processing technology and self-organizing map |
XU Tao1,2, YU Huan1,*( ), QIU Xia3, KONG Bo4, XIANG Qing1, XU Xiaoyu5,6, FU Hao7 ), QIU Xia3, KONG Bo4, XIANG Qing1, XU Xiaoyu5,6, FU Hao7 |
1College of Earth Science, Chengdu University of Technology, Chengdu 610059, China
2Beijing SuperMap Software Co., Ltd., Beijing 100015, China
3Sichuan Real Estate Registration Center, Chengdu 610014, China
4Chengdu Institute of Mountain Land and Disasters, Chinese Academy of Sciences, Chengdu 610041, China
5School of Earth Systems and Sustainability, Southern Illinois University Carbondale, Carbondale, IL 62901, United States of America
6Environmental Resources and Policy, Southern Illinois University Carbondale, Carbondale, IL 62901, United States of America
7Sichuan Institute of Land and Space Ecological Restoration and Geohazard Prevention, Chengdu 610081, China |
|
|
|
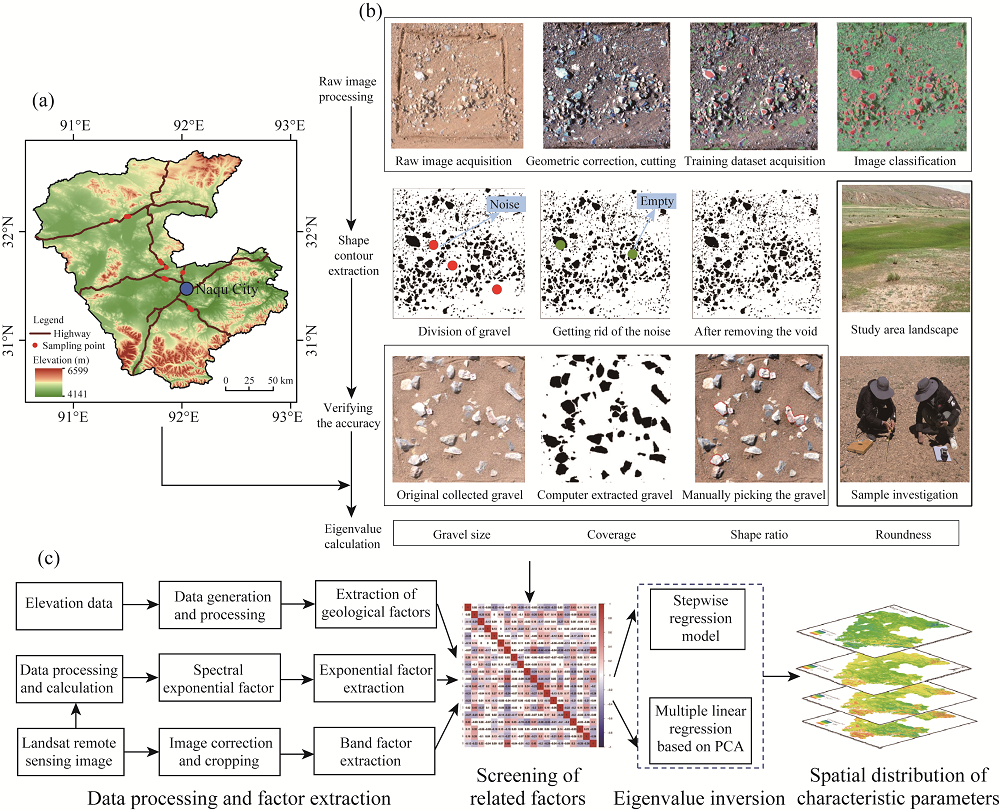
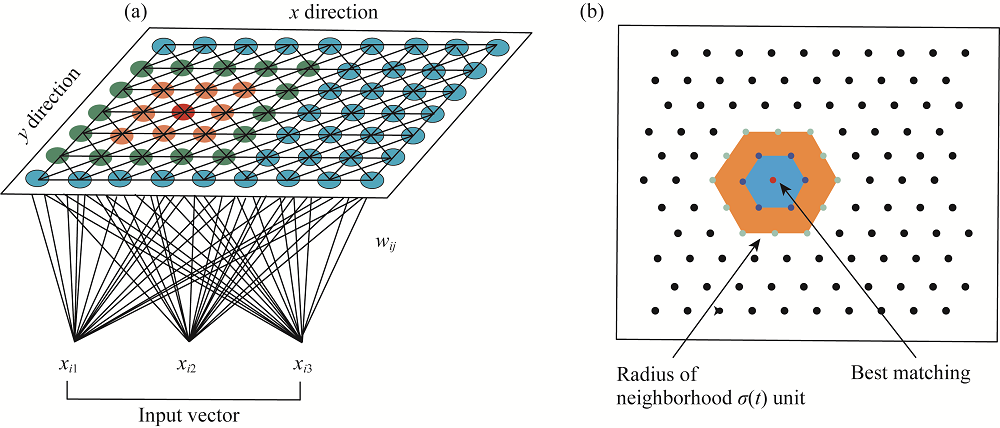
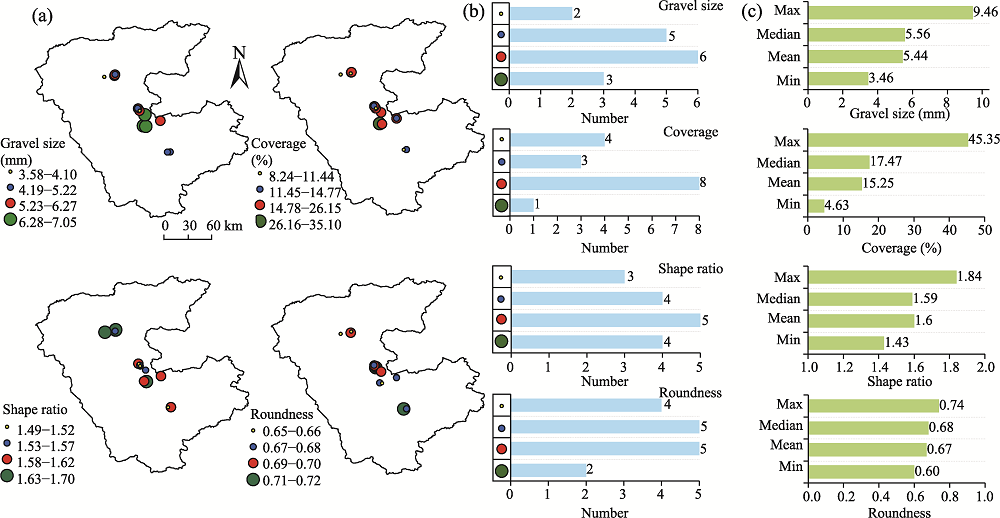
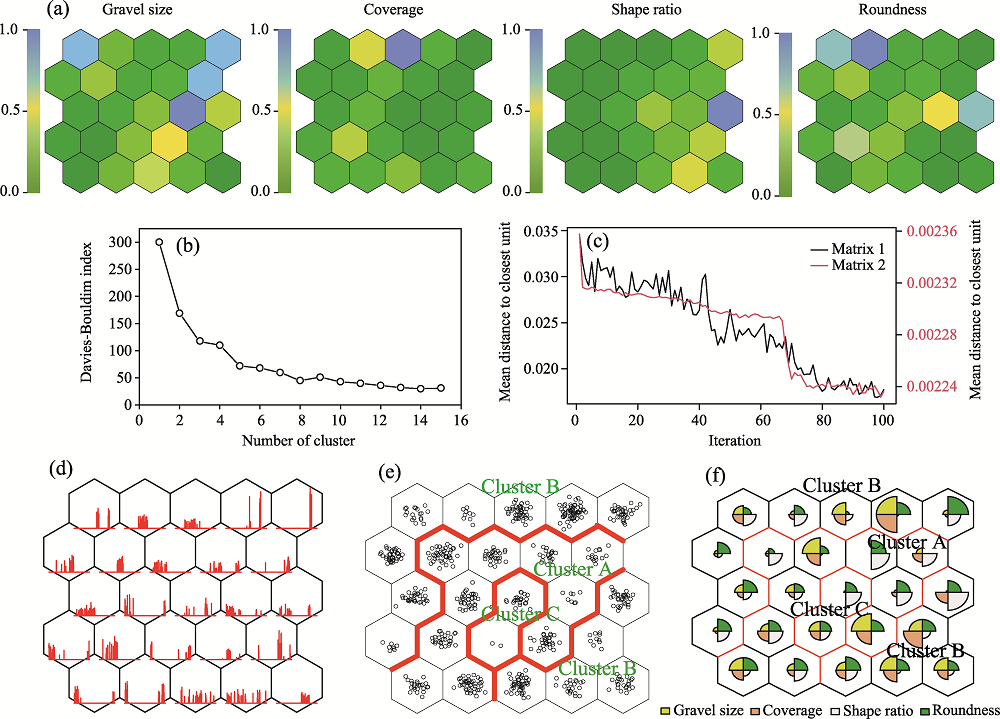
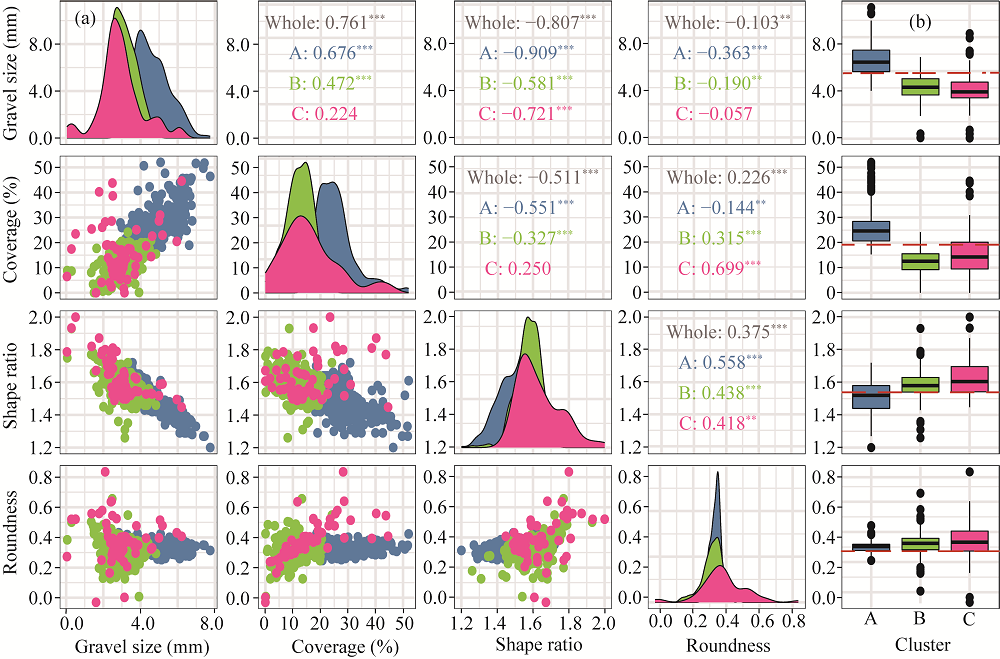
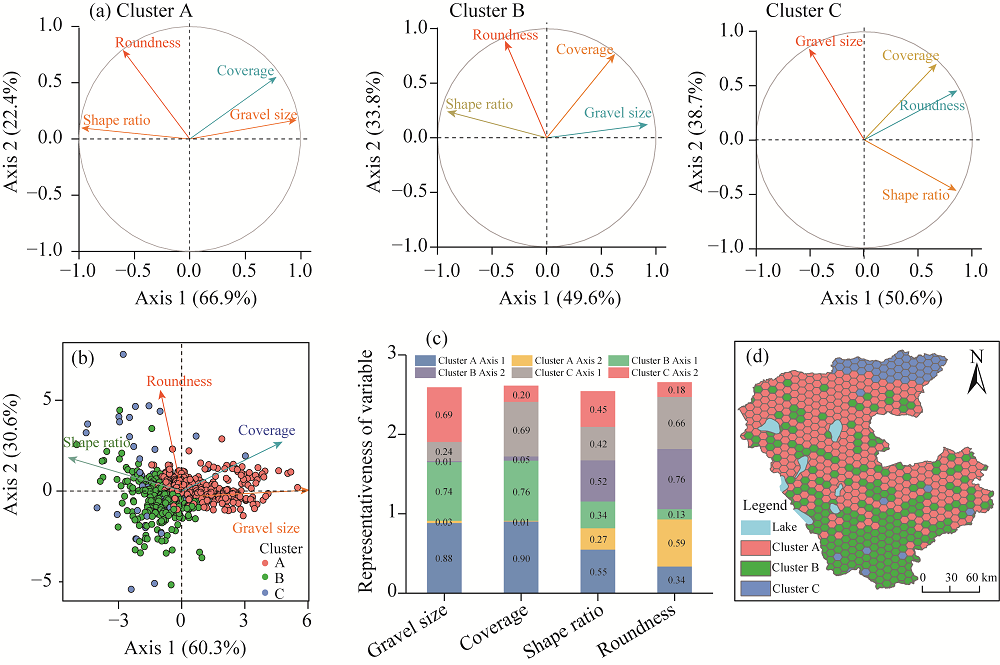
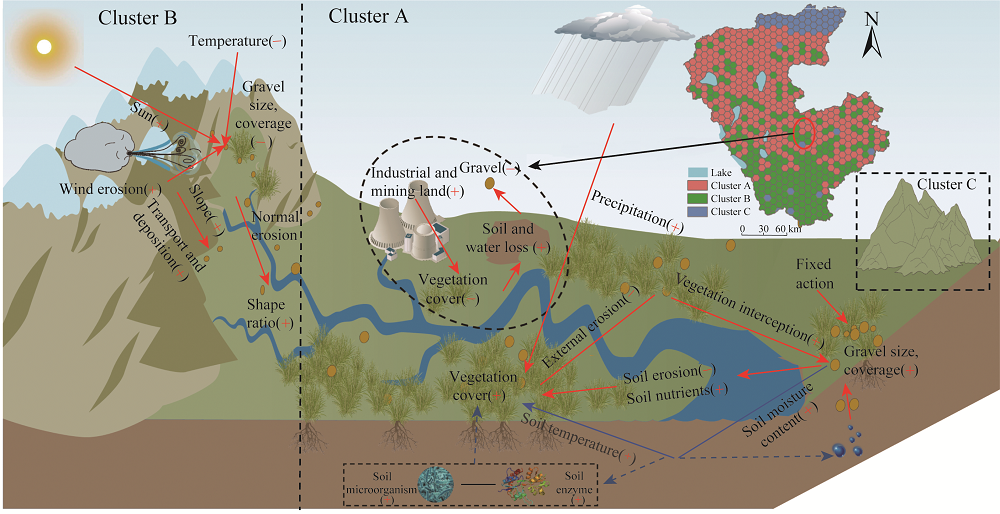
Abstract A comprehensive understanding of spatial distribution and clustering patterns of gravels is of great significance for ecological restoration and monitoring. However, traditional methods for studying gravels are low-efficiency and have many errors. This study researched the spatial distribution and cluster characteristics of gravels based on digital image processing technology combined with a self-organizing map (SOM) and multivariate statistical methods in the grassland of northern Tibetan Plateau. Moreover, the correlation of morphological parameters of gravels between different cluster groups and the environmental factors affecting gravel distribution were analyzed. The results showed that the morphological characteristics of gravels in northern region (cluster C) and southern region (cluster B) of the Tibetan Plateau were similar, with a low gravel coverage, small gravel diameter, and elongated shape. These regions were mainly distributed in high mountainous areas with large topographic relief. The central region (cluster A) has high coverage of gravels with a larger diameter, mainly distributed in high-altitude plains with smaller undulation. Principal component analysis (PCA) results showed that the gravel distribution of cluster A may be mainly affected by vegetation, while those in clusters B and C could be mainly affected by topography, climate, and soil. The study confirmed that the combination of digital image processing technology and SOM could effectively analyzed the spatial distribution characteristics of gravels, providing a new mode for gravel research.
|
|
Received: 17 November 2022
Published: 31 March 2023
|
|
Corresponding Authors:
* YU Huan (E-mail: yuhuan0622@126.com)
|
|
|
| [1] |
Adelsberger K A, Smith J R. 2009. Desert pavement development and landscape stability on the Eastern Libyan Plateau, Egypt. Geomorphology, 107(3-4): 178-194.
doi: 10.1016/j.geomorph.2008.12.005
|
|
|
| [2] |
Al-Farraj A, Harvey A M. 2000. Desert pavement characteristics on wadi terrace and alluvial fan surfaces: Wadi Al-Bih, U.A.E. and Oman. Geomorphology, 35(3-4): 279-297.
doi: 10.1016/S0169-555X(00)00049-0
|
|
|
| [3] |
Babalola O, Lal R. 1997. Subsoil gravel horizon and maize root growth. Plant and Soil, 46(2): 337-346.
doi: 10.1007/BF00010090
|
|
|
| [4] |
Balaguer A, Ruiz L A, Hermosilla T, et al. 2010. Definition of a comprehensive set of texture semivariogram features and their evaluation for object-oriented image classification. Computers and Geosciences, 36(2): 231-240.
doi: 10.1016/j.cageo.2009.05.003
|
|
|
| [5] |
Brouwer J, Anderson H. 2000. Water holding capacity of ironstone gravel in a typic plinthoxeralf in southeast Australia. Soil Science Society of America Journal, 64(5): 1603-1608.
doi: 10.2136/sssaj2000.6451603x
|
|
|
| [6] |
Cerdà A. 2001. Effects of rock fragment cover on soil infiltration, interrill runoff and erosion. European Journal of Soil Science, 52(1): 59-68.
doi: 10.1046/j.1365-2389.2001.00354.x
|
|
|
| [7] |
Chen H, Liu J, Wang K, et al. 2011. Spatial distribution of rock fragments on steep hillslopes in karst region of northwest Guangxi, China. CATENA, 84(1-2): 21-28.
doi: 10.1016/j.catena.2010.08.012
|
|
|
| [8] |
Chen H, Bai X, Li Y, et al. 2020. The evolution of rocky desertification and its response to land use changes in Wanshan Karst area. Journal of Agricultural Resources and Environment, 37(1): 24-35. (in Chinese)
|
|
|
| [9] |
Cui Z, Yang W S, Cheng Z, et al. 2022. Top-down degradation of alpine meadow in the Qinghai-Tibetan Plateau: Gravelization initiate hillside surface aridity and meadow community disappearance. CATENA, 210: 105933, doi: 10.1016/J.CATENA.2021.105933.
doi: 10.1016/J.CATENA.2021.105933
|
|
|
| [10] |
Dai L J, Wang L Q, Li L F, et al. 2018. Multivariate geostatistical analysis and source identification of heavy metals in the sediment of Poyang Lake in China. Science of the Total Environment, 621: 1433-1444.
doi: 10.1016/j.scitotenv.2017.10.085
|
|
|
| [11] |
Danalatos N G, Kosmas C S, Moustakas N C, et al. 1995. Rock fragments IL their impact on soil physical properties and biomass production under Mediterranean conditions. Soil Use and Management, 11(3): 121-126.
doi: 10.1111/sum.1995.11.issue-3
|
|
|
| [12] |
David J G, Ian R, Stephen P R, et al. 2005. Automated sizing of coarse-grained sediments: Image-processing procedures. Mathematical Geology, 37(1): 1-28.
doi: 10.1007/s11004-005-8745-x
|
|
|
| [13] |
Dong Z B, Wang H T, Liu X P, et al. 2004. A wind tunnel investigation of the influences of fetch length on the flux profile of a sand cloud blowing over a gravel surface. Earth Surface Processes and Landforms, 29(13): 1613-1626.
doi: 10.1002/(ISSN)1096-9837
|
|
|
| [14] |
Duboc O, Hernandez M A, Wenzel W W, et al. 2022. Improving the prediction of fertilizer phosphorus availability to plants with simple, but non-standardized extraction techniques. Science of the Total Environment, 806: 150486, doi: 10.1016/j.scitotenv.2021.150486.
doi: 10.1016/j.scitotenv.2021.150486
|
|
|
| [15] |
Epstein E G, Grant W J, Struchtemeyer R A. 1966. Effects of stones on runoff, erosion, and soil moisture. Soil Science Society of America Journal, 30(5): 638-640.
doi: 10.2136/sssaj1966.03615995003000050029x
|
|
|
| [16] |
Ercoli L, Masoni A, Mariotti M. 2006. Dry matter accumulation and remobilization of durum wheat as affected by soil gravel content. Cereal Research Communications, 34(4): 1299-1306.
doi: 10.1556/CRC.34.2006.4.272
|
|
|
| [17] |
Ferguson R I, Bloomer D J, Church M. 2011. Evolution of an advancing gravel front: observations from Vedder canal, British Columbia. Earth Surface Processes and Landforms, 36(9): 1172-1182.
doi: 10.1002/esp.2142
|
|
|
| [18] |
Figueiredo T D, Poesen J. 1998. Effects of surface rock fragment characteristics on interrill runoff and erosion of a silty loam soil. Soil and Tillage Research, 46(1-2): 81-85.
doi: 10.1016/S0167-1987(98)80110-4
|
|
|
| [19] |
Gao Y, Fu S H, Luo L J, et al. 2013. A study on measurement methods of rock fragment cover. Bulletin of Soil and Water Conservation, 33(4): 264-267, 270. (in Chinese)
|
|
|
| [20] |
Ghaseminezhad M H, Karami A. 2011. A novel self-organizing map (SOM) neural network for discrete groups of data clustering. Applied Soft Computing, 11(4): 3771-3778.
doi: 10.1016/j.asoc.2011.02.009
|
|
|
| [21] |
Giraudel J L, Lek S. 2001. A comparison of self-organizing map algorithm and some conventional statistical methods for ecological community ordination. Ecological Modelling, 146(1-3): 329-339.
doi: 10.1016/S0304-3800(01)00324-6
|
|
|
| [22] |
Gonga T, Zhua Y, Shaoa M. 2018. Spatial distribution of caliche nodules in surface soil and their influencing factors in the Liudaogou catchment of the northern Loess Plateau, China. Geoderma, 329: 11-19.
doi: 10.1016/j.geoderma.2018.05.012
|
|
|
| [23] |
Govers G, Oost KV, Poesen J. 2006. Responses of a semi-arid landscape to human disturbance: A simulation study of the interaction between rock fragment cover, soil erosion and land use change. Geoderma, 133(1-2):19-31.
doi: 10.1016/j.geoderma.2006.03.034
|
|
|
| [24] |
Grewal S S, Singh K, Dyal S. 1984. Soil profile gravel concentration and its effect on rainfed crop yields. Plant and Soil, 81(1): 75-83.
doi: 10.1007/BF02206896
|
|
|
| [25] |
Guidetti P, Boero F. 2004. Desertification of Mediterranean rocky reefs caused by date-mussel, Lithophaga lithophaga (Mollusca: Bivalvia), fishery: Effects on adult and juvenile abundance of a temperate fish. Marine Pollution Bulletin, 48(9/10): 978-982.
doi: 10.1016/j.marpolbul.2003.12.006
|
|
|
| [26] |
Guo B, Kong W H, Jiang L, et al. 2018. Analysis of spatial and temporal changes and its driving mechanism of ecological vulnerability of alpine ecosystem in Qinghai Tibet Plateau. Ecological Science, 37(3): 96-106. (in Chinese)
|
|
|
| [27] |
Guo B, Yang F, Li J L, et al. 2022a. A novel-optimal monitoring index of rocky desertification based on feature space model and red edge indices that derived from sentinel-2 MSI image. Geomatics, Natural Hazards and Risk, 13(1): 1571-1592.
doi: 10.1080/19475705.2022.2092038
|
|
|
| [28] |
Guo B, Yang F, Fan J F, et al. 2022b. The changes of spatiotemporal pattern of rocky desertification and its dominant driving factors in typical Karst mountainous areas under the background of global change. Remote Sensing, 14(10): 2351, doi: 10.3390/rs14102351.
doi: 10.3390/rs14102351
|
|
|
| [29] |
Guo B, Yang F, Fan Y W, et al. 2023. The dominant driving factors of rocky desertification and their variations in typical mountainous Karst areas of southwest China in the context of global change. CATENA, 220: 106674, doi: 10.1016/j.catena.2022.106674.
doi: 10.1016/j.catena.2022.106674
|
|
|
| [30] |
Guo G H, Li K, Zhang D G, et al. 2022. Quantitative source apportionment and associated driving factor identification for soil potential toxicity elements via combining receptor models, SOM, and geo-detector method. Science of the Total Environment, 830, doi: 10.1016/j.scitotenv.2022.154721.
doi: 10.1016/j.scitotenv.2022.154721
|
|
|
| [31] |
Gurnell A M, Blackall T D, Petts G E. 2008. Characteristics of freshly deposited sand and finer sediments along an island-braided, gravel-bed river: the roles of water, wind and trees. Geomorphology, 99(1-4): 254-269.
doi: 10.1016/j.geomorph.2007.11.009
|
|
|
| [32] |
Hallet B. 1981. Glacial abrasion and sliding: Their dependence on the debris concentration in basal ice. Annals of Glaciology, 2(1): 23-28.
doi: 10.3189/172756481794352487
|
|
|
| [33] |
Hao A H, Xue X, Peng F, et al. 2020. Different vegetation and soil degradation characteristics of a typical grassland in the Qinghai-Tibetan Plateau. Acta Ecologica Sinica, 40(3): 964-975. (in Chinese)
|
|
|
| [34] |
Heisner U, Raber B, Hildebrand E E. 2004. The importance of the soil skeleton for plant-available nutrients in sites of the Southern Black Forest, Germany. European Journal of Forest Research, 123(4): 249-257.
doi: 10.1007/s10342-004-0041-7
|
|
|
| [35] |
Hilker T, Wulder M A, Coops N C, et al. 2009. A new data fusion model for high spatial- and temporal-resolution mapping of forest disturbance based on Landsat and Modis. Remote Sensing of Environment, 113(8): 1613-1627.
doi: 10.1016/j.rse.2009.03.007
|
|
|
| [36] |
Huang J, Li Z, Zeng G, et al. 2013. Microbial responses to simulated water erosion in relation to organic carbon dynamics on a hilly cropland in subtropical China. Ecological Engineering, 60: 67-75.
doi: 10.1016/j.ecoleng.2013.07.040
|
|
|
| [37] |
Ibbeken H, Schleyer R. 1986. Photo-sieving: A method for grain-size analysis of coarse-grained, unconsolidated bedding surfaces. Earth Surface Processes and Landforms, 11(1): 59-77.
doi: 10.1002/(ISSN)1096-9837
|
|
|
| [38] |
Jackson L P, Hall I V, Aalders L E. 1972. Lowbush blueberry seedling growth as affected by soil type. Canadian Journal of Soil Science, 52(1): 113-115.
doi: 10.4141/cjss72-012
|
|
|
| [39] |
Karnieli A, Cierniewski J. 2001. Inferring the roughness of desert rocky surfaces from their bidirectional reflectance data. Advances in Space Research, 28(1): 171-176.
doi: 10.1016/S0273-1177(01)00340-4
|
|
|
| [40] |
Kim K, Yun S, Yu S, et al. 2020. Geochemical pattern recognitions of deep thermal groundwater in South Korea using selforganizing map: Identified pathways of geochemical reaction and mixing. Journal of Hydrology, 589: 125202, doi: 10.1016/j.jhydrol.2020.125202.
doi: 10.1016/j.jhydrol.2020.125202
|
|
|
| [41] |
Lai X, Zhu Q, Castellano M J, et al. 2022. Soil rock fragments: Unquantified players in terrestrial carbon and nitrogen cycles. Geoderma, 406: 115530, doi: 10.1016/j.geoderma.2021.115530.
doi: 10.1016/j.geoderma.2021.115530
|
|
|
| [42] |
Li H R, Zou X Y, Zhang C L, et al. 2021. Effects of gravel cover on the near-surface airflow field and soil wind erosion. Soil & Tillage Research, 214: 105133, doi: 10.1016/j.still.2021.105133.
doi: 10.1016/j.still.2021.105133
|
|
|
| [43] |
Li T, He B, Chen Z, et al. 2017. Effects of gravel on concentrated flow hydraulics and erosion in simulated landslide deposits. CATENA, 156: 197-204.
doi: 10.1016/j.catena.2017.04.015
|
|
|
| [44] |
Li X Y, Contreras S, Solé-Benet A. 2007. Spatial distribution of rock fragments in Dolines: A case study in a semiarid Mediterranean mountain-range (Sierra de Gádor, SE Spain). CATENA, 70(3): 366-374.
doi: 10.1016/j.catena.2006.11.003
|
|
|
| [45] |
Li Z, Bagan H, Yamagata Y. 2018. Analysis of spatiotemporal land cover changes in Inner Mongolia using self-organizing map neural network and grid cells method. Science of the Total Environment, 636: 1180-1191.
doi: 10.1016/j.scitotenv.2018.04.361
|
|
|
| [46] |
Liu F, Liu F G, Zhou Q, et al. 2021. Ecological risk and regional differentiation in the Qinghai-Tibet Plateau. Journal of Natural Resources, 36(12): 3232-3246. (in Chinese)
doi: 10.31497/zrzyxb.20211216
|
|
|
| [47] |
Mari M, Nadal M, Schuhmacher M, et al. 2010. Application of self organizing maps for PCDD/F pattern recognition of environmental and biological samples to evaluate the impact of a hazardous waste incinerator. Environmental Science & Technology, 44(8): 3162-3168.
doi: 10.1021/es1000165
|
|
|
| [48] |
Marshall J A, Sklar L S. 2012. Mining soil databases for landscape-scale patterns in the abundance and size distribution of hillslope rock fragments. Earth Surface Processes & Landforms, 37(3): 287-300.
|
|
|
| [49] |
Martínez-Zavala L, Jordán A. 2010. Effect of rock fragment cover on interrill soil erosion from bare soils in Western Andalusia, Spain. Soil Use and Management, 24(1): 108-117.
doi: 10.1111/sum.2008.24.issue-1
|
|
|
| [50] |
Melo D S, Gontijo E S, Gontijo D, et al. 2019. Self-organizing maps for evaluation of biogeochemical processes and temporal variations in water quality of subtropical reservoirs. Water Resources Research, 55(12): 10268-10281.
doi: 10.1029/2019WR025991
|
|
|
| [51] |
Mu Y, Wang F, Zheng B Y, et al. 2018. McGET: A rapid image-based method to determine the morphological characteristics of gravels on the Gobi desert surface. Geomorphology, 304: 89-98.
doi: 10.1016/j.geomorph.2017.12.027
|
|
|
| [52] |
Nakagawa K, Yu Z, Berndtsson R, et al. 2020. Temporal characteristics of groundwater chemistry affected by the 2016 Kumamoto earthquake using self-organizing maps. Journal of Hydrology, 582: 124519, doi: 10.1016/j.jhydrol.2019.124519.
doi: 10.1016/j.jhydrol.2019.124519
|
|
|
| [53] |
Nguyen T T, Kawamura A, Tong T N, et al. 2015. Clustering spatio-seasonal hydrogeochemical data using self-organizing maps for groundwater quality assessment in the Red River Delta, Vietnam. Journal of Hydrology, 522: 661-673.
doi: 10.1016/j.jhydrol.2015.01.023
|
|
|
| [54] |
Nrpa B, Kala B, Ms C, et al. 2019. Lithology and coarse fraction adjusted bulk density estimates for determining total organic carbon stocks in dryland soils. Geoderma, 337: 844-852.
doi: 10.1016/j.geoderma.2018.10.036
|
|
|
| [55] |
Okin G S, Painter T H. 2003. Effect of grain size on remotely sensed spectral reflectance of sandy desert surfaces. Remote Sensing of Environment, 89(3): 272-280.
doi: 10.1016/j.rse.2003.10.008
|
|
|
| [56] |
Pang B, Ma X X, Hong J T, et al. 2022. Acquisition pattern of nitrogen by microorganisms and plants affected by gravel mulch in a semiarid Tibetan grassland. Science of the Total Environment, 830: 154635, doi: 10.1016/j.scitotenv.2022.154635.
doi: 10.1016/j.scitotenv.2022.154635
|
|
|
| [57] |
Poesen J W, Wesemael B V, Bunte K, et al. 1998. Variation of rock fragment cover and size along semiarid hillslopes: a case-study from southeast Spain. Geomorphology, 23(2-4): 323-335.
doi: 10.1016/S0169-555X(98)00013-0
|
|
|
| [58] |
Qian G Q, Dong Z B, Luo W Y, et al. 2014. Gravel morphometric analysis based on digital images of different Gobi surfaces in Northwestern China. Journal of Desert Research, 34(3): 625-633. (in Chinese)
|
|
|
| [59] |
Qin Y, Yi S H, Chen J J, et al. 2015. Effects of gravel on soil and vegetation properties of alpine grassland on the Qinghai-Tibetan Plateau. Ecological Engineering, 74: 351-355.
doi: 10.1016/j.ecoleng.2014.10.008
|
|
|
| [60] |
Reigner I C, Phillips J J. 1964. Variations in bulk density and moisture content within two New Jersey coastal plain soils, lake land and Hurst sands. Soil Science Society of America Journal, 28(2): 287-289.
doi: 10.2136/sssaj1964.03615995002800020045x
|
|
|
| [61] |
Rostagno C M, Degorgue G. 2011. Desert pavements as indicators of soil erosion on aridic soils in north-east Patagonia (Argentina). Geomorphology, 134(3-4): 224-231.
doi: 10.1016/j.geomorph.2011.06.031
|
|
|
| [62] |
Russo D. 1983. Leaching characteristics of a stony desert soil. Soil Science Society of America Journal, 47(3): 431-438.
doi: 10.2136/sssaj1983.03615995004700030008x
|
|
|
| [63] |
Salisbury J W, D'Aria D M. 1992. Infrared (8-14 μm) remote sensing of soil particle size. Remote Sensing of Environment, 42(2): 157-165.
doi: 10.1016/0034-4257(92)90099-6
|
|
|
| [64] |
Simanton J R, Renard K G, Christiansen C M, et al. 1994. Spatial distribution of surface rock fragments along catenas in semiarid Arizona and Nevada, USA. CATENA, 23(1-2): 29-42.
doi: 10.1016/0341-8162(94)90051-5
|
|
|
| [65] |
Tripathy S, Bhattacharyya P, Mohapatra R, et al. 2014. Influence of different fractions of heavy metals on microbial ecophysiological indicators and enzyme activities in century old municipal solid waste amended soil. Ecological Engineering, 70: 25-34.
doi: 10.1016/j.ecoleng.2014.04.013
|
|
|
| [66] |
Villmann T. 1999. Topology preservation in self-organizing maps. Kohonen Maps, 27(2): 279-292.
|
|
|
| [67] |
Vilmi A, Tolonen K T, Karjalainen S M, et al. 2019. Niche position drives interspecific variation in occupancy and abundance in a highly-connected lake system. Ecological Indicators, 99: 159-166.
doi: 10.1016/j.ecolind.2018.12.029
|
|
|
| [68] |
Wang C P, Huang M T, Zhai P M. 2021. Change in drought conditions and its impacts on vegetation growth over the Tibetan Plateau. Advances in Climate Change Research, 12(3): 333-341.
doi: 10.1016/j.accre.2021.04.004
|
|
|
| [69] |
Wang J S, Zhang X Z, Zhao Y P, et al. 2010. Spatiotemporal pattern of alpine grassland productivity in Qiangtang Plateau. Chinese Journal of Applied Ecology, 21(6): 1400-1404. (in Chinese)
|
|
|
| [70] |
Wang K, Wang P, Zhang R, et al. 2020. Determination of spatiotemporal characteristics of agricultural non-point source pollution of river basins using the dynamic time warping distance. Journal of Hydrology, 583: 124303, doi: 10.1016/j.jhydrol.2019.124303.
doi: 10.1016/j.jhydrol.2019.124303
|
|
|
| [71] |
Wehrens R, Buydens L. 2007. Self- and super-organizing maps in R: The kohonen package. Journal of Statistical Software, 21(5): 1-19.
|
|
|
| [72] |
Wongravee K, Lloyd G, Silwood C, et al. 2010. Supervised self organization maps for classification and determination of potentially discriminatory variables: Illustrated by application to nuclear magnetic resonance metabolomic profiling. Analytical Chemistry, 82: 628-638.
doi: 10.1021/ac9020566
pmid: 20038089
|
|
|
| [73] |
Wu X D, Zhao L, Fang H B, et al. 2011. Soil enzyme activities in permafrost regions of the western Qinghai-Tibetan Plateau. Soil Science Society of America Journal, 76(4): 1280-1289.
doi: 10.2136/sssaj2011.0400
|
|
|
| [74] |
Wu Y Z, Gong P, Liu Q, et al. 2009. Retrieving photometric properties of desert surfaces in China using the Hapke model and MISR data. Remote Sensing of Environment, 113(1): 213-223.
doi: 10.1016/j.rse.2008.09.006
|
|
|
| [75] |
Xiang Q, Yu H, Chu H L, et al. 2022. The potential ecological risk assessment of soil heavy metals using self-organizing map. Science of the Total Environment, 843: 156978, doi: 10.1016/j.scitotenv.2022.156978.
doi: 10.1016/j.scitotenv.2022.156978
|
|
|
| [76] |
Yamanaka T, Inoue M, Kaihotsu I. 2004. Effects of gravel mulch on water vapor transfer above and below the soil surface. Agricultural Water Management, 67(2): 145-155.
doi: 10.1016/j.agwat.2004.01.002
|
|
|
| [77] |
Yang J, Mi R, Liu J. 2009. Variations in soil properties and their effect on subsurface biomass distribution in four alpine meadows of the hinterland of the Tibetan Plateau of China. Environmental Geology, 57(8): 1881-1891.
doi: 10.1007/s00254-008-1477-8
|
|
|
| [78] |
Yao A D, Cao X Y, Feng Y M. 2014. Remote-sensing model for estimating the size of Gobi surface gravel based on principal components analysis. Journal of Desert Research, 34(5): 1215-1221. (in Chinese)
|
|
|
| [79] |
Yu Q L, Tang C A, Tang S B. 2007. Digital image based characterization method of rocks heterogeneity and its primary application. Chinese Journal of Rock Mechanics and Engineering, 26(3): 551-559. (in Chinese)
|
|
|
| [80] |
Zhan Z Z, Huang Y H, Jiang F S, et al. 2017. Effects of content and size of gravel on soil permeability of the colluvial deposit in Benggang. Journal of Soil and Water Conservation, 31(3): 85-90, 95. (in Chinese)
|
|
|
| [81] |
Zhang S Q, Jiang H C, Fan J W, et al. 2021. Accumulation of a last deglacial gravel layer at Diexi, Eastern Tibetan Plateau and its possible seismic significance. Frontiers in Earth Science, 9: 797732, doi: 10.3389/FEART.2021.797732.
doi: 10.3389/FEART.2021.797732
|
|
|
| [82] |
Zhong H R, Cheng Y H, Lin M X, et al. 2019. Lithology identification of complex carbonate based on SOM and fuzzy recognition. Lithologic Reservoirs, 31(5): 84-91. (in Chinese)
|
|
|
|
Viewed |
|
|
|
Full text
|
|
|
|
|
Abstract
|
|
|
|
|
Cited |
|
|
|
|
| |
Shared |
|
|
|
|
| |
Discussed |
|
|
|
|