

 ,
, Most remote sensing studies assess the desertification using vegetation monitoring method. But it has the insufficient precision of vegetation monitoring for the limited vegetation cover of the desertification region. Therefore, it offers an alternative approach for the desertification research to assess sand dune and sandy land change using remote sensing in the desertification region. In this study, the indices derived from the well-known tasseled cap transformation (TCT), tasseled cap angle (TCA), disturbance index (DI), process indicator (PI), and topsoil grain size index (TGSI) were integrated to monitor and assess the desertification at the thirteen study sites including sand dunes and sandy lands distributed in the Mongolian Plateau (MP) from 2000 to 2015. A decision tree was used to classify the desertification on a regional scale. The average overall accuracy of 2000, 2005, 2010 and 2015 desertification classification was higher than 90%. Results from this study indicated that integration of the advantages of TCA, DI and TGSI could better assess the desertification. During the last 16 years, Badain Jaran Desert, Tengger Desert, and Ulan Buh Desert showed a relative stabilization. Otindag Sandy Land and the deserts of Khar Nuur, Ereen Nuur, Tsagan Nuur, Khongoryn Els, Hobq, and Mu Us showed a slow increasing of desertification, whereas Bayan Gobi, Horqin and Hulun Buir sandy lands showed a slow decreasing of desertification. Compared with the other 11 sites, the fine sand dunes occupied the majority of the Tengger Desert, and the coarse sandy land occupied the majority of the Horqin Sandy Land. Our findings on a three or four years’ periodical fluctuated changes in the desertification may possibly reflect changing precipitation and soil moisture in the MP. Further work to link the TCA, DI, TGSI, and PI values with the desertification characteristics is recommended to set the thresholds and improve the assessment accuracy with field investigation.
Desertification poses serious ecological, environmental, and socio-economic threats to the world. It directly affects 2.5×10⁸ people and one-third of the Earth’s surface (over 4.0×10⁷ km2; UNCCD, 2016a). According to the definition put forward by the United Nations Convention to Combat Desertification (UNCCD) in 1994, desertification is land degradation in arid, semi-arid, and dry sub-humid areas due to climatic variation and human intervention. The Asian continent is occupied by approximately 1.7×10⁷ km2 of arid, semi-arid, and dry sub-humid lands and desertification manifests itself in many different forms, such as the expanding deserts in China, Mongolia, India, Iran, and Pakistan (UNCCD, 2016b). As the second largest plateau in Asia, the Mongolian Plateau (MP) consists primarily of the Inner Mongolia Autonomous Region of China (IMAR, a total area of 1.18×10⁶ km2) and the entire territory of Mongolia (a total area of 1.57×10⁶ km2; Fang et al., 2015). Approximately 90% of Mongolia’s territory is occupied by hyper-arid, arid, semi-arid, and dry sub-humid areas, and roughly 72% of the country is vulnerable to desertification (Yu et al., 2013; Eckert et al., 2015). In the IMAR, 60% of the land area is occupied by arid, semi-arid, and dry sub-humid areas and suffers from desertification (Ci and Wu, 1997). Over the past few decades, rapid growth of the population and livestock, urbanization, and mining have exacerbated the difficulty in mitigating desertification faced by the government of China and Mongolia. Therefore, there is an urgent need to understand and control the desertification in terms of its status, trend, and drivers. The most effective way to achieve this is to monitor and map the desertification processes (Xiao et al., 2006; Albalawi and Kumar, 2013).
Traditional desertification monitoring approaches from a site-specific perspective make it difficult to understand the spatial extent of the desertification (Collado et al., 2002; Lam et al., 2010). Remote sensing, with the ability to rapidly and reliably collect data over wide areas, has been applied to monitor and assess desertification and its dynamic processes (Cui et al., 2006; Albalawi and Kumar, 2013). Changing vegetation and land use are the most common indicators used by many scholars to monitor desertification (Albalawi and Kumar, 2013). Generally, changes in vegetation are the most direct indicator of desertification (land degradation), and can reflect the dynamic processes of desertification (Yang et al., 2005; Xu et al., 2009). Image-based vegetation indices such as the normalized difference vegetation index (NDVI), soil adjusted vegetation index (SAVI), modified SAVI (MSAVI), enhanced vegetation index (EVI), vegetation temperature condition index (VTCI), and optimized vegetation index (OPVI), were most commonly used for monitoring the vegetation conditions in desertification assessment (Cui et al., 2006; Xu et al., 2009; Yu et al., 2013). In addition, some indices that can reflect spatial heterogeneity, such as the land surface temperature (LST), land surface albedo, land surface water index (LSWI), moving standard deviation index (MSDI), and rain use efficiency (RUE), are also used to assess desertification. In Mongolia, trend analysis of MODIS NDVI time series data is used to detect areas of vegetation change to monitor land degradation and regeneration areas (Eckert et al., 2015). The combination of NDVI and field-surveys provides an effective way to monitor desertification on the Mongolian steppes (Sternberg et al., 2011). MODIS NDVI cross-checked with the meteorologically-derived aridity index from 2000 to 2012 identifies a recent contraction of the Gobi in East Asia (Sternberg et al., 2015). Compared with NDVI and EVI, MSAVI2 derived from multi-temporal SPOT-4 VEGETATION data from 1998 to 2001 is found to estimate vegetation biomass and monitor vegetation degradation well on the Mongolian desert steppes (Javzandulam et al., 2005). The VTCI from multi-temporal Landsat-5 images has been used to predict the distribution of vegetation and efficiently monitor desertification in Bulgan, Mongolia (Yu et al., 2013). The NDVI, MSDI, and land surface albedo from Landsat images have been used in conjunction to quantitatively assess the desertification of the Ordos Plateau, China in 1980, 1990, and 2000 (Xu et al., 2009). The topsoil grain size index (TGSI) is proposed based on the field spectral reflectance measurements and laboratory physical analysis of topsoil grain composition to detect desertification in Siziwang Banner, IMAR (Xiao et al., 2006). Integrated desertification assessment conducted by combining NDVI, TGSI, and land surface albedo from Landsat images indicated a difference of 87% in the desertification area in Hogno Khaan nature reserve in central Mongolia between 1990 and 2011 (Lamchin et al., 2016). The total accuracy of all Landsat MSS-derived vegetation indices (NDVI and SAVI) for desertification mapping of the Horqin Sandy Land, IMAR, is approximately 48% (Bremborg, 1996). The MSAVI variation is not sufficient to assess the land degradation process, which indicates that the vegetation greenness alone is not a major indicator of land degradation assessment in the Gobi-Altai province in western Mongolia (Vova et al., 2015). Land use and land cover change (LUCC) has been accepted widely as a primary driver for ecosystem degradation worldwide and become a key research topic in desertification. A full-year 2000 time-series of SPOT VEGETATION images with 1 km spatial resolution has been used to produce a land cover map to detect sparse vegetation as an indicator of areas at risk of desertification in North China, including the Gobi desert (Huang and Siegert, 2006). Based on a GIS approach, researchers performed land desertification monitoring and assessment in Yulin, Northwest China using spatial patterns from land cover classes, Landsat NDVI, and the prevailing wind direction (Zhang et al., 2008). The status, rate, and causes of the development of desertification in the Mu Us Sandy Land, northern China, has been analyzed based on land cover change from the 1950s to 1990s (Wu and Ci, 2002). The spatial and temporal dynamics of land use and land cover associated with land degradation and desertification in the Mu Us Sandy Land, China have been analyzed using NDVI and albedo through the change vector analysis technique (Karnieli et al., 2014). Monitoring changes in vegetation and land use is not the only method available to quantify desertification (Kawamura and Akiyama, 2010; Albalawi and Kumar, 2013). Some scholars criticize using vegetation cover to detect desertification (Shafie et al., 2012). It is also noteworthy that in the Gobi desert, the NDVI must be verified with a ground-based investigation due to the insufficient precision of the NDVI value for such limited vegetation cover (Lam et al., 2010; Sternberg et al., 2011; Zhao et al., 2015). Currently, it is not feasible to obtain field data and carry out ground-based investigations due to the remoteness and very large area of the MP (Sternberg, 2012).
Sandy desertification is one of the main forms of land degradation in the MP, especially in northern China (Elhadi et al., 2009; UNCCD, 2016b). Desert area covers 14.3% of Mongolia (Yang et al., 2004), and 40.0% of the IMAR in China (John et al., 2008); this has been steadily expanding since the 1950s (Eltahir et al., 2009). The inclusion of sand dune encroachment in desertification monitoring would greatly improve the accuracy in the prediction criteria of risk-prone areas (Lam et al., 2010; El-Magd et al., 2013). It has been found that sand dune encroachment can be effectively monitored through comparison of multi-temporal satellite images based on visual interpretation; differences in spectral brightness, land surface albedo, and temperature; image subtraction; and supervised and unsupervised classification (Hu et al., 2002; Yao et al., 2007; Hereher, 2010; Lam et al., 2010; Hermas et al., 2012; Hugenholtz et al., 2012). However, compared with several discrete spectral bands or vegetation indices such as NDVI, MSAVI and normalized difference moisture index (NDMI), the tasseled cap brightness (TCB), tasseled cap greenness (TCG) and tasseled cap wetness (TCW) derived from the tasseled cap transformation (TCT), which synthesizes the information contained in several discrete spectral bands into a few components and can associate remotely sensed spectral features with the physical characteristics of land use and land cover classes can yield slightly better results (Jin and Sader, 2005; Lozano et al., 2007; Powell et al., 2010; Czerwinski et al., 2014; Liu et al., 2016).
Recently, the different combinations of the tasseled cap indices such as the disturbance index (DI) and tasseled cap angle (TCA) have been used in forest disturbance detection and land cover change analysis (Masek et al., 2008; Powell et al., 2010; Gómez et al., 2011; Baumann et al., 2014). The DI is a linear combination of the normalized TCB, TCG, and TCW, and was designed to highlight the un-vegetated spectral signatures and separate them from all other vegetation signatures. The DI metric is relatively insensitive to the changes in solar geometry or the bidirectional reflectance distribution function (BRDF) between scenes, and reduces the effect of phenologic variability among images obtained on different dates (Masek et al., 2008). Areas with disturbances have higher DI values. The advantage of the DI is that typically depends on the study region and only requires a threshold to be set. The DI has been used to successfully detect areas of forest disturbance in a wide range of forest biomes and DI=3.0 has been shown to provide the most accurate disturbance map (Baumann et al., 2014). The TCA introduced by Powell et al. (2010) condenses the information of the TCG/TCB ratio to a single value and fundamentally stands for the proportion of vegetated to non-vegetated areas; changes in the proportion of vegetated to non-vegetated areas result in concomitant changes in TCA values. Areas of dense vegetation have high TCA values, while areas of bare soil with no vegetation have negative TCA values (Gómez et al., 2011). The process indicator (PI) is a derivative of the TCA values, and represents the rate of change of TCA values over time. It is appropriate for detecting continuous subtle changes such as natural succession (Gómez et al., 2011). However, to the best of the authors’ knowledge, few studies had been conducted on sand dune encroachment using the TCT technique.
The goal of this study is to characterize the desertification process using the TGSI with the three indices derived from the TCT. Another goal is to use remote sensing data from 2000 to 2015 to assess changes and trends in desertification in the MP as a whole based on the dune and sandy land classification of the decision tree (DT). In this study, thirteen sand dunes (deserts) and sandy lands were selected as the study sites to indicate the desertification processes of the MP as a whole.
The MP is located in the hinterland of temperate Asia and has a total population of about 2.8×10⁷ (0.3×10⁷ for Mongolia and 2.5×10⁷ for IMAR in 2015; Fang et al., 2015). It is dominated by steppe vegetation, including meadows, and typical and desert steppe vegetation (Zhao et al., 2015). It has a hyper-continental climate. The highest annual mean temperature appears in the desert steppe (1.2°C in Mongolia and 5.3°C in the IMAR) and the lowest annual mean temperature is -1.1°C in the desert steppe of Mongolia and 1.9°C in the desert steppe of IMAR (Fang et al., 2015; Zhao et al., 2015). The wind blows from between the northwest and the west for most of the year (Yao et al., 2007; Li, 2011; Karnieli et al., 2014; Lamchin et al., 2016). There are deserts of Badain Jaran, Tengger, Ulan Buh, and Hobq, and sandy lands of Mu Us, Otindag, Horqin, and Hulun Buir in the IMAR (Zha and Gao, 1997; Kawamura and Akiyama, 2010). The Gobi is a vast, large desert region situated on the MP, and covers parts of northern IMAR and southern Mongolia. This study was carried out in Khar Nuur Sand Dune (Site 1), Ereen Nuur Sand Dune (Site 2), Tsagan Nuur Sand Dune (Site 3), Khongoryn Els Sand Dune (Site 4), Khar Khorin and Bayan Gobi (Site 5), Badain Jaran Desert (Site 6), Tengger Desert (Site 7), Ulan Buh Desert (Site 8), Hobq Desert (Site 9), and Mu Us Sandy Land (Site 10), Otindag Sandy Land (Site 11), Horqin Sandy Land (Site 12), and Hulun Buir Sandy Land (Site 13) in the MP (Fig. 1).
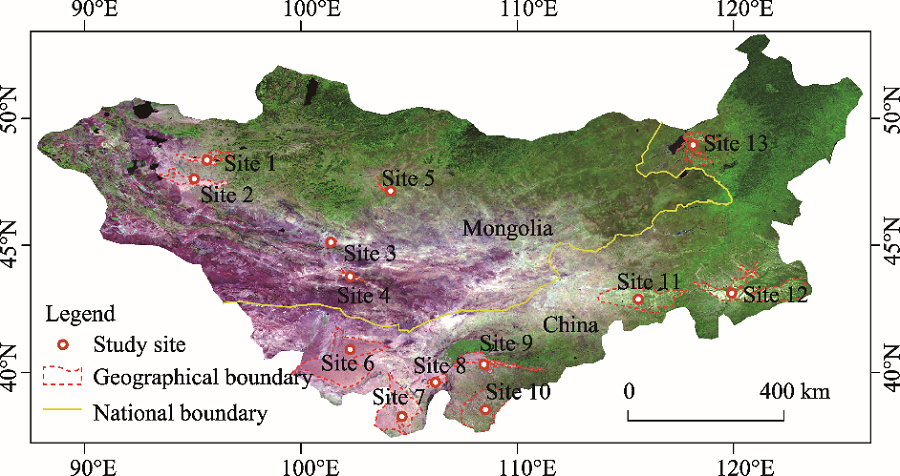
Fig. 1
MODIS mosaic image (2014) for Mongolia Plateau (MP) with locations of deserts and sandy lands. Sites 1-13 are located in the Khar Nuur Sand Dune, Ereen Nuur Sand Dune, Tsagan Nuur Sand Dune, Khongoryn Els Sand Dune, Khar Khorin and Bayan Gobi, Badain Jaran Desert, Tengger Desert, Ulan Buh Desert, Hobq Desert, Mu Us Sandy Land, Otindag Sandy Land, Horqin Sandy Land, and Hulun Buir Sandy Land, respectively.
MODIS Nadir BRDF adjusted reflectance (NBAR) data were obtained from the United States Geological Survey (USGS). Compared with raw reflectance, NBAR data minimizes artifacts in the sample related to variable geometry, and has seven spectral bands comparable to those of Landsat TM, and is a logical choice for tasseled cap extension (Lobser and Cohen, 2007). For this study, the most recent collection 5 MODIS MCD43A4 16-day NBAR product at a spatial resolution of 500 m acquired in August from 2000 to 2015 was freely downloaded from the global visualization interface (GloVis; http://glovis.usgs.gov/). Through mosaicking, projection transformation and cloud removal, a cloud-free dataset covering the study area was analyzed for the period 2000-2015. The TCB, TCG, and TCW are derived from MODIS MCD43A4 data using the tasseled cap coefficients given by Lobser and Cohen (2007).
The TGSI was proposed based on field-based spectral reflectance measurements and laboratory-based physical analysis of topsoil grain composition, which is positively correlated (R2=0.7387) with fine sand content (Xiao et al., 2006). According to the results from Landsat TM/ETM+ (Xiao et al., 2006), a TGSI value close to zero corresponds to vegetation and water bodies. Sometimes, it can even be negative, and areas covered by fine sand (i.e., deserts) have TGSI values near 0.20. The TGSI can be estimated using Equation 1.
$TGSI=\frac{(Rb1-Bb3)}{(Rb1+Bb3+Gb4)}$, (1)
where Rb1, Gb4, and Bb3 are the red, green, and blue bands of the MCD43A4 data, respectively.
The DT is applied to classify the sand dunes and sandy lands, which employs a flowchart-like process to perform multistage classification based on a series of splitting thresholds. DT classification has been used to assess the status of desertification (Xu et al., 2009; Lamchin et al., 2016). With no ground truth data, statistical criteria combined with the opinion of experts were used to detect the sand dunes and sandy lands in the high resolution images acquired for the corresponding years from Google Earth using the variables TCA, DI, and TGSI (Fig. 2). In this study, the land desertification was classified into six grades: none (zero desertification), low sandy land (LSL, low desertification), coarse sandy land (CSL, medium desertification), fine sandy land (FSL, high desertification), coarse sand dune (CSD, severe desertification), and fine sand dune (FSD, severe desertification). After the DT classification, the masks (the rectangle buffers) were created to constrain calculations and analysis to the thirteen study sites.
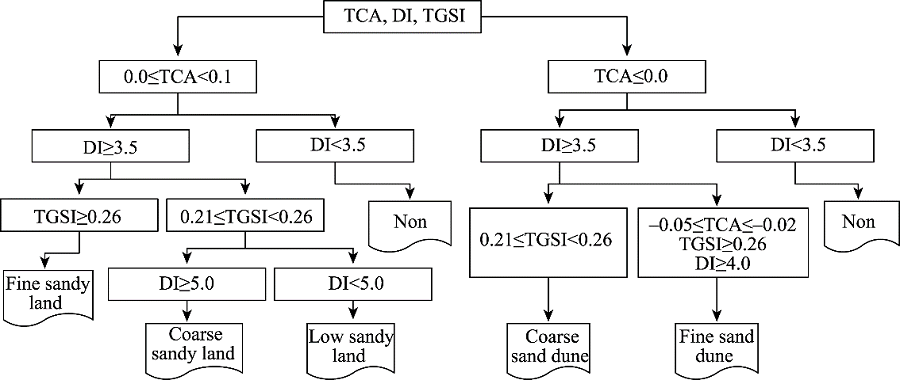
Fig. 2
Decision tree for classifying sandy lands using tasseled cap angle (TCA), disturbance index (DI), and topsoil grain size index (TGSI)
A detailed accuracy assessment of DT classification could not be carried out due to insufficient field data. Informal assessment of accuracy was done by comparing the DT classifications to visualization interpretation of MCD43A4 images, some field photos, and Landsat images and high spatial resolution images acquired for periods corresponding to the classification imagery, and the previous results (Hu et al., 2002; Xu et al., 2009; Guo et al., 2010; Li, 2011; Zhang et al., 2012; Duan et al., 2014; Lamchin et al., 2016; Wang et al., 2017). Because there were not enough field data as the ground truth verification values, 1,4593 random sample pixels (one percent pixels of the thirteen sites) were generated from the DT classification results using the random sampling method respectively. After the random sample pixels were overlaid on the same period Landsat TM/ETM+ and OLI images covered the thirteen sites, the correct and incorrect classification pixels were determined by visual interpretation with the high resolution images from the Google Earth. A confusion matrix was used for accuracy checking of non-desertification and desertification by produce accuracy, user accuracy, overall accuracy and Kappa coefficient.
Figure 3 shows the dynamic changes of TCA (Fig. 3a), DI (Fig. 3b) and TGSI (Fig. 3c) values of the thirteen sites over the last 16 years. At Site 1, the mean TCA values showed a decreasing trend during the periods 2000-2002, 2004-2008, and 2010-2012. The mean DI values showed an increasing trend during the periods 2004-2008 and 2010-2012. The mean values of TGSI of time series images from 2000 to 2015 were between 0.203 and 0.229. Compared with Site 1, extensive desertification occurred at Site 2. The mean TCA values showed a decreasing trend during the periods 2000-2002, 2005-2007, and 2010-2012. The mean DI values showed an increasing trend during the periods 2007-2009 and 2010-2012, indicating a fluctuating change in the conditions of land surface. The mean values of TGSI of time series images from 2000 to 2015 were between 0.217 and 0.232, which showed that the dominant soil particle size of the topsoil had a fluctuating increasing trend of fine sand from 2000 to 2006, and a fluctuating decreasing trend of fine sand from 2006 to 2015. At Site 3, eleven years out of the last 16 years had negative average TCA values, indicating that a low proportion of vegetated to non-vegetated areas were present at Site 2 over the last 16 years. In particular, from 2004 to 2010, all the average TCA values were negative, indicating a persistent desertification. Compared with Site 1 and Site 2, a high proportion of the desertification
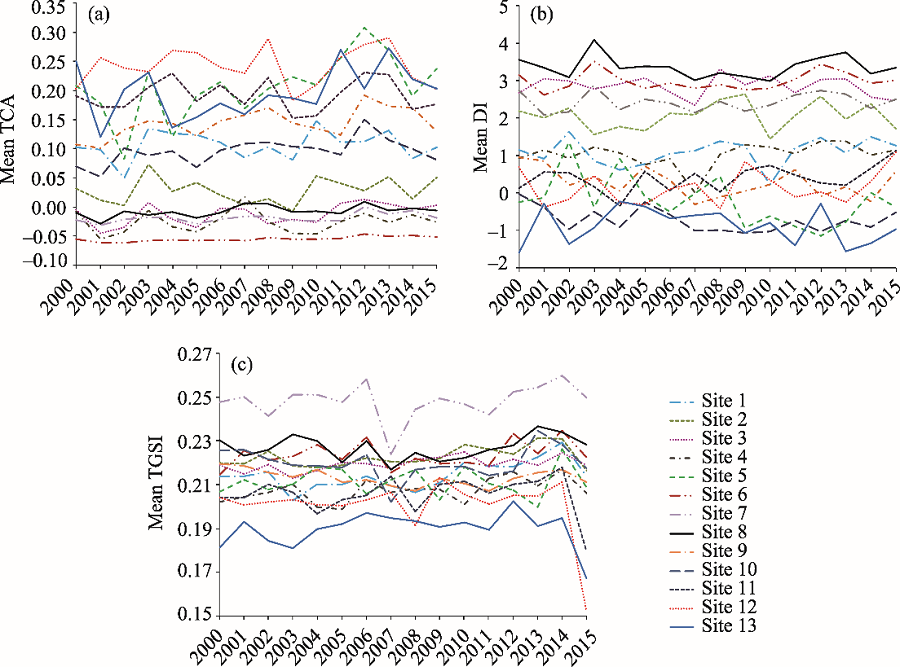
Fig. 3
Dynamic changes of TCA, DI and TGSI values of the thirteen sites from 2000-2015
occurred at Site 3. The mean DI values showed an increasing trend from 2003 and 2011 to 2005 and to 2013, and a decreasing trend during the periods 2001-2003, 2005-2007, and 2013-2015, respectively. The mean values of TGSI of time series images from 2000 to 2015 were between 0.213 and 0.225. At Site 4, the average TCA values were negative in the fifteen years out of the last 16, indicating that a low proportion of vegetated to non-vegetated areas were presented at the site during these years. In particular, the average TCA values were close to -0.05 in 2001, 2002, 2005, 2009, and 2010, indicating a lower proportion of vegetated to non-vegetated areas existed during these years. During the last 16 years, the mean DI values were near 1.0, indicating a low proportion of sand dunes and sandy lands present at Site 4. The mean values of TGSI of time series images from 2000 to 2015 showed a slightly increasing trend during the periods 2000-2003 and 2010-2012, and a slightly decreasing trend from 2003 to 2005. At Site 5, the average TCA values were positive at all time periods because sand dunes and sandy lands accounted for a small portion of the landscape at the site where the mean TCA values showed a decreasing trend during the periods 2000-2002 and 2012-2014, and an increasing trend during the periods 2004-2006, 2007-2009, and 2010-2012. The average DI values werer negative in the twelve years out of the last 16 years, indicating a low proportion of sand dune and sandy lands at Site 5. The mean values of TGSI of time series images from 2000 to 2015 were 0.200-0.226, and showed a slightly increasing trend during the periods 2002-2004 and 2006-2008, and a slightly decreasing trend during the periods 2004-2006 and 2010-2013.
At Site 6 in the Badain Jaran Desert, the average TCA values were negative at the whole period 2000-2015, indicating a high proportion of the presence of non-vegetated to vegetated areas. The average TCA values were all near -0.05 and the standard deviations of TCA values were relatively low for the entire period, indicating a relative stabilization of the landscapes. The mean DI values were highly positive for the whole period, indicating a relative high temperature, low moisture and sparse vegetation compared to the five abovementioned sites. The mean values of TGSI of time series images from 2000 to 2015 were 0.215-0.235. Unlike the five abovementioned sites, for most image dates, the distribution of pixels with different TGSI values was bimodal, indicating that the soil particles were sorted by size into the fine and coarse grains, with the majority of the particles being coarse grains. At Site 7 in the Tengger Desert, the average TCA values were negative for the period 2000-2015 except for the year 2012, indicating a high proportion of non-vegetated to vegetated areas. The mean DI values were highly positive for the period, indicating a relative high temperature, low moisture and sparse vegetation in the desert. The mean values of TGSI of time series images from 2000 to 2015 were 0.241-0.260. Compared with the six abovementioned sites, the mean TGSI values were the highest, indicating more fine sands in the desert. At Site 8, the mean values of TCA were less than 0.01, indicating a high proportion of non-vegetated to vegetated areas in the Ulan Buh Desert. The mean DI values were highly positive for the study period, indicating a relative high temperature, low moisture, and sparse vegetation in the desert. The mean values of TGSI of time series images from 2000 to 2015 were 0.217-0.237. It is interestingly noted that compared with the Tengger Desert, the mean values of TGSI were more like that of the Badain Jaran Desert. At Site 9, the mean values of TCA were more than 0.01 because sand dunes and sandy lands accounted for a small portion of the landscape. In the twelve years out of the last 16 years, the average DI had positive values, indicating a relatively high temperature and low moisture in the Hobq Desert. The mean values of TGSI of time series images from 2000 to 2015 were 0.207-0.220. The distribution of pixels with different TGSI values was bimodal, indicating that the soil particles were sorted by size into fine and coarse grains, with a majority of the grains being coarse grained. At Site 10, the mean TCA values showed an increasing trend from 2005 to 2008 and a decreasing trend during the periods 2008-2011 and 2012-2015, indicating a decreasing change with periodical fluctuations in the proportion of vegetation to non-vegetation. The mean DI values were negative at all time periods, indicating a relatively high vegetation cover in the Mu Us Sandy Land. The mean values of TGSI of time series images from 2000 to 2015 were 0.202-0.235. At Site 11, the average TCA values were more than 0.15 for the study period, indicating a relatively high vegetation cover in the Otindag Sandy Land. The mean TCA values showed an increasing trend during the periods 2001-2004 and 2009-2012, indicating a periodically fluctuating increasing change in the proportion of vegetated to non-vegetated areas. The mean TCA values showed a decreasing trend from 2012 to 2014, indicating a slow decreasing change in the proportion of vegetated to non-vegetated areas. Fifteen of the last 16 years had low positive values of the average DI which may have been due to the presence of water bodies and sparse vegetation in the Otindag Sandy Land. The mean values of TGSI of time series images from 2000 to 2015 were between 0.180 and 0.218, and showed an increasing trend during the periods 2004-2007, 2008-2010, and 2011-2014, indicating a periodically fluctuating increase in the proportion of fine grained to coarse grained particles of the topsoil. At Site 12, the minimum mean TCA of time series images from 2000 to 2015 was in 2009, the average TCA values were more than 0.18 for the whole period, indicating a relatively high vegetation cover in the Horqin Sandy Land. The mean TCA values showed an increasing trend from 2009 to 2013, indicating a periodically fluctuating increasing change in the proportion of vegetated to non-vegetated areas. The mean TCA values showed a decreasing trend during the periods 2001-2003, 2004-2007, and 2013-2015, indicating a slow decreasing change in the proportion of vegetation to non-vegetation. Seven years out of the last 16 years had low negative values of the average DI, which may be caused by sparse water bodies and vegetation in the Horqin Sandy Land. The mean values of TGSI of time series images from 2000 to 2015 were 0.192-0.213. At Site 13, the average TCA values were more than 0.12 for the study period, indicating a relatively high vegetation cover in the Hulun Buir Sandy Land. The mean DI values were negative for the period, which may be due to the presence of sparse water bodies and vegetation in the Hulun Buir Sandy Land. The mean values of TGSI of time series images from 2000 to 2015 were 0.167-0.203. Compared with Horqin Sandy Land, the coarse sand content of the topsoil was more than that in the Hulun Buir Sandy Land.
Although the mean TGSI of all thirteen sites showed a slight fluctuation, the mean TGSI values did not show a significant change over the period 2000-2015, indicating a relative stabilization in the soil grain size of the topsoil for the MP.
The average PI value represents the global status of change, and can be used to discover trends in the study area through evaluation of the average PI at consecutive dates (Gómez et al., 2011). For most image dates, the distribution of pixels with different PI values was unimodal. The PI values were divided into five groups to explore the desertification change patterns. The stable group with near zero PI described areas with no changes in the proportion of non-vegetated to vegetated areas. According to the mean and standard deviation of PI at all dates, group thresholds (approximately the mean±two standard deviations) were determined: the PI value of the slow increase group (i.e., under slow desertification) ranged from -0.05 to 0.00, and the PI value of the slow decrease group (i.e., under slow restoration) ranged from 0.00 to 0.05. The pixels with PI values less than -0.05 were sorted into the fast increase group (i.e., in a rapid desertification), and the pixels with PI greater than 0.05 were sorted into the fast decrease group (i.e., in a rapid restoration).
Figure 4 shows the dynamic changes of the PI values of the thirteen sites over the last 16 years. At Site 1, nine years out of the last 16 years had low negative average PI values. In particular, the average PI values were negative from 2004 to 2008, indicating a slow increasing rate in the proportion of non-vegetated to vegetated areas, i.e., desertification. The mean PI values in 2004, 2005, 2007, 2008 and 2012 were close to zero, indicating a relative stabilization during these years. At Site 2, ten years out of the last 16 years had negative average PI values. The average PI values were negative from 2004 to 2008, indicating a slow increasing rate in the proportion of non-vegetated to vegetated areas, i.e., desertification. It should be noted that a significant change in restoration occurred in 2002 and 2010. The mean PI values in 2005, 2007, 2008, 2012, 2013 and 2014 were close to zero, indicating relative stability during these years. At Site 3, eight years out of the last 16 years had negative values in the average PI. The average PI values were positive from 2009 to 2011, indicating a slow decreasing rate in the proportion of non-vegetated to vegetated areas, whereas the average PI values were negative from 2012 to 2014, indicating a slow increasing rate in the proportion of non-vegetated to vegetated areas. The mean PI values in 2003, 2005, 2008, 2009, 2012, 2013 and 2014 were close to zero, indicating a relative stabilization during these years. At Site 4, nine years out of the last 16 years had negative average PI values. The average PI values were negative from 2007 to 2009, indicating a slow increasing rate in the proportion of non-vegetated to vegetated areas. The mean PI values in 2003, 2005, 2007, 2012, 2013 and 2014 were close to zero, indicating relative stability during these years. At Site 5, ten years out of the last 16 years had positive average PI values. The average PI values were positive from 2008 to 2012, indicating a slow decreasing rate in the proportion of non-vegetated to vegetated areas. The mean PI values in 2007, 2009, and 2010 were close to zero, indicating relative stability of the landscape during these years. The mean PI values in 2001 and 2013 were near -0.05, indicating a relative rapid desertification during these years. The mean PI values in 2005 and 2011 were near 0.05, indicating a relative rapid change toward restoration during these years. For sites 1-5, the pixels in the fast increase and decrease groups were relatively infrequent during the study period, and the pixels in the slow increase and decrease groups were normally frequent.
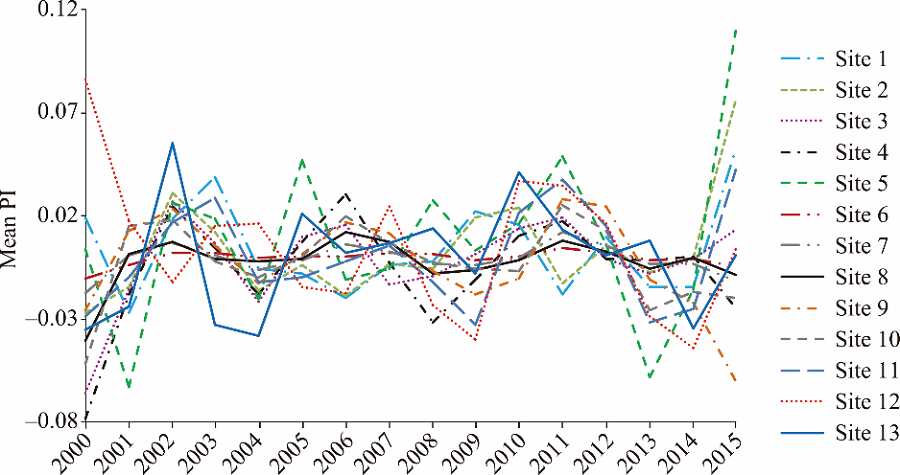
Fig. 4
Dynamic changes of the process indicator (PI) values of the thirteen sites from 2000-2015
At Site 6, nine years out of the last 16 years had positive average PI values, indicating a slow decreasing rate in the proportion of non-vegetated to vegetated areas. However, the mean PI values were close to zero, indicating a relative stability of the Badain Jaran Desert over the last 16 years. At Site 7, nine years out of the last 16 years had negative average PI values, indicating a slow increasing rate in the proportion of non-vegetated to vegetated areas. However, the mean PI values were all close to zero, indicating relative stability of the Badain Jaran Desert over the last 16 years. At Site 8, ten years out of the last 16 years had negative average PI values, indicating a slow increasing rate in the proportion of non-vegetation to vegetation. However, the mean PI values were all close to zero, indicating relative stability of the Ulan Buh Desert during the last 16 years. At Site 9, eight years out of the last 16 years had negative values in the average PI, indicating a slow increasing rate in the proportion of non-vegetated to vegetated areas. The mean PI values in 2003, 2005 and 2008 were close to zero, indicating relative stability during these years. At Site 10, nine years out of the last 16 years had the negative average PI values, indicating a slow increasing rate in the proportion of non-vegetated to vegetated areas. The mean PI values were close to zero during the periods 2003-2005, and 2007-2010, indicating a relative stabilization during these years. At Site 11, nine years out of the last 16 years had the negative average PI values, indicating a slow increasing rate in the proportion of non-vegetated to vegetated areas. The mean PI values were close to zero in 2001, and 2005 to 2007, indicating a relative stabilization during these years. At Site 12, nine years out of the last 16 years had positive values in the average PI, indicating a slow decreasing rate in the proportion of non-vegetated to vegetated areas. At Site 13, ten years out of the last 16 years had positive average PI values, indicating a slow decreasing rate in the proportion of non-vegetated to vegetated areas. The mean PI values were close to zero in 2006, 2007, 2009, 2011, and 2012, indicating relative stability during these years. For sites 6-13, the pixels in the slow increase and decrease group were more common during the majority of the study period.
The 500 m pixels of MCD43A4 products represent a mixture of land cover classes that influence the spectral ranges, and other objects (such as the Gobi desert, and barren lands) with similar TCA, DI and TGSI as sand dunes and sandy lands, which could also create some errors. Through the buffer set on the study site, the DT classification errors could be reduced partly. The same period Landsat TM/ETM+ (fifty-two Landsat 5 TM and five Landsat 7 ETM+ images) and OLI images (nineteen Landsat 8 OLI images) covered the thirteen sites (Site 1, path/row 139/26 and 138/27; Site 2, path/row 139/27 and 138/27; Site 3, path/row 134/29; Site 4, path/row 133/30; Site 5, path/row 133/27; Site 6, path/row 133/32 and 132/32; Site 7, path/row 130/33; Site 8, path/row 130/32; Site 9, path/row 129/32 and 128/32; Site 10, path/row 128/32 and 128/33; Site 11, path/row 124/30 and 125/30; Site 12, path/row 121/30 and 122/30; Site 13, path/row 124/26), which were used to evaluate the DT classification. As Table 1 showed, the overall Kappa coefficient and overall accuracy values of the DT classification results were 0.7759 and 91.71%, 0.7659 and 90.71%, 0.7737 and 91.71%, 0.7649 and 90.44% in 2000, 2005, 2010, and 2015, respectively, which reflected the overall classification situation. TGSI is a key factor for classifying the desertification into CSL, FSL, CSD, and FSD. Compared with the grain size analysis results of the deposits in the Badian Jaran-Tengger Deserts (Li, 2011), it showed that TGSI was a good indicator for the grain size analysis of the surface deposits, which indirectly indicated that the desertification classification of this paper was credible. In addition, the desertification maps derived from the DT classification were comparable to the desertification map of Mu Us Sandy Land in 2000 and 2010 (Xu et al., 2009; Wang et al., 2017), Horqin Sandy Land in 1999, 2000, and 2010 (Hu et al., 2002; Zhang et al., 2012; Duan et al., 2014), Hulun Buir Sandy Land in 2000 and 2006 (Guo et al., 2010), and Khar Khorin and Bayan Gobi in 2002 and 2011 (Lamchin et al., 2016), which could provide the reliability of the classes of interest and could be employed to assess the desertification on a regional scale. Due to the excessive number of tables and figures for the thirteen sites for the last 16 years, we will only show the desertification map of the thirteen sites in 2015 (Fig. 5), and for the annual changes of the main sand dune of Site 3 from 2000 to 2015 (Fig. 6).
Table 1
Accuracy analysis for desertification for the thirteen study sites in 2000, 2005, 2010, and 2015
From 2000 to 2015, it is clear that most of the study sites showed fluctuating trends of desertification, and not a monotonic increase. The area of desertification of Site 1 (20.6% of the total area), Site 2 (34.0% of the total area), Site 3 (51.1% of the total area), Site 6 (65.7% of the total area) and Site 7 (68.1% of the total area) was the highest in 2012. The area of desertification of the Site 4 (18.3% of the total area), Site 5 (5.6% of the total area), Site 8 (55.2% of the total area), Site 9 (15.6% of the total area), Site 10 (13.4% of the total area) , Site 11 (21.6% of the total area), Site 12 (20.0% of the total area), and Site 13 (3.8% of the total area) was at the highest in 2001, 2002, 2003, 2003, 2000, 2005, 2009, and 2004, respectively.
Figure 6 shows the annual changes of the main sand dune in Site 3 over the last 16 years. In 2001, total area of desertification was at its maximum, indicating the occurrence of a severe drought in 2001. The total desertification area and the area of coarse sand dune showed an increasing trend from 2003 to 2005, and decreasing trends in 2001-2003, 2005-2007, 2008-2011, and 2012-2015; and the overall trend was slow down from 2000 to 2015 (Fig. 6a). Figure 6b indicated a fluctuating increasing trend of the area of low sandy land, fine sandy land and fine sand dune. The southwest and northeast parts of the main sand dune underwent fluctuating changes over the last 16 years.
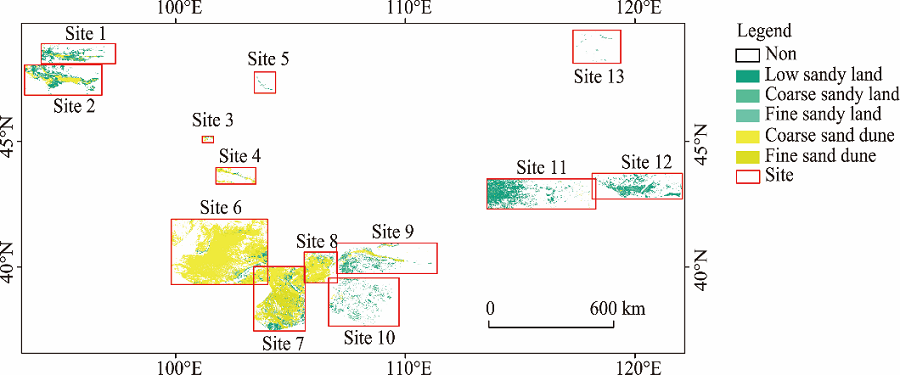
Fig. 5
Desertification map of the thirteen sites in 2015

Fig. 6
Annual area changes of the main sand dune in Site 3 for the period 2000-2015. Total, total desertification area; CSD, coarse sand dune (severe desertification); LSL, low sandy land (low desertification); FSD, fine sand dune (severe desertification); FSL, fine sandy land (high desertification).
For sand dunes and deserts, the coarse sand dunes and the fine sand dunes occupied the majority of the desertified area. The areas of the coarse sand dune and the fine sand dune were at their highest in 2008 (6.2% of the total area) and 2013 (1.5% of the total area) at Site 1, in 2009 (20.4% of the total area) and 2013 (3.3% of the total area) at Site 2, in 2008 (42.4% of the total area) and 2005 (0.9% of the total area) at Site 3, in 2001 (15.4% of the total area and 2.6% of the total area respectively) at Site 4, in 2003 (54.2% of the total area) and 2012 (8.7% of the total area) at Site 6, in 2007 (41.9% of the total area) and 2006 (26.1% of the total area) at Site 7, in 2003 (51.3% of the total area) and 2013 (12.8% of the total area) at Site 8, in 2001 (8.2% of the total area) and 2003 (2.2% of the total area) at Site 9, respectively. For the sandy lands, the low sandy land, coarse sandy land, and fine sandy land occupied the majority of the desertified area. The areas of the low sandy land and the fine sandy land were the highest in 2002 (5.3% of the total area) and 2004 (1.7% of the total area) at Site 5, in 2000 (7.7% of the total area and 3.8% of the total area) at Site 10, in 2014 (7.8% of the total area) and 2004 (1.7% of the total area) at Site 11, respectively. However, the areas of the low sandy land and the coarse sandy land were the highest in 2009 (14.6% of the total area) and 2000 (5.7% of the total area) at Site 12, and in 2004 (3.4% of the total area and 0.3% of the total area at Site 13, respectively).
The TCA value describes the proportion of vegetated to non-vegetated areas. The TCA used in this study is a valuable parameter for the discrimination of sand dune, sandy land, and vegetation. In general, the TCA values of sand dunes were less than zero while the TCA values of the sandy lands were 0.0-0.1, indicating a better vegetation cover. The minimum mean TCA values of sites 1, 5, and 6 occurred in 2002; the minimum mean TCA values of sites 2, 11, and 12 occurred in 2009; and the minimum mean TCA values of sites 3, 4, 7, 8, 9, 10, and 13 occurred in 2001, indicating the occurrence of a severe drought and lower soil moisture content during these years (Dorjsuren et al., 2016; Lamchin et al., 2016). It is worth examining why the minimum mean TCA values of the different sites occurred in different years, which has thus far been attributed to different climate change rates between the different sites. Compared with the TCA, the DI is created using TCB, TCG, and TCW, which reduced the effects of moisture and vegetation simultaneously. In some cases, the DI is better able to identify sand dunes from the background than the TCA. The TGSI reports the grain size of the surface in a defined area. In this study, the TGSI values of more than 0.21 were classified into the sand dune or sandy land categories, unlike the studies using Landsat images in the Hogno Khaan protected area in Mongolia and the arid to semi-arid regions of Inner Mongolia (Xiao et al., 2006; Lamchin et al., 2016). This difference is likely due to the use of different sensors, although the spectral bands of the MCD43A4 have been adjusted to be comparable to those of Landsat TM. Compared with the DI, TGSI can better describe the structures of the sand dunes and sandy land, such as the coarse and fine sand dune, and the coarse and fine sandy land, which is important for studying the sand dune movement, sand shift, and so on. However, in some cases, it cannot adequately differentiate the sandy land from the background. Compared with the other sand dunes of the study area, the Tengger Desert had higher DI and TGSI values, indicating a brighter and finer surface. Therefore, the integration of the advantages of TCA, DI, and TGSI could better identify and assess the desertification.
The PI is a valuable parameter used in assessing trends and processes of desertification change that might be missed by an exclusively bi-temporal change detection approach. It should be noted that the maximum mean PI did not correspond to the year with the maximum precipitation, which indicated that the restoration might have reached its environmental upper limit before the year with the maximum precipitation. During the last 16 years, the mean PI values of Badain Jaran, Tengger, and Ulan Buh deserts were all close to zero, indicating a relative stabilization of these deserts. The mean PI values were negative at sites 1, 2, 3, 4, 9, 10, and 11 in more than half of the study period, indicating a slow increase in desertification, whereas the mean PI values were positive at sites 5, 12, and 13, indicating a slow decrease in desertification. It has not been determined whether the desertification is permanent or whether it is only an expression of seasonal variability (Sternberg et al., 2011; Eckert et al., 2015). However, our study identified parallel processes of ongoing climate variability and fluctuations in desertification, indicating a three or four-year periodically fluctuating change rather than a continuous increase or decrease in the desertification, which may be reflected by changes in precipitation, soil moisture, and vegetation restoration projects in the MP (Sternberg et al., 2011, 2015; Dorjsuren et al., 2016; Huang, 2017; Yu et al., 2017). The Horqin Sandy Land in particular, showed random alternations between a slow fluctuated increase and decrease for all the time periods, indicating the impacts from the local ecological restoration projects (Zhang et al., 2012).
For the Khar Nuur, Ereen Nuur, Tsagan Nuur, and Khongoryn Els sand dunes, and the Badain Jaran, Tengger, Ulan Buh and Hobq deserts, the fine sand dunes were mainly distributed in the east and southeast parts of the sites, indicating that the fine sand shifts with the predominant winds. Our study showed that compared with the other sand dunes and deserts, the fine sand dunes occupied the majority of the Tengger Desert, as is evidenced by the results of studies based on the grain size of deposits in the Badain Jarden-Tengger Desert (Li, 2011), which indirectly indicate that the DT classification of this study was receivable, and the coarse sandy land occupied the majority of the Horqin Sandy Land. Our study showed that sandy lands around the dunes or deserts had finer sand particles than the coarse sandy land, for example, comparisons of sites 1 and 12 show the differences in topsoil grain sizes between the west and the east of the MP. Further studies need to be conducted in the future.
Desertification is a complex process driven by climate change and anthropogenic impacts. In this study, we attempted to monitor the desertification changes in the MP from 2000 to 2015 through analysis of the thirteen sites, including sand dunes and sandy lands, using MODIS MCD43A4 data. Although with no ground truth data were available to carry out a detailed accuracy assessment of the DT classification, visual interpretation, and high resolution images from Google Earth acquired for the same periods, together with previous research results showed that the DT classification could be employed to assess the desertification at the regional scale.
It demonstrated that the TCA is a valuable parameter for the assessment of sand dunes, sandy lands, and vegetation. In some cases of this study, the DI was better able to identify sand dunes from the background than the TCA. The TGSI was able to better describe the structures of the sand dune and sandy land, such as the coarse and fine sand dunes, and the coarse and fine sandy lands, which were important for studying sand dune movements, and sand shift. The PI provided a view of the trends and processes of desertification change that might be missed with only a bi-temporal change detection approach. The integration of the advantages of the TCA, DI, TGSI, and PI could better identify and assess the desertification. During the last 16 years, the deserts of Badain Jaran, Tengger, and Ulan Buh were relatively stable. The Khar Nuur, Ereen Nuur, Tsagan Nuur, Khongoryn Els, and Hobq deserts, and the Mu Us, and Otindag sandy lands showed a gradual increase in desertification, whereas the Bayan Gobi, Horqin, and Hulun Buir sandy lands showed a gradual decrease in desertification.
At the moment, various limitations remain, including the mixed pixel effects and threshold selection. Although evaluating relative changes in TCA, DI, TGSI, and PI did not require calibration, and MODIS MCD43A4 had standardized reflectance to a nadir view, normalization between the TCA, DI, TGSI, and PI values should be studied in the future. Further studies to link the TCA, DI, TGSI, and PI values with the desertification characteristics are recommended to set the thresholds and improve the assessment accuracy.
This research was jointly supported by the Innovation Project of State Key of Laboratory of Resources and Environmental Information System (O88RA20CYA), the National Natural Science Foundation of China (41671422), the International Cooperation in Science and Technology Special Project (2013DFA91700), and the National Science-Technology Support Plan Project (2013BAD05B03). The authors would like to thank Miss ZHANG Yunjie and Miss GUO Yushan for MODIS MCD43A4 data downloading and mosaicking.
The authors have declared that no competing interests exist.
| [1] |
URL
[CJCR: 4]
Abstract Desertification is a serious global environmental problem that affects many people directly in countries with semi-arid or arid climates. The causes of desertification are diverse and complicated, ranging from international economic activities to unsustainable land use practices of local communities. The consequence of desertification reduces the ability of the land to support life and decreases biodiversity. Natural processes and artificial forces initiate this process. Natural causes of desertification include climatic factors drought, and water or wind erosion. Human induced activities that can cause desertification include over-cultivation, overgrazing, deforestation, and poor water management.The aim of this paper is to analyse how remote sensing and GIS have been used to monitor desertification globally. Remote sensing has proven to be efficient in detecting desertification processes including changes in natural vegetation, land use, and soil. Multi-temporal coverage provided by satellite data facilitates the use of remote sensing imagery to monitor changes in land coverage and usage over time. Remote sensing data and GIS are critical for extracting reliable information important for assessing environmental changes and land quality in any given region. Various techniques in remote sensing combined with analytical methods such as NDVI or classification provide primary data that can be used to assess desertification processes. Several key indicators of the processes of desertification are identified where remote sensing can be used to detect, monitor, and map affected areas. Changing vegetation and land use, drought, soil, erosion, and urbanization are the most common indicators of desertification used by researchers. Results of studies can be used to make important management, environmental, and political decisions. Therefore, care, must be taken to use recent imagery, select the appropriate technique, and to include as much additional data as possible so that reliable and robust results are obtained.
|
| [2] |
DOI:10.1016/j.rse.2013.12.020
URL
[CJCR: 2]
Knowing if a forest disturbance is caused by timber harvest or a natural event is crucial for carbon cycle assessments, econometric analyses of timber harvesting, and other research questions. However, while remote sensing of forest disturbance in general is very well developed, discerning between different types of forest disturbances remains challenging. In this work, we developed an algorithm to separate windfall disturbance from clear-cut harvesting using Landsat data. The method first extracts training data primarily based on Tasseled Cap transformed bands and histogram thresholds with minimal user input. We then used a support-vector machine classifier to separate disturbed areas into ‘windfall’ and ‘clear-cut harvests’. We tested our algorithm in the temperate forest zone of European Russia and the southern boreal forest zone of the United States. The forest-cover change classifications were highly accurate (~0290%) and windfall classification accuracies were greater than 75% in both study areas. Accuracies were generally higher for larger disturbance patches. At the Russia study site about 60% of all disturbances were caused by windfall, versus 40% at the U.S. study site. Given the similar levels of accuracy in both locations and the ease of application, the algorithm has the potential to fill a research gap in mapping wind disturbance using Landsat data in both temperate and boreal forests that are subject to frequent wind events.
|
| [3] |
URL
[CJCR: 1]
The extent of today's land degradation and desertification in the arid, semi-arid. and sub humid regions of China is a serious threat to the social and economic development in these areas. A national programme for monitoring and classification of drylands has been implemented by the Chinese Academy of Science. Areas are classified into degrees of desertification on the basis of vegetation cover, biomass change, deflation, and deposition. This study evaluates the use of Landsat MSS derived vegetation indices for desertification mapping as an alternative to the labour intensive field measurements used in the currently used classification system. Ratio-, difference-, normalized-, and soil adjusted vegetation indices images, together with MSS band 6, the first principal component, and maximum likelihood classified images are used and compared. Accuracy is evaluated using a thematic desertification map of Horqin Sandy Land, Inner Mongolia (1991), compiled by the Lanzhou Institute of Desert Research, Chinese Academy of Science, for validation. The green vegetation cover estimates images all showed comparable results, and no one stood out as superior to the others. Total accuracy is approximately 48% for all indices, while mean accuracy varies between 26.8% and 64.1% for individual classes. Annual plants are theorised to be the cause of the class confusion, hence the low accuracy.
|
| [4] |
URL
[CJCR: 1]
The first climatic type distribution map of desertification in China has been drawn out making use of Thornthwaite method which was recommended in International Convention to Combat Desertification. On the map, the potential extent of desertification in China has been outlined. The results show that among the 3 317 032 2 km 2 potential areas, there are 751 161 9 km 2 distributed in semi humid prone to aird area, 1 139 214.2 km 2 distributed in semi arid area and 142 665 1 km 2 in arid area, and their proportions to territory are 7.8%, 11.9% and 14.9% in order. The potential extent of desertification in China cover administrative divisions of 18 provinces and 470 counties and consists of 34.6% of the territory.
|
| [5] |
DOI:10.1006/jare.2001.0980
URL
[CJCR: 1]
Remote sensing digital image analysis is applied to monitor desertification processes in central San Luis Province (Argentina), where signs of severe landscape degradation have been observed in the last decades. Two Landsat images, acquired in 1982 and 1992 were used to evaluate the potential of using remote sensing analysis in desertification monitoring. After geometric and radiometric correction of both images, multitemporal comparison techniques were utilized to emphasize areas of greater degradation. Spectral unmixing of the vegetation, water and sand components facilitated the analysis of areas of heterogeneous cover from satellite images. Simple differences between unmixed images of sand or water revealed dune movement, re-vegetation trends and variations in water bodies, as a result of changing rainfall and land use patterns.
|
| [6] |
|
| [7] |
DOI:10.1016/j.rse.2013.11.006
URL
[CJCR: 1]
Forest management seeks sustainability for a diverse set of goals, including economic objectives, provision of ecosystem services, and provision of a variety of possible land uses. It is important to quantify, map and monitor forest dynamics resulting from natural and anthropogenic processes over time periods appropriate to the temporal scale of change as well as to land management goals and decision making. This paper presents temporal trend analyses of temperate mixed forest dynamics in Gatineau Park, Québec, Canada, using a time series of Landsat 5 TM scenes. Several vegetation indices were first evaluated as indicators of field measured vegetation abundance parameters such as leaf area index, canopy openness, DBH, and basal area. Of these, Tasseled Cap Wetness (TCW) provided the best relationships (e.g., r02=020.81 against LAI) and it differentiated between coniferous, mixed and deciduous forests. Thirteen clear sky 5 TM scenes from the growing seasons of 1987 to 2010 were relatively calibrated and assembled into an image time-series. TCW applied to the image time-series followed by Theil–Sen and Contextual Mann–Kendall trend analysis detected subtle and gradual field-verified forest change. Gradual and abrupt forest decline or regrowth periods were identified; over the full period, 64102ha (1.8% of the park) exhibited statistically significant growth, and 68902ha (1.9%) exhibited decline. Mapping the timing, location, magnitude, and duration of forest change will help inform land management policy and actions within Gatineau Park and such methods may be applied in other similar forests.
|
| [8] |
DOI:10.3390/rs8060509
URL
[CJCR: 2]
Drought is a period of abnormally dry weather with a serious shortage of water supply. Drought indices can be an advantageous indicator to assess drought for taking further response actions. However, drought indices based on ground meteorological measurements could not completely reveal the land use effects over a regional scale. On the other hand, the satellite-derived products provide consistent, spatial and temporal comparisons of global signatures for the regional-scale drought events. This research is to investigate the drought signatures over Mongolia by using satellite remote sensing imagery. The evapotranspiration (ET), potential evapotranspiration (PET) and two-band Enhanced Vegetation Index (EVI2) were extracted from MODIS data. Based on the standardized ratio of ET to PET (ET/PET) and EVI2, the Modified Drought Severity Index (MDSI) anomaly during the growing season from May ugust for the years 2000 2013 was acquired. Fourteen-year summer monthly data for air temperature, precipitation and soil moisture content of in situ measurements from sixteen meteorological stations for four various land use areas were analyzed. We also calculated the percentage deviation of climatological variables at the sixteen stations to compare to the MDSI anomaly. Both comparisons of satellite-derived and observed anomalies and variations were analyzed by using the existing common statistical methods. The results demonstrated that the air temperature anomaly (T anomaly) and the precipitation anomaly (P anomaly) were negatively (correlation coefficient r = 0.66) and positively (r = 0.81) correlated with the MDSI anomaly, respectively. The MDSI anomaly distributions revealed that the wettest area occupied 57% of the study area in 2003, while the driest (drought) area occurred over 54% of the total area in 2007. The results also showed very similar variations between the MDSI and T anomalies. The highest (wettest) MDSI anomaly indicated the lowest T anomaly, such as in the year 2003, while the lowest (driest) MDSI anomaly had the highest T anomaly in 2007. By comparing the MDSI anomaly and soil moisture content at a 10-cm depth during the study period, it is found that their correlation coefficient is 0.74.
|
| [9] |
DOI:10.1007/s10661-014-3841-3
PMID:24891073
URL
[CJCR: 2]
Aeolian desertification is one of the most serious environmental and socioeconomic problems in arid, semi-arid, and dry subhumid zones. Understanding desertification processes and causes is important to provide reasonable and effective control measures for preventing desertification. With satellite remote sensing images as data source to assess the temporal and spatial dynamics of desertification from 1975 to 2010 in the Horqin Sandy Land, dynamic changes of aeolian desertification were detected using the human–machine interactive interpretation method. The driving factors of local desertification were analyzed based on natural and socioeconomic data. The results show that aeolian desertified land in the study area covered 30,19902km 2 in 2010, accounting for 24.102% of the study area. The total area of aeolian desertified land obviously expanded from 30,88402km 2 in 1975 to 32,07102km 2 in 1990, and gradually decreased to 30,19902km 2 in 2010; aeolian desertified land represented an increasing trend firstly and then decreased. During the past 3502years, the gravity centers of desertified lands that are classified as extremely severe and severe generally migrated to the northeast, whereas those that are moderate and slight migrated to the northwest. The migration distance of severely desertified land was the largest, which indicated the southern desertified lands were improved during the last few decades. In addition, the climatic variation in the past 3502years has been favorable to desertification in the Horqin Sandy Land. Aeolian desertified land rapidly expanded from 1975 to 1990 under the combined effects of climate changes and unreasonable human activities. After the 1990s, the main driving factors responsible for the decrease in desertification were positive human activities, such as the series of antidesertification and ecological restoration projects.
|
| [10] |
DOI:10.1016/j.jaridenv.2014.09.001
URL
[CJCR: 3]
61MODIS NDVI time series were used to identify land degradation and regeneration areas.61MODIS land cover class changes coincide with MODIS NDVI trend areas.61Changes in precipitation might have an influence on large NDVI trend areas.61Short-term changes in temperature have no influence on NDVI trend areas.
|
| [11] |
DOI:10.3844/ajessp.2009.633.638
URL
[CJCR: 2]
bProblem statement:/b The objective of this study is to develop techniques for assessing and analyzing sand desertification in the northern part of Shaanxi Province, China. bApproach:/b In order to reveal the process of land degradation, especially the latest situation of sandy desertification, a method integrating remote sensing, Geographic Information System (GIS) and field survey was employed to build a sandy desertification dataset for analysis. Remote Sensing images included the Landsat Thematic Mapper (TM) images in 1987 and Landsat Enhanced Thematic Mapper Plus (ETM+) images in 1999). Eight land-cover classes, including active sand dunes, fixed sand dunes, semi-fixed sand dunes, grass land, farm land, wet land, built up area and unused land and Normalized Difference Vegetation Index (NDVI), were identified. bResults:/b The results showed that the active sand dunes and semi-fixed sand dunes have increased with a change rate of 128.70 and 55.65 kmsup2/sup yearsup-1/sup, respectively, in the meantime the fixed sand dunes has decreased with a decreasing rate of 182.14 kmsup2/sup yearsup-1/sup. During the 1987s, the area of sandy deserti#64257;ed land reached 12,006.11 kmsup2/sup (57.17% of the total sandy area), of which severely deserti#64257;ed, medium deserti#64257;ed and slightly deserti#64257;ed land areas were 4,442.23, 4,253.45 and 3,310.43 kmsup2/sup, respectively. By the year 1999, the area of deserti#64257;ed land was increased to 13,782.30 kmsup2/sup (65.63% of the total sandy area), of which severely deserti#64257;ed, medium deserti#64257;ed and slightly deserti#64257;ed land areas were 5,169.89, 4,918.15 and 3,694.26 kmsup2/sup, respectively increasing by 1,776.19 kmsup2/sup. bConclusion:/b Spatial change detection based on active sand dunes showed that the expansion area was much larger than the reversion in the past two decades and that several active sand belts has been formed, suggesting that sandy desertification of northern part of Shaanxi Province, China, will be a long-term task.
|
| [12] |
DOI:10.4236/jgis.2013.55047
URL
[CJCR: 1]
Sand dune movement is a hazardous phenomenon in Egypt and creates major threat on the existing land use and land cover as well as developmental plans. This paper studied the sand dune morphology and quantified the rate of sand dune movements and direction ...
|
| [13] |
DOI:10.1007/s10980-015-0277-2
URL
[CJCR: 3]
The article discusses papers devoted to the ecology and sustainability of the Mongolian Plateau with topics such as land use change and vegetation dynamics, biodiversity and community structures and human impacts on ecosystem processes.
|
| [14] |
DOI:10.1016/j.rse.2011.02.025
URL
[CJCR: 4]
A full range of change types were identified on the landscape, from stand replacing disturbances to more subtle growth and succession processes. Results indicate that the study area is in a constant state of change, and maintains a high average proportion of vegetation to non-vegetation. The amount of total landscape modified per decade increased from 18% and 14% in the 1970s and 1980s respectively, to more than 30% and 33% in the 1990s and 2000s. On average, the proportion of vegetation to non-vegetation was increasing prior to 1981, decreasing between 1981 and 1997, and increasing post-1997. There was a high degree of spatial autocorrelation amongst change processes, with a maximum Moran's I of 0.79 in 1973; landscape change became more spatially disperse and widespread after 1981. Temporal correlation of change processes was observed locally, with the period 1990鈥1995 having the most persistent change.
|
| [15] |
|
| [16] |
DOI:10.1007/s12665-009-0102-9
URL
[CJCR: 1]
Wind action is the most dominant agent for erosion and deposition in the vast Western Desert of Egypt. Analysis of wind data from seven meteorological stations distributed along the Western Desert reveals that this desert is characterized by high-energy wind environments along the northern and southern edges and low-energy wind environments throughout the rest of the desert. Accordingly, sand drift potential follows the pattern of wind energy. Maximum sand drift potential was observed at the southern edge (571 vector units, which equals 40聽m 3 /m width/year). Sand drift direction was observed towards the southeast except at the southern part of the desert where the trend of sand movement was towards southwest. The major dune type recognized on satellite images was the simple linear type. Linear dunes are generally associated with bimodal wind regime. Rates of sand drift potential and sand dune migration were greatest at East of Owinate region at the extreme southern part of the desert. Measurements of crescentic sand dune advance from two satellite images reveal a maximum advance rate of about 9聽m/year at the southern part of the desert. Dune movement creates potential hazard to the infrastructures in this open desert.
|
| [17] |
DOI:10.1016/j.rse.2012.01.002
URL
[CJCR: 1]
Sand dune movements pose potential hazards against various land use activities in Egypt. To avoid or to minimize the hazards associated with sand dunes, it is critical to determine their rates and patterns of migration at high accuracy and over wide spatial coverage. This is, however, a real challenge using field work and traditional remote sensing approaches. The co-registration of optically sensed images and correlation (COSI-Corr) complements traditional approaches to provide accurate measurements at wide spatial coverage. Applying the COSI-Corr technique to two SPOT 4 panchromatic images acquired above North Sinai, we measured lateral migration of 6.0 to 19.402m/yr with an average of 7.702m/yr, and 9.3 to 15.002m/yr with an average of 11.902m/yr for the whole barchans dune areas and a selected sample of barchan dunes, respectively. We also detected that the lateral movements along the crest lines of linear dunes ranged from 4.0 to 20.102m/yr with an average of 6.802m/yr for the whole area occupied by linear dunes. For a selected linear dune within the study area, the lateral migration of peaks and saddles along the crest lines ranged from 5.5 to 16.702m/yr with an average of 12.402m/yr. The lateral migration of both barchans dunes and linear dunes showed high spatial variability. Validation of these results against the previously measured migration rates indicated high degree of accuracy of the technique. In addition, the displacement field produced from the correlation indicated that the direction of sand dune movements occurred towards the east and southeast, which is well aligned with the previously determined sand dune drifting potentials.
|
| [18] |
DOI:10.1007/s11769-002-0008-x
URL
[CJCR: 3]
1INTRODUCTIONRemotesensingmonitoringisafrequentlyem-ployedapproachofstudyingtheproblemsofdesertifica-tion.ThedevelopmentofremotesensingtechniqueaswellasitsmarriagetoGISandGPS,namelytheintegra-tionof3Stechnique,createatechnicalmeanstotracetheevolv
|
| [19] |
|
| [20] |
DOI:10.1016/j.jaridenv.2006.02.016
URL
[CJCR: 1]
Monitoring of desertification processes by satellite remote sensing is an important task in China and other arid regions of the world. We used a full year 2000 (1 January 2000鈥31 December 2000) time-series of SPOT VEGETATION images with 1 km spatial resolution to produce a land cover map with special emphasis on the detection of sparse vegetation as an indicator of areas at risk of desertification. The study area covered 2000脳3500 km in North China extending from temperate forests to the Gobi desert to the Tibet high plateau. A classification approach for different land cover types with special emphasis on sparse vegetation cover was developed which was able to resolve problems related to seasonal effects and the highly variable natural conditions. The best classification results were obtained by exploiting seasonal effects detectable in time-series of optimized Normalized Difference Vegetation Index images calculated from 10-day composites. Compared to the Global Land Cover 2000 and MODIS Vegetation Continuous Field classification, more sparsely vegetated land was detected by this approach. The areas at risk of desertification were modelled, and the result suggests that 1.60 million km 2 are areas at risk of desertification. Due to the wide swath and sensitivity to vegetation growth SPOT VEGETATION imagery should be very useful to detect large-scale dynamics of environmental changes and desertification processes.
|
| [21] |
DOI:10.1016/j.earscirev.2011.11.006
URL
[CJCR: 1]
For more than four decades remote sensing images have been used to document and understand the evolution of aeolian sand dunes. Early studies focused on mapping and classifying dunes. Recent advances in sensor technology and software have allowed investigators to move towards quantitative investigation of dune form evolution and pattern development. These advances have taken place alongside progress in numerical models, which are capable of simulating the multitude of dune patterns observed in nature. The potential to integrate remote sensing (RS), spatial analysis (SA), and modeling to predict the future changes of real-world dune systems is steadily becoming a reality. Here we present a comprehensive review of significant recent advances involving RS and SA. Our objective is to demonstrate the capacity of these technologies to provide new insight on three important research domains: (1) dune activity, (2) dune patterns and hierarchies, and (3) extra-terrestrial dunes. We outline how several recent advances have capitalized on the improved spatial and spectral resolution of RS data, the availability of topographic data, and new SA methods and software. We also discuss some of the key research challenges and opportunities in the application of RS and SA dune field, including: the integration of RS data with field-based measurements of vegetation cover, structure, and aeolian transport rate in order to develop predictive models of dune field activity; expanding the observational evidence of dune form evolution at temporal and spatial scales that can be used to validate and refine simulation models; the development and application of objective and reproducible SA methods for characterizing dune field pattern; and, expanding efforts to quantify three-dimensional topographic changes of dune fields in order to develop improved understanding of spatio-temporal patterns of erosion and deposition. Overall, our review indicates a progressive evolution in the way sand dunes are studied: whereas traditional field studies of airflow and sand transport can clarify event-based process鈥揻orm interactions, investigators are realizing a synoptic perspective is required to address the response of dune systems to major forcings. The integration and evolution of the technologies discussed in this review are likely to form a foundation for future advances in aeolian study.
|
| [22] |
DOI:10.1080/00207230500034123
URL
[CJCR: 1]
An attempt has been made in this study to delineate the characteristics of spectral signatures of the vegetation in terms of various vegetation indices (VIs), particularly the Normalized Difference Vegetation Index (NDVI), Modified Soil Adjusted Vegetation Index2 (MSAVI2) and Enhanced Vegetation Index (EVI) to manifest their ability to estimate vegetation biomass over a large area and to monitor vegetation degradation in arid and semi‐arid area of Mongolia. Multi‐temporal SPOT‐4 VEGETATION data from 1998 to 2001 have been used for the analysis. The correlations between the vegetation indices observed at various degrees of vegetation coverage during different stages of growth were examined. The results showed that in Mongolian desert steppe and Gobi desert zone MSAVI2 is the best, while in mountain steppe zone EVI is found to estimate biomass well. Generally, it was found that total biomass was decreased by 50.7% and 31.4% of rangeland is very severe degraded in the case study area.
|
| [23] |
DOI:10.1016/j.rse.2004.10.012
URL
[CJCR: 1]
Vegetation indices and transformations have been used extensively in forest change detection studies. In this study, we processed multitemporal normalized difference moisture index (NDMI) and tasseled cap wetness (TCW) data sets and compared their statistical relationships and relative efficiencies in detecting forest disturbances associated with forest type and harvest intensity at five, two and one year Landsat acquisition intervals. The NDMI and TCW were highly correlated (>0.95 r 2) for all five image dates. There was no significant difference between TCW and NDMI for detecting forest disturbance. Using either a NDMI or TCW image differencing method, when Landsat image acquisitions were 5 years apart, clear cuts could be detected with nearly equal accuracy compared to images collected 2 years apart. Partial cuts had much higher commission and omission errors compared to clear cut. Both methods had 7鈥8% higher commission and 12鈥22% higher omission error to detect hardwood disturbance when it occurred in the first year of the 2-year interval (as compared to 1-year interval). Softwood and hardwood change detection errors were slightly higher at 2-year Landsat acquisition intervals compared to 1-year interval. For images acquired 1 and 2 years apart, NDMI forest disturbance commission and omission errors were slightly lower than TCW. The NDMI can be calculated using any sensor that has near-infrared and shortwave bands and is at least as accurate as TCW for detecting forest type and intensity disturbance in biomes similar to the Maine forest, particularly when Landsat images are acquired less than 2 years apart. Where partial cutting is the most dominant harvesting system as is currently the case in northern Maine, we recommend images collected every year to minimize (particularly omission) errors. However, where clear cuts or nearly complete canopy removal occurs, Landsat intervals of up to 5 years may be nearly as accurate in detecting forest change as 1 or 2 year intervals.
|
| [24] |
DOI:10.1016/j.rse.2007.09.013
URL
[CJCR: 1]
Changes in species composition and diversity are the inevitable consequences of climate change, as well as land use and land cover change. Predicting species richness at regional spatial scales using remotely sensed biophysical variables has emerged as a viable mechanism for monitoring species distribution. In this study, we evaluate the utility of MODIS-based productivity (GPP and EVI) and surface water content (NDSVI and LSWI) in predicting species richness in the semi-arid region of Inner Mongolia, China. We found that these metrics correlated well with plant species richness and could be used in biome- and life form-specific models. The relationships were evaluated on the basis of county-level data recorded from the Flora of Inner Mongolia , stratified by administrative (i.e., counties), biome boundaries (desert, grassland, and forest), and grouped by life forms (trees, grasses, bulbs, annuals and shrubs). The predictor variables included: the annual, mean, maximum, seasonal midpoint (EVI mid ), standard deviation of MODIS-derived GPP, EVI, LSWI and NDSVI. The regional pattern of species richness correlated with GPP SD ( R 2 02=020.27), which was also the best predictor for bulbs, perennial herbs and shrubs ( R 2 02=020.36, 0.29 and 0.40, respectively). The predictive power of models improved when counties with >0250% of cropland were excluded from the analysis, where the seasonal dynamics of productivity and species richness deviate patterns in natural systems. When stratified by biome, GPP SD remained the best predictor of species richness in grasslands ( R 2 02=020.30), whereas the most variability was explained by NDSVI max in forests ( R 2 02=020.26), and LSWI avg in deserts ( R 2 02=020.61). The results demonstrated that biophysical estimates of productivity and water content can be used to predict plant species richness at the regional and biome levels.
|
| [25] |
DOI:10.3390/rs6109316
URL
[CJCR: 2]
The spatial extent of desertified vs. rehabilitated areas in the Mu Us Sandy Land, China, was explored. The area is characterized by complex landscape changes that were caused by different drivers, either natural or anthropogenic, interacting with each other, and resulting in multiple consequences. Two biophysical variables, NDVI, positively correlated with vegetation cover, and albedo, positively correlated with cover of exposed sands, were computed from a time series of merged NOAA-AVHRR and MODIS images (1981 to 2010). Generally, throughout the study period, NDVI increased and albedo decreased. Improved understanding of spatial and temporal dynamics of these environmental processes was achieved by using the Change Vector Analysis (CVA) technique applied to NDVI and albedo data extracted from four sets of consecutive Landsat images, several years apart. Changes were detected for each time step, as well as over the entire period (1978 to 2007). Four categories of land cover were created鈥攙egetation, exposed sands, water bodies and wetlands. The CVA鈥檚 direction and magnitude enable detecting and quantifying finer changes compared to separate NDVI or albedo difference/ratio images and result in pixel-based maps of the change. Each of the four categories has a biophysical meaning that was validated in selected hot-spots, employing very high spatial resolution images (e.g., Ikonos). Selection of images, taking into account inter and intra annual variability of rainfall, enables differentiating between short-term conservancies (e.g., drought) and long-term alterations. NDVI and albedo, although comparable to tasseled cap鈥檚 brightness and greenness indices, have the advantage of being computed using reflectance values extracted from various Landsat platforms since the early 1970s. It is shown that, over the entire study period, the majority of the Mu Us Sandy Land area remained unchanged. Part of the area (6%), mainly in the east, was under human-induced rehabilitation processes, in terms of increasing vegetation cover. In other areas (5.1%), bare sands were found to expand to the central-north and the southwest of the聽area.
|
| [26] |
URL
[CJCR: 2]
Abstract In the arid and semi-arid regions of Northeast Asia, grassland degradation has become a major environ-mental and economic problem, so sustainable utilization of resources is crucial in terms of not only supporting the local and animal production but also thinking about the global environment. Especially in Mongolia and North China, grassland degradation has mainly been induced by artificial factors such as overgrazing by livestock, inadequate management of arable land and uncontrolled cutting of trees for fuel. In particular, overgrazing is one of the main causes of grassland degradation, and conservation and sustainable use of the grasslands can be achieved by proper grazing management to match carrying capacity estimates. How, though, can we achieve the ability to maintain valuable ecosystems and sustainable livestock farming at the same time? Satellite remote sensing and the Geographic Information System (GIS) are two of the most powerful tools to assist in grazing management. There is an increasing number of development analysis tools that can aid in collecting data on seasonal changes in grazing behavior over long-term periods. Quantitative assessment methods for monitoring spatial and temporal distributions of grazing animals at a regional scale are required in studies designed to determine the driving causes of desertification. This paper first reviews previous studies monitoring desertification through the use of remote sensing and tools for assessing livestock distribution, and then discusses current developments and future perspectives of remote sensing of grasslands in Northeast Asia.
|
| [27] |
DOI:10.3390/rs3010001
URL
[CJCR: 4]
Most remote sensing studies in deserts focus solely on vegetation monitoring to assess the extent of desertification. However, the application of sand dune encroachment into such studies would greatly improve the accuracy in the prediction criteria of risk-prone areas. This study applies the latter methodology for tracking desertification using sand dunes in the Kelso Dunes (in Newberry-Baker, CA, USA). The approach involves the comparison of spectral characteristics of the dunes in Landsat Thematic Mapper (TM) images over a 24-year period (1982, 1988, 1994, 2000, and 2006). During this 24-year period, two El Ni帽o events occurred (1983 and 1993); it was concluded that despite the shift in predominant winds, the short-term variation in wind direction did not make a noticeable change in dune formation, but greatly influences vegetation cover. Therefore, relying solely on vegetation monitoring to assess desertification can lead to overestimations in prediction analysis. Results from this study indicate that the Kelso Dunes are experiencing an encroachment rate of approximately 5.9 m3/m/yr over the 24-year period. While quantifying the Kelso Dunes or any natural dynamic system is subject to uncertainties, the encroachment rate approach reflects the highly heterogeneous nature of the sand dunes (in regards to spectral variability in brightness) at Kelso Dunes and serves as an exemplar for future research.
|
| [28] |
DOI:10.1016/j.asr.2015.10.006
URL
[CJCR: 7]
Desertification is a serious ecological, environmental, and socio-economic threat to the world, and there is a pressing need to develop a reasonable and reproducible method to assess it at different scales. In this paper, the Hogno Khaan protected area in Mongolia was selected as the study area, and a quantitative method for assessing land cover change and desertification assessment was developed using Landsat TM/ETM+ data on a local scale. In this method, NDVI (Normalized Difference Vegetation Index), TGSI (Topsoil Grain Size Index), and land surface albedo were selected as indicators for representing land surface conditions from vegetation biomass, landscape pattern, and micrometeorology. A Decision Tree (DT) approach was used to assess the land cover change and desertification of the Hogno Khaan protected area in 1990, 2002, and 2011. Our analysis showed no correlation between NDVI and albedo or TGSI but high correlation between TGSI and albedo. Strong correlations (0.77 0.92) between TGSI and albedo were found in the non-desertification areas. The TGSI was less strongly correlated with albedo in the low and non desertification areas, at 0.70 and 0.92; respectively. The desertification of the study area is increasing each year; in the desertification map for 1990 2002, there is a decrease in areas of zero and low desertification, and an increase in areas of high and severe desertification. From 2002 to 2011, areas of non desertification increased significantly, with areas of severe desertification also exhibiting increase, while areas of medium and high desertification demonstrated little change.
|
| [29] |
|
| [30] |
DOI:10.1080/14498596.2015.1124810
URL
[CJCR: 1]
Use of the tasselled cap transformation (TCT) is widely accepted in the remote sensing community, but there is concern whether the TCT components from each unique tasselled-cap-like feature space from different sensors are directly comparable. This study compared the differences of the TCT components from Landsat 5 Thematic Mapper (TM) and Landsat 7 Enhanced TM Plus (ETM+) images with different TCT coefficients from paired images. The results demonstrated that time series analysis of Landsat images using the TCT components derived from Landsat 5 TM and Landsat 7 ETM+ digital numbers (DNs) or at-satellite reflectance could introduce errors. Through converting Landsat 5 TM to Landsat 7 ETM+ DNs prior to the TCT transformation, the RMSEs were reduced by >62 percent. Overall, it was better to derive the TCT components from at-satellite reflectance images, normalised by relative radiometric correction, based on the TCT coefficients for Landsat 7 ETM+ at-satellite reflectance.
|
| [31] |
DOI:10.1080/01431160701253303
URL
[CJCR: 1]
The tasselled cap concept is extended to Moderate Resolution Imaging Spectroradiometer (MODIS) Nadir BRDF‐Adjusted Reflectance (NBAR, MOD43) data. The transformation is based on a rigid rotation of principal component axes (PCAs) derived from a global sample spanning one full year of NBAR 16‐day composites. To provide a standard for MODIS tasselled cap axes, we recommend an orientation in MODIS spectral band space as similar as possible to the orientation of the Landsat Thematic Mapper (TM) tasselled cap axes. To achieve this we first transformed our global sample of MODIS NBAR reflectance values to TM tasselled cap values using the existing TM transformation, then used an existing algorithm (Procrustes) to compute the transformation that minimizes the mean square difference between the TM transformed NBAR values and NBAR PCA values. This transformation can then be used as a standard to rotate the MODIS NBAR PCA axes into a new MODIS Kauth–Thomas (KT) orientation. Global land cover patterns in tasselled cap space are demonstrated graphically by linking the global sample with several other products, including the MODIS Land Cover product (MOD12) and the MODIS Vegetation Continuous Fields product (MOD44). Patterns seen at this global scale agree with previous explorations of TM tasselled cap space, but are shown here in greater detail with a globally representative sample. Temporal trends of eight smaller‐scale BigFoot Project (www.fsl.orst.edu/larse/bigfoot) sites were also examined, confirming the spectral shifts in tasselled cap space related to phenology.
|
| [32] |
DOI:10.1016/j.rse.2006.10.001
URL
[CJCR: 1]
A detailed understanding of the spatial patterns of burning is valuable for managing biodiversity and ecosystems. This research assesses the performance of several spectral indices derived from Landsat data when modelling fire occurrence probability by means of logistic regression. Normalized Difference Vegetation Index (NDVI), Normalized Difference Moisture Index (NDMI), Normalized Burn Ratio (NBR) and the greenness and wetness components of the Tasseled Cap Transformation were tested. Landscape variables (topography, accessibility and structural vegetation) were also included as predictors in models development. Although fire risk is closely related to weather and vegetation status at a given time, it is also strongly linked to fire history, and changes in predictor values in years previous to the fire were events also considered. The models generated correctly classified about 70% of the validation data set. The inclusion of pre-fire spectral indices improved models ability to predict fire occurrence. Although the NBR-based model was the most accurate, TCWetness and NDVI-based models showed similar results, while TCGreenness performed worst. Models with no spectral indices described the fire-proneness of the landscape structure, while the inclusion of spectral indices improved the recognition of particular spatial conditions. Slope and distance to the nearest path were also identified as valuable predictors. All the models identified the main fire risk zones in the study area. Their integration into a single, integrated model properly described fire-proneness and is suggested to be a valuable tool for the identification and management of fire risk. The method used is simple, describes the key variables and spatial pattern of the fire regime and is suited to operational use in Mediterranean ecosystems.
|
| [33] |
DOI:10.1016/j.rse.2008.02.010
URL
[CJCR: 2]
Forest disturbance and recovery are critical ecosystem processes, but the spatial pattern of disturbance has never been mapped across North America. The LEDAPS (Landsat Ecosystem Disturbance Adaptive Processing System) project has assembled a wall-to-wall record of stand-clearing disturbance (clearcut harvest, fire) for the United States and Canada for the period 1990–2000 using the Landsat satellite archive. Landsat TM and ETM+ data were first converted to surface reflectance using the MODIS/6S atmospheric correction approach. Disturbance and early recovery were mapped using the temporal change in a Tasseled-Cap “Disturbance Index” calculated from the early (~021990) and later (~022000) images. Validation of the continental mapping has been carried out using a sample of biennial Landsat time series from 23 locations across the United States. Although a significant amount of disturbance (30–60%) cannot be mapped due to the long interval between image acquisition dates, the biennial analyses allow a first-order correction of the decadal mapping. Our results indicate disturbance rates of up to 2–3% per year are common across the US and Canada due primarily to harvest and forest fire. Rates are highest in the southeastern US, the Pacific Northwest, Maine, and Quebec. The mean disturbance rate for the conterminous United States (the “lower 48” states and District of Columbia) is calculated as 0.9 +/61020.2% per year, corresponding to a turnover period of 110years.
|
| [34] |
DOI:10.1016/j.rse.2009.12.018
URL
[CJCR: 2]
Spatially and temporally explicit knowledge of biomass dynamics at broad scales is critical to understanding how forest disturbance and regrowth processes influence carbon dynamics. We modeled live, aboveground tree biomass using Forest Inventory and Analysis (FIA) field data and applied the models to 20+ year time-series of Landsat satellite imagery to derive trajectories of aboveground forest biomass for study locations in Arizona and Minnesota. We compared three statistical techniques (Reduced Major Axis regression, Gradient Nearest Neighbor imputation, and Random Forests regression trees) for modeling biomass to better understand how the choice of model type affected predictions of biomass dynamics. Models from each technique were applied across the 20+ year Landsat time-series to derive biomass trajectories, to which a curve-fitting algorithm was applied to leverage the temporal information contained within the time-series itself and to minimize error associated with exogenous effects such as biomass measurements, phenology, sun angle, and other sources. The effect of curve-fitting was an improvement in predictions of biomass change when validated against observed biomass change from repeat FIA inventories. Maps of biomass dynamics were integrated with maps depicting the location and timing of forest disturbance and regrowth to assess the biomass consequences of these processes over large areas and long time frames. The application of these techniques to a large sample of Landsat scenes across North America will facilitate spatial and temporal estimation of biomass dynamics associated with forest disturbance and regrowth, and aid in national-level estimates of biomass change in support of the North American Carbon Program.
|
| [35] |
|
| [36] |
DOI:10.1080/17538940903506006
URL
[CJCR: 4]
Changing environmental and socio-economic conditions make land degradation, a major concern in Central and East Asia. Globally satellite imagery, particularly Normalized Difference Vegetation Index (NDVI) data, has proved an effective tool for monitoring land cover change. This study examines 33 grassland water points using vegetation field studies and remote sensing techniques to track desertification on the Mongolian plateau. Findings established a significant correlation between same-year field observation (line transects) and NDVI data, enabling an historical land cover perspective to be developed from 1998 to 2006. Results show variable land cover patterns in Mongolia with a 16% decrease in plant density over the time period. Decline in cover identified by NDVI suggests degradation; however, continued annual fluctuation indicates desertification 090009 irreversible land cover change 090009 has not occurred. Further, in situ data documenting greater cover near water points implies livestock overgrazing is not causing degradation at water sources. In combination of the two research methods 090009 remote sensing and field surveys 090009 strengthen findings and provide an effective way to track desertification in dryland regions.
|
| [37] |
DOI:10.1007/s10745-012-9539-7
URL
[CJCR: 1]
The Mongolian plateau in East Asia is part of a new hotspot of land cover change. Recent human activity and natural forces have degraded grasslands in northern China with the southern Mongolia steppe similarly vulnerable. Investigating vegetation patterns at piospheres (the area around water points) can identify herder influence on pasture conditions. Through fieldwork and remote sensing this paper examines plant density and species richness at water sources to establish land cover patterns in two Mongolian provinces where overgrazing is thought to be the major cause of degradation. In contrast to standard piosphere patterns, vegetation was greater near water points and decreased with distance. This suggests that livestock are not concentrated at water points in Mongolia and that piosphere dynamics are more influenced by precipitation, edaphic factors and potential distinctive processes in cold drylands. It implies that pastoralism, with mobile livestock management, is a suitable adaptive strategy to the low forage capacity of steppe grasslands.
|
| [38] |
DOI:10.3390/rs70201346
URL
[CJCR: 2]
Deserts are critical environments because they cover 41% of the world’s land surface and are home to 2 billion residents. As highly dynamic biomes desert expansion and contraction is influenced by climate and anthropogenic factors with variability being a key part of the desertification debate across dryland regions. Evaluating a major world desert, the Gobi in East Asia, with high resolution satellite data and the meteorologically-derived Aridity Index from 2000 to 2012 identified a recent contraction of the Gobi. The fluctuation in area, primarily driven by precipitation, is at odds with numerous reports of human-induced desertification in Mongolia and China. There are striking parallels between the vagueness in defining the Gobi and the imprecision and controversy surrounding the Sahara desert’s southern boundary in the 1980s and 1990s. Improved boundary definition has implications fGobi; desert boundary; expansion and contraction; Aridity Index; NDVI; Mongolia; China02or understanding desert “greening” and “browning”, human action and land use, ecological productivity and changing climate parameters in the region. The Gobi’s average area of 2.3 million km2 in the 21st century places it behind only the Sahara and Arabian deserts in size.
|
| [39] |
|
| [40] |
|
| [41] |
|
| [42] |
DOI:10.1038/s41598-017-04363-8
PMID:5479821
URL
[CJCR: 2]
The temporal trends and key driving forces of desertification in the Mu Us Desert are representatives of most arid regions of Asia with a high risk of desertification. We analyzed the significance of Aeolian transport on desertification in the Mu Us Desert by field investigations, sampling, wind tunnel experiments, particle size and nutrient measurements, and statistics on aeolian transport potentials. The results showed that high intensities of aeolian processes may result in low differences in aeolian transport despite differences in the underlying sediments. When high desertification occurred in the 1970s, the annual losses of the ammonium N, nitrate N, available K, and available P were approximately 116, 312, 46,436, and 1,25165kg65km612, respectively. After 2010, the losses were only 8, 20, 3,208, and 8465kg65km612, which were generally only 6.7% of those in the 1970s. The results showed that although human activity may trigger desertification, the dramatic decline of aeolian transport and low nutrient loss may be the key driving forces for the occurrence of rehabilitation in this region.
|
| [43] |
DOI:10.1006/jare.2001.0847
URL
[CJCR: 1]
In order to document the status and causes of desertification development in the Mu Us Sandland located in the agro-pastoral transitional zone in northern China, we interpreted and analysed satellite images, historical maps, meteorological and socio-economic data to assess landscape change from the 1950s to the 1990s. During the intervening 35-year period, landscapes have changed significantly in this area. The shifting and semi-fixed sandy lands have increased by 540,915·3 and 399,302·2 ha, respectively, and now cover 44·53% and 21·44% of the area of the Mu Us Sandland, in the meantime the fixed sandy land has decreased by 572,130·6 ha and covers only 7·22% of the sandland. The rate of desertification in the middle and northwest, where there is only pasture, is much higher than that in the east and south, where farmland and pasture exist together. In most of the sandland, desertification has developed rapidly, while rehabilitation of vegetation has occurred only in marginal areas in the east and south. The main causes of desertification development in the Mu Us Sandland are intensified and irrational human activities, such as over-reclaiming, over-grazing and over-cutting.
|
| [44] |
DOI:10.1080/01431160600554363
URL
[CJCR: 5]
The grain size composition of topsoil characterizes the soil texture and other physical properties. The coarsening of topsoil grain size is a visible symbol of land degradation; thereby the change in topsoil grain size can be potentially used to monitor desertification using remote sensing. This study proposes a new index for detecting topsoil grain size composition through ground in situ soil spectral reflectance measurements and soil physical analysis in the laboratory. The proposed topsoil grain size index (GSI), which has a positive correlation with fine sand content, was then applied to detect desertification in Siziwang Banner, Inner Mongolia, China, using a Landsat TM (1993) image and a Landsat ETM+ image (2000). The result shows the fine sand content of topsoil increased in most places, indicating a coarsening process of the topsoil in the study area. The fast soil coarsening of degradation is largely caused by human activities.
|
| [45] |
DOI:10.3390/s90301738
PMID:22573984
URL
[CJCR: 6]
Desertification is a serious threat to the ecological environment and social economy in our world and there is a pressing need to develop a reasonable and reproducible method to assess it at different scales. In this paper, the Ordos Plateau in China was selected as the research region and a quantitative method for desertification assessment was developed by using Landsat MSS and TM/ETM+ data on a regional scale. In this method, NDVI, MSDI and land surface albedo were selected as assessment indicators of desertification to represent land surface conditions from vegetation biomass, landscape pattern and micrometeorology. Based on considering the effects of vegetation type and time of images acquired on assessment indictors, assessing rule sets were built and a decision tree approach was used to assess desertification of Ordos Plateau in 1980, 1990 and 2000. The average overall accuracy of three periods was higher than 90%. The results showed that although some local places of Ordos Plateau experienced an expanding trend of desertification, the trend of desertification of Ordos Plateau was an overall decrease in from 1980 to 2000. By analyzing the causes of desertification processes, it was found that climate change could benefit for the reversion of desertification from 1980 to 1990 at a regional scale and human activities might explain the expansion of desertification in this period; however human conservation activities were the main driving factor that induced the reversion of desertification from 1990 to 2000.
|
| [46] |
DOI:10.1016/j.jaridenv.2005.03.032
URL
[CJCR: 1]
Desertification, land degradation in arid, semi-arid, and dry sub-humid regions, is a global environmental problem. Accurate assessment of the status, change, and trend of desertification will be instrumental in developing global actions to prevent and eradicate the problem. As one of the most seriously affected countries, China has made great efforts to combat desertification. Although improvements have been made in some areas, degradation continues to expand and intensify throughout the entire country. Further land degradation assessments, such as assessments made by the Chinese Committee for Implementing UN Convention to Combat Desertification (CCICCD), will be necessary to ensure successful decision-making, to combat increasing desertification, and to implement Western strategies. This paper overviews the state-of-the-art desertification assessments on both the national and local levels. Also, two major problems facing the assessment of degradation—the uncertainty of baseline assessments and indictor systems and the misuse of remotely sensed data sources—are presented along with suggestions for possible solutions to these problems.
|
| [47] |
DOI:10.1016/S1040-6182(03)00131-9
URL
[CJCR: 1]
Relict frost wedges and moraines in the Chaidamu and Tarim basins of China indicate that the coldest time of the last glaciation occurred at 30–2502ka in these two areas. The stratigraphy of the dunes in the Badain Jaran Desert, high lake levels in the areas near and within the large deserts in China and in Mongolia suggest a much more humid climate in western China and in Mongolia during marine isotope stage three. However, the period after 2402ka to the end of the Pleistocene was mostly characterised by increased temperature and reduced precipitation in the Chaidamu and Tarim basins. Paleoenvironmental conditions in the eastern part of the Chinese desert belt were marked by an extensive widening of dune formation at 6521–1302ka, reflecting a weaker intensity of East Asian summer monsoon. During the Holocene, higher lake levels, stratigraphy of dunes and results of palynological, isotopical and sedimentological analyses of lacustrine sediments in the western China and Mongolia suggest a few wetter periods, especially in the earlier part of the Holocene. The Holocene climatic conditions in the eastern part of the Chinese deserts have enabled stabilisation of dunes and formation of soils. The presently active dunes in this region are a result of desertification due to human influences. Recent investigations in the dry lands of China and Mongolia demonstrate broad regional differences that must be given attention for the understanding of palaeoclimates.
|
| [48] |
DOI:10.1016/j.jaridenv.2006.12.012
URL
[CJCR: 2]
Rates of dune migration in the Alxa Plateau of Inner Mongolia were derived from Landsat images taken in 1973, 1991, and 2000. Ten dunes (six transverse dunes, three barchans, and one hybrid dune) were studied. Migration rates ranged from 4.0 to 7.4 m year 611, and averaged 5.3 m year 611, from 1973 to 2000. Between 1973 and 1991, migration rates ranged between 3.4 and 5.9 m year 611, but between 1991 and 2000, this rate ranged between 3.7 and 12.9 m year 611; for all dunes, migration rates had increased. During dune migration, the vertical projection areas and dune outlines also changed. In 1973, the total area of all ten dunes was 2.28 km 2, and this increased to 2.37 km 2 in 1999 and 2.42 km 2 in 2000. This increase of 0.14 km 2 suggests that the mean dune volume also increased from 1973 to 2000, but because we could not know changes of dune heights of this period, we could not confirm this. The mean direction of dune migration ranged from 92° to 136° (ESE to SE), with an overall mean of 107°. The migration direction was close to the sand drift direction (RDD) calculated for the study area.
|
| [49] |
DOI:10.7780/kjrs.2013.29.6.5
URL
[CJCR: 3]
Desertification monitoring as a main portion for understand desertification, have been conducted by many scientists. However, the stage of research remains still in the level of comparison of the past and current situation. In other words, monitoring need to focus on finding methods of how to take precautions against desertification. In this study, Vegetation Temperature Condition Index (VTCI), derived from Normalized Difference Vegetation Index (NDVI) and Land Surface Temperature (LST), was utilized to observe the distribution change of vegetation. The index can be used to monitor drought occurrences at a regional level for a special period of a year, and it can also be used to study the spatial distribution of drought within the region. Techniques of remote sensing and Geographic Information System (GIS) were combined to detect the distribution change of vegetation with VTCI. As a result, assuming that the moisture condition is the only main factor that affects desertification, we found that the distribution of vegetation in Bulgan, Mongolia could be predicted in a certain degree, using VTCI. Although desertification is a complicated process and many factors could affect the result. This study is helpful to provide a strategic guidance for combating desertification and allocating the use of the labor force.
|
| [50] |
|
| [51] |
DOI:10.1006/jare.1997.0290
URL
[CJCR: 1]
The definition of desertification and its causes in the Chinese literature are reviewed and compared with those in international publications. Both Chinese researchers and their western counterparts have difficulty in reaching a generally accepted definition for desertification and an agreement upon the exact role played by human activities and environmental settings in desertification initiation and development. Tremendous efforts in China have gone into rehabilitating desertified land into productive uses with great contribution to existing knowledge in reclaiming desertified land. The early biological-oriented measures based solely on economic return have recently been replaced by a much more successful, multi-disciplinary approach of rehabilitation combined with preventive measures that follow sound ecological principles.Copyright 1997 Academic Press Limited
|
| [52] |
DOI:10.1016/j.ecoleng.2011.09.005
URL
[CJCR: 3]
Horqin Sandy Land is a major source of sandstorms in Northern China, especially the Beijing–Tianjin–Tangshan Region. A series of ecological restoration projects including the ‘Grain for Green Project’, the ‘Beijing and Tianjin Sandstorm Source Controlling Project’, and the ‘Three-North Shelterbelt Project’ were implemented in this region. This study assesses the effectiveness of ecological restoration projects within Tongliao City, the main body of Horqin Sandy Land. The different treatment effects of various sand dunes were assessed and compared based on Normalized Difference Vegetation Index (NDVI) from SPOT VEGETATION Ten Daily Synthesis Archive from 1999 to 2007 and the desert distribution map of China in 2000. The results showed that: (1) the fixed and semi-fixed sand dunes were the main sand dune types, which accounted for 70% of the entire sand dune area in 2000; followed by shifting sand dunes and the semi-shifting sand dunes. (2) The ecological restoration projects resulted in improvements of different sand dune types, the improved area covered 76% of the sand dune area, mainly in the southern parts of the study area. The vegetation cover of the sand dunes in Naiman Banner, Hure Banner and the south of Horqin Left Back Banner increased significantly. While mild improvement occurred in the central sand dunes of the study area. (3) The area with degraded vegetation accounted for approximately 10% of sand dune area, mainly located in the southeast of Jarud Banner and the west of Horqin Left Middle Banner. Most of these areas showed mild and insignificant degradation except for a small area of moderate degradation. (4) The types of sand dunes in degraded status were mainly the fixed and semi-fixed sand dunes, followed by the semi-shifting sand dunes and saline-alkali land. The lower the dune fixity (e.g. shifting or semi-shifting versus semi-fixed or fixed) and the more likely to contribute to sand-storms, the greater the effectiveness of restoration projects. Finally, some implications for the sustainable development of the ecological restoration projects are discussed.
|
| [53] |
DOI:10.1007/s10661-007-0124-2
PMID:18197462
URL
[CJCR: 1]
Abstract The objective of this study is to develop techniques for assessing and analysing land desertification in Yulin of Northwest China, as a typical monitoring region through the use of remotely sensed data and geographic information systems (GIS). The methodology included the use of Landsat TM data from 1987, 1996 and 2006, supplemented by aerial photos in 1960, topographic maps, field work and use of other existing data. From this, land cover, the Normalised Difference Vegetation Index (NDVI), farmland, woodland and grassland maps at 1:100,000 were prepared for land desertification monitoring in the area. In the study, all data was entered into a GIS using ILWIS software to perform land desertification monitoring. The results indicate that land desertification in the area has been developing rapidly during the past 40 years. Although land desertification has to some extent been controlled in the area by planting grasses and trees, the issue of land desertification is still serious. The study also demonstrates an example of why the integration of remote sensing with GIS is critical for the monitoring of environmental changes in arid and semi-arid regions, e.g. in land desertification monitoring in the Yulin pilot area. However, land desertification monitoring using remote sensing and GIS still needs to be continued and also refined for the purpose of long-term monitoring and the management of fragile ecosystems in the area.
|
| [54] |
DOI:10.1007/s10980-014-0095-y
URL
[CJCR: 3]
The Mongolian Plateau, comprising the nation of Mongolia and the Inner Mongolia Autonomous Region of China, has been influenced by significant climatic changes and intensive human activities. Previous satellite-based analyses have suggested an increasing tendency in the vegetation cover over recent decades. However, several ground-based observations have indicated a decline in vegetation production. This study aimed to explore long-term changes in vegetation greenness and land surface phenology in relation to changes in temperature and precipitation on the Plateau between 1982 and 2011 using the normalized difference vegetation index (NDVI). Across the Plateau, a significantly positive trend in the growing season (May eptember) NDVI was observed from 1982 to 1998, but since that time, the NDVI has not shown a persistent increase, thus causing an insignificant trend over the entire study period. For the steppe vegetation (a major vegetation type on the Plateau), the NDVI increased significantly in spring but decreased in summer. Precipitation was the dominant factor related to changes in steppe vegetation. Warming in spring contributed to earlier vegetation green-up only in meadow steppe vegetation, implying that water deficiency in typical and desert steppe vegetation may eliminate the effect of warming. Our results also suggest a combined effect of climatic and non-climatic factors and highlight the need to examine the role of regional human activities in the control of vegetation dynamics.
|
