


The feasibility of rooftop rainwater harvesting (RRWH) as an alternative source of water to meet the outdoor water demand in nine states of the U.S. was evaluated using a system dynamics model developed in Systems Thinking, Experimental Learning Laboratory with Animation. The state of Arizona was selected to evaluate the effects of the selected model parameters on the efficacy of RRWH since among the nine states the arid region of Arizona showed the least potential of meeting the outdoor water demand with rain harvested water. The analyses were conducted on a monthly basis across a 10-year projected period from 2015 to 2024. The results showed that RRWH as a potential source of water was highly sensitive to certain model parameters such as the outdoor water demand, the use of desert landscaping, and the percentage of existing houses with RRWH. A significant difference (as high as 37.5%) in rainwater potential was observed between the projected wet and dry climate conditions in Arizona. The analysis of the dynamics of the storage tanks suggested that a 1.0-2.0 m3 rainwater barrel, on an average, can store approximately 80% of the monthly rainwater generated from the rooftops in Arizona, even across the high seasonal variation. This interactive model can be used as a quick estimator of the amount of water that could be generated, stored, and utilized through RRWH systems in the U.S. under different climate conditions. The findings of such comprehensive analyses may help regional policymakers, especially in arid regions, to develop a sustainable water management infrastructure.
The adverse effects of increasing global population are prevalent all across the world affecting both the supply and demand of water (WHO, 2009). The rate of increase in water demand is accelerating, and the current demand is projected to double by 2035 (Tidwell et al., 2004). Researchers anticipate that in the next several decades, two-thirds of the world’s population may experience scarcity of water (Rijsberman, 2006). Studies have also found that many river basins around the world are facing the challenge of meeting local water quality standards (Shammi et al., 2016). As a result, besides the quantity of accessible water, the quality of water may severely influence the global water crisis (Khadse et al., 2016). Studies show that changes in climate can influence the hydrologic cycle and hydrologic regimes significantly, even though the effects of these changes vary from region to region (Tamaddun et al., 2017a). Researchers suggest that the intensification of water shortage during hot and dry summer seasons could be attributed to the shifts in the timing of hydrologic variables, e.g., precipitation, snowmelt, and streamflow patterns, which are subject to climate variability and change (Tamaddun et al., 2017b). Extreme hydrologic events, i.e., floods, droughts, and storms, could become more severe and frequent with the changes in climate (Tamaddun et al., 2016). These changes could affect surface and groundwater flow patterns and influence the quality of water, which in turn could pose serious threats to water resource management (Middelkoop et al., 2001). The optimal allocation and rational use of water resources can potentially lead to a reduction of cost and a sustainable water resource development (Chagwiza, 2016). Rainwater harvesting (RWH) can be an alternative source of water not only because of the volume that can generate but also because it meets the majority of the local water quality standards in terms of the maximum contaminant levels (Cain, 2010; Rahman et al., 2014). Rainwater is very soft in nature and can be considered as one of the cleanest sources of water on Earth (TWDB, 2005). Raindrops can become slightly acidic as they dissolve atmospheric CO2 and N2; however, this may not be considered threatening if the water is primarily used for outdoor purposes (MHLG, 2008). Hence, evaluating the feasibility of RWH as an alternative source for outdoor purposes, e.g., gardening, landscaping, car washing, and so on, can be a potential scope for research. In this study, a highly adaptable model was presented to evaluate the feasibility of rooftop rainwater harvesting (RRWH) systems to meet the outdoor water demand, which can be applied to any state, city, or even a neighborhood by simple modifications and adjustments. The interactivity of the model could be used effectively and quickly to estimate the amount of water that can be generated and stored with RRWH systems across the seasons under different climate conditions. This study can assist the policymakers to get a preliminary estimate of the harvested rainwater, which can be helpful in implementing regulations regarding sustainable water management.
According to the U.S. Environmental Protection Agency (EPA), RWH has drawn interest to the researchers and policymakers as a sustainable source to meet the increasing water demand since the technique could conserve both water and energy (Kloss, 2008). Throughout history, RWH has been used as an alternative source of water, especially in regions where water resources are either scarce or difficult to access. Cain (2010) found that small-scale RHW systems can be effectively applied in both the rural and urban setups in India and suggested that RWH should be more widely used to encounter global water crisis. Che-Ani et al. (2009) found that RWH can be the most suitable solution to meet the future water demand in Malaysia as the accessibility to clean surface and groundwater becomes scarce both in qualitative and quantitative grounds. Studies show that RWH is not only feasible in wet regions, but also in relatively dry or arid regions. With a study in the semi-arid regions of China, Li et al. (2000) found that in-situ RWH systems can significantly improve rain-fed farming systems. Bitterman et al. (2016), on a study in Tamil Nadu, India, which has a tropical climate with a fairly hot temperature around the year, proposed a conceptual framework to measure water security as a causal response to rainwater harvesting tanks to mitigate the risks caused by water shortage. Examining the application of domestic and agricultural RWH systems on the U.S. river basins, Ghimire and Johnston (2013) found a significant reduction in the average monthly withdrawal (water yield) among the surrounding watersheds. Several studies have also provided the cost-benefit analysis of applying RWH in urban and industrial setups based on optimized design and policy guidelines (Jothiprakash and Sathe, 2009; Temesgen et al., 2016). Angrill et al. (2012) analyzed different scenarios and identified the most suitable strategies to design environmental friendly RWH systems in urban setups. The study also suggested that RRWH has the potential to work as a thermal regulator if designed and located properly on roofs, which can be linked to energy conservation. A discussion on the different types of RWH systems, such as active cisterns with treatment facilities, passive systems as a complement to existing stormwater systems, rain barrels used for outdoor purposes, check dams, and fog/moisture collectors can be found in EPA (2013). Details on the cost of installation, energy saving, reduction in carbon emission, designing of distribution systems in addition to treatment facilities of different RWH systems can be found in Kloss (2008) and EPA (2013).
EPA (2013) compiled the current scenarios of RWH systems in the United States. The Texas Manual on Rainwater Harvesting published by the Texas Water Development Board in 2005 provides the necessary guidelines to design RWH systems. The Building Codes Division of Oregon’s Department of Consumer and Business Services published a handbook (ODCBS, 2014) on designing RWH systems. Kloss (2008) discussed the design methods of different RWH systems along with the environmental benefits; the study also includes information regarding energy savings due to RWH. A study by Basinger et al. (2010) developed a nonparametric stochastic model to evaluate the potential of RWH in multi-family residential buildings in New York City and determined the reliability of rain harvested water through rooftop facilities in meeting the demands for toilet flushing, garden irrigation, and air-conditioner topping. The study found that RWH can significantly reduce the potable water demand and runoff inputs to sewer systems generated from rooftops. Another study by Ward et al. (2010) developed evaluation models to design storage tanks based on the demand level and catchment size for both the commercial and domestic buildings and found considerable potential in water conservation. The study also emphasized the use of simulation models instead of traditional models since complex and continuous simulation models have higher stakeholder involvement.
The current study developed a system dynamics simulation (SDS) model using Systems Thinking, Experimental Learning Laboratory with Animation (STELLA), based on regional demographics and historical records to evaluate the feasibility of RRWH systems across nine states within the conterminous United States. The model evaluates the potential of RRWH under various climate conditions and calculates the volume of water generated to meet the increasing demand. The dynamics of storage tanks, as they get recharged and drained based on the variation of demand across the seasons, was also evaluated. The absence of a comprehensive study on the potential of RRWH under various climate conditions in the U.S. acted as the primary motivation for the research. As a result, based on the information gathered from literature, the key objective of the study was to present a single interactive model that would allow the policy makers and end users to evaluate the potential of RRWH systems under various controlled scenarios.
The U.S. Census Bureau divided the continental U.S. into nine divisions and each division consists of several states. Since only the residential households were considered to evaluate the potential of RRWH in meeting the domestic outdoor demand, the states with the highest population in each division were considered to be appropriate for the study (Fig. 1). Ten years of continuous precipitation data (referred to as rainfall in the later sections as the other forms of precipitation may eventually melt and can be considered as rainfall volume) from January 2005 to December 2014 were obtained, on a monthly basis, from the online database of the National Oceanic and Atmospheric Administration, U.S. Department of Commerce (Fig. 2). The rainfall patterns were assumed to have remained the same for the upcoming 10 years (projected years, i.e., January 2015 to December 2024); however, they were adjusted based on the near-term climate projections suggested by the EPA (Rossman, 2013). The guidelines for RRWH systems were obtained from EPA (2013). The governing equation and conversion factors were obtained from the Texas Manual on Rainwater Harvesting, published by the Texas Water Development Board (TWDB, 2005). This manual is also recommended by the EPA as a guideline to design RRWH systems in the United States.

Fig. 1
Nine census divisions of the conterminous U.S. and the states with the highest population (shaded) in each division selected for this study
Water usage data, measured in cubic metres per capita per day (CMPCD), the most commonly used unit to report water usage in the U.S., were calculated from Maupin et al. (2014) using the 2014 population. To be consistent with the SI unit, the following sections report the water usage in cubic meters per capita per day. Demographic data, such as the birth and the death rates, the initial (2014) population of the states, the number of people per household, the average household area, and the average household-area-to-roof-area ratio, were obtained from the survey results conducted by the Centers for Disease Control and Prevention National Center for Health Statistics (CDC-NCHS), U.S. Census Bureau, and Bureau of Labor Statistics, United States Department of Labor (U.S. Bureau of Labor Statistics). Table 1 lists the demographic data/statistics used in this study.
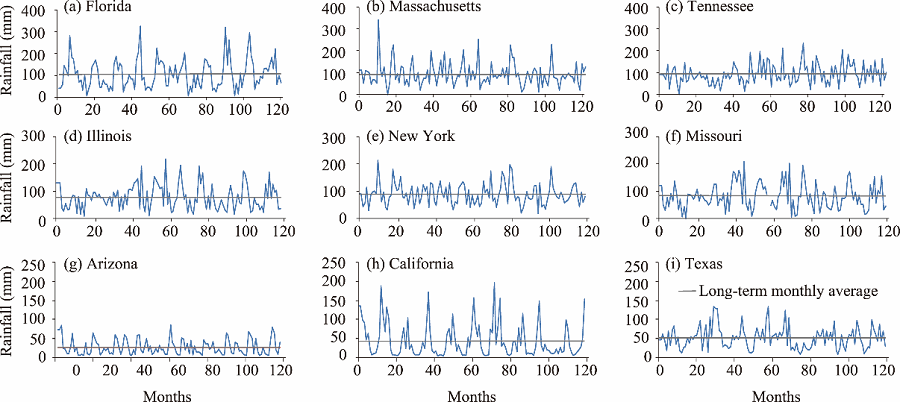
Fig. 2
Monthly rainfall variation of the selected U.S. states from January 2005 to December 2014
Table 1
Demographic data used in the study (based on 2014 data)
SDS models have been used extensively in the field of hydrology and in dealing with problems of water resource management (Chen et al., 2017). Applications of SDS models can be found in river basin planning (Zhang et al., 2016), in suggesting municipal water conservation policies (Qaiser et al., 2013), in providing city-based water resources planning (Venkatesan et al., 2011), in determining sustainability of river/river basin systems and reusability of water (Elshorbagy et al., 2005), in evaluating water quality parameters (Rusuli et al., 2015), in examining reservoir performances (Ahmad and Simonovic, 2000), in designing flood management and emergency evacuation systems (Simonovic and Ahmad, 2005), and in developing support systems and accounting tools (Gastélum et al., 2009; Turner et al., 2010). Considering the advantages of SDS models in simulating complex systems, an SDS model was developed in this study using STELLA to evaluate the potential of RRWH in residential households located throughout the nine selected states (Fig. 1). Once a simulation model representing a system has been developed, it can be replicated to observe the effects of the proposed modifications. This is a significantly helpful feature in problems dealing with water resource management (Stave, 2003). A detailed description of how an SDS model works to capture the dynamics of a system can be found in Forrester (1994), Ford (1999), and Sterman (2000).
The model was built with seven sectors including rainfall (S1), climate (S2), RRWH (S3), demand (S4), CMPCD (S5), housing (S6), and population (S7). S1 and S5 provided regional data for each of the states. S7 provided information regarding the total population of the states based on monthly birth and death rates (monthly rates were calculated from the annual rates provided by CDC-NCHS). Even though the population of each state varied, the birth and death rates were considered to be the identical across all the selected states (Table 1).
3.1.1 Climate sector (S2)
EPA suggested four climate conditions for both the near and far-term projections (Rossman, 2013). The scenarios are (1) no change, (2) hot or dry, (3) median change, and (4) warm or wet (Fig. 3a). For the analyses, the near-term (from 2020 to 2049) projected values were used. In the baseline scenarios (BLSs; explained in section 4.1), against which the controlled/modified scenarios were compared, no change in climate was considered. However, for further analysis, the median change in climate was selected in order to compare the changes.
3.1.2 RRWH sector (S3)
This sector considered the rainfall from the selected states and calculated the amount of water to be generated through RRWH using the governing equation below (TWDB, 2005; EPA, 2013).
V=R×CA×C×CE, (1)
where V is the total volume of water generated (m3); R is rainfall (mm); CA is catchment (roof) area (m2); C is the unit conversion factor of 0.001 (m/mm); and CE is the collection efficiency equals to 0.85.
Equation 1 was modified from its original form to express it in terms of units consistent with the Systéme International (SI). CE depends on the material of the roof. The users of the model can modify these parameters as required. This sector also considered the effect of antecedent dry period on the total runoff generated by rainfall using a reduction factor (not included in Eq. 1). This factor was introduced based on the concept of soil conservation service (SCS) curve number (Lim et al., 2006; Yuan et al., 2014), which measures the rainfall excess considering the moisture and infiltration of the surface.
3.1.3 Demand sector (S4)
This sector calculated the total outdoor demand as a percentage of the monthly water demand of the selected states. Annual average CMPCD of the states were calculated from Maupin et al. (2014) using the 2014 population of each state (Table 2). Table 2 reports the water usage in CMPCD. Griffin and Chang (1991) studied the seasonal effects on community water demand and their research results were used as approximate seasonal variability index to consider the change of water demand across a year (Fig. 3b). The effect of desert landscaping was considered in this sector as it affects the overall water demand as well.
3.1.4 Housing sector (S6)
This sector calculated the number of households based on the total population of the selected states. Factors such as average household area, average number of people per household, and the average household-area-to-roof-area ratio (Table 1) were obtained from the sources mentioned in Section 2.

Fig. 3
(a) Effects of various climate conditions on the rainfall of Arizona based on the models suggested by the U.S. Environmental Protection Agency (EPA; Rossman, 2013). Historical rainfall data were adjusted by the multipliers to capture the effects of the climate conditions. (b) Effect of seasonality (monthly variation) on water demand across a typical year. The indices were determined based on the results of Griffin and Chang (1991). The average cubic meters per capita per day (CMPCD) were multiplied by the variability index to calculate the monthly variations. (c) Variations of rainfall under different climate conditions and plot showing the variation of rainfall in Arizona for 2014 under different climate conditions suggested by EPA (Rossman, 2013).
A set of assessment techniques (Forrester and Senge, 1980; Shreckengost, 1985) were applied to test the dynamics of the model to build confidence in the model. Firstly, dimensional consistency was maintained throughout the modeling process. The indices and multipliers were chosen (or converted if necessary) in such a manner that they did not have any influence on the use of units and dimensions. Secondly, to test the dynamic relations of the model, three extreme conditions, zero rainfall, zero current population, and zero CMPCD, were set to observe the results. The model simulated the extreme conditions as expected. Thirdly, in order to observe the behavior of the model, three different integration methods, Euler’s method, Runge-Kutta 2, and Runge-Kutta 4, were used while reducing the interval fraction from 1/4 to 1/132 unit of time. Under all the settings, the model generated comparable results. Fourthly, to test whether the model was able to replicate expected behaviors, different climate conditions on the rainfall data (for the last 12 months, i.e., from January 2014 to December 2014) of Arizona were tested (Fig. 3c). The results indicated that a reduction in rainfall due to hot or dry climate could bring about a significant decrease in the amount of rainfall, especially from May to September. The warm or wet condition was observed to have the maximum increase in rainfall from June to August. These changes in rainfall patterns were suggested by the EPA climate conditions as well (Fig. 3a). Finally, in order to observe how the outcomes were sensitive to the various model parameters, sensitivity analyses were run for the model. The comparative responses of these parameters on the outcomes are discussed in the Results section below.
A set of parameters were chosen to be the most influential ones (Table 2) to determine the feasibility of RRWH in a state. In the baseline scenarios (BLSs), the climate condition was set to no change for all the states. The percentage of existing houses with RRWH was considered to be 5%, whereas the percentage of new houses (that would be built in the next 10 projected years) with RRWH was kept at 25%. These percentages were reasonably assumed as the objective of the study was to present a relative comparison between the BLSs and the controlled scenarios and to evaluate the potential of RRWH.
Table 2
Baseline scenarios (BLSs) for each state with the selected model parameters
The percentage of CMPCD used to meet the outdoor demand, the percentage of the population living in households with desert landscaping, and the reduction factor due to antecedent dry period had a unique set of values for each state. The percentages of CMPCD were set to values that would slightly over-estimate the demand (Table 2). The WaterSense program of the EPA (www.epa.gov/watersense) suggests that, on an average, 30% of the per capita water demand is used for outdoor water purposes across the U.S., which can be as high as 60% in the south-western arid regions (e.g., Arizona, California, and Texas). The percentage of population living in the households with desert landscaping was set to zero in the BLSs for all the states except for the arid states since the remaining states had more than 100 mm of long-term average precipitation per month (Fig. 2). Also, the reduction factor due to antecedent dry period was close to 1.0 (suggesting no reduction) for the states with enough and frequent rainfall (Table 2). The values were set according to the location and climate of the states based on the SCS curve number (Yuan et al., 2014). Graphical outcomes of the BLSs are presented in Figure 4. In the BLSs, it was observed that many states, especially the ones with enough and frequent rainfall, could meet the outdoor water demand quite effectively by RRWH (Table 3). Though four of the nine states chosen met the total outdoor water demand from RRWH in terms of the total volume over the projected years (Table 3), none of the states was able to meet the demand all year round, on a monthly basis, as the seasonal effects influenced both the rainfall and outdoor water demand (Fig. 4). Florida, Massachusetts, and Tennessee showed good responses; RRWH was able to meet the outdoor water demand during most of the months in these states. The demands were met during some of the months for Illinois, New York, and Missouri; however, these states were short of the target demand during a few months in summer. Arizona, California, and Texas showed the poorest performances in terms of meeting the water demand. California and Texas had only a few instances, on a monthly basis, where RRWH was able to meet the outdoor water demand; Arizona did not show a single instance in meeting the water demand during the entire projected period in the BLS.

Fig. 4
Volume of water generated through RRWH systems and outdoor water demand in the selected states from January 2015 to December 2024 in the baseline scenarios (BLSs)
Table 3
Comparison of the total outdoor water demand and the total water generated from the rooftops in the projected years of the baseline scenarios (BLSs)
The study did not provide a unique solution for each state as it depends on the users to change the model parameters and observe how these changes affect the final outcome. Arizona was selected as the sample state to analyze the effects of the model parameters, since it had the least potential of meeting the outdoor water demand with RRWH compared to the other states. The later subsections discuss the dynamics of each of the model parameters in details for Arizona.
Figure 5 shows the variation in rain harvested water (monthly average) at each year of the projected period for Arizona under various climate conditions. All the parameters, except for the climate conditions, were kept fixed as they were in the BLS (Table 2). The results show that hot or dry climate decreased the amount of rainfall significantly and therefore reduced the volume of water generated from RRWH as well. Contrarily, the maximum amount of water would be produced from RRWH under warm or wet climate in almost all the months during the projected years. The difference in the volume of water produced from RRWH under warm or wet and hot or dry conditions was found to be as high as 37.5% in a single month. The average monthly difference of rainwater generated through RRWH between warm or wet and hot or dry scenario was 4.3% across the study period. The annual variation (Fig. 5) also showed that warm or wet climate produced more water via RRWH than hot or dry climate in each of the projected years.
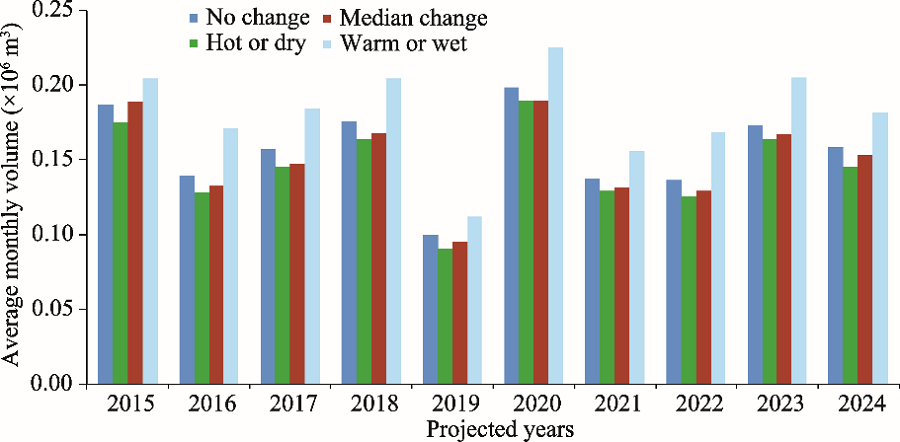
Fig. 5
Average monthly volume of water generated per year (annual mean) from RRWH systems under various climate conditions across the projected years in Arizona
A reduction in the percentage of CMPCD available for outdoor water usage can increase the chances of meeting the reduced demand via RRWH. The EPA WaterSense (www.epa.gov/watersense) suggests that water-efficient best management practices (BMPs) can reduce the outdoor water usage by 15% if regulated properly. For Arizona, the percentage of CMPCD used to meet the outdoor water demand was reduced to 40%, as compared to 50% in BLS. As shown in Figure 6a, the reduction of outdoor water usage caused a linear reduction in the total outdoor water demand, which significantly narrowed the gap between the total outdoor demand and the water generated through RRWH.
The relationship between the percentage of population living in households with desert landscaping and the total outdoor water demand was built based on the water smart landscape guidelines (www.snwa.com/rebates) by the Southern Nevada Water Authority (SNWA). According to SNWA, the total lawn area (turf) should not exceed more than 50% of the side and rear yard areas in Southern Nevada to receive additional credit as a lawn owner. The water smart landscape guidelines suggest that 0.21 m3 of water per year can be saved per 0.093 m2 (1.0 ft2) of grass if replaced by water-smart landscapes. Based on these guidelines, a function was built in the model. For Arizona, the percentage of lawn area converted to desert landscapes was kept at 50%, but the percentage of population living in households with desert landscaping was varied. The percentage of the population with desert landscaping was increased to 50%, as compared to 20% in BLS, which reduced the outdoor water demand by 14.2% (Fig. 6b). Such a reduction can be quite significant in arid states where desert landscaping can be a viable option.
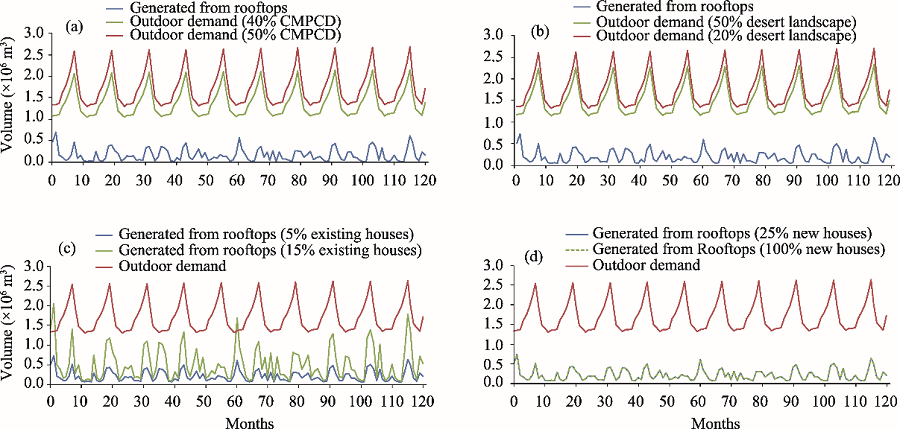
Fig. 6
Response of reducing the percentage of CMPCD used for outdoor water usage in Arizona (a); response of increasing the percentage of population living in households with desert landscaping on the outdoor water usage in Arizona (b); response of increasing the percentage of initial (existing) households with RRWH systems on the total water produced from RRWH systems in Arizona (c); and response of increasing the percentage of new households with RRWH systems on the total water produced from RRWH systems in Arizona (d)
An increase in the existing number of households with RRWH systems from 5% (BLS) to 15% showed a 200% increase in the volume of water generated through RRWH (Fig. 6c). For the first time in Arizona, there were a few instances, on a monthly basis, where the demand was met from RRWH. As expected, the amount of water generated through RRWH was highly sensitive to the existing number of households with RRWH.
The percentage of new households with RRWH systems increased from 25% (BLS) to 100% (Fig. 6d), which caused a 0.54% increase in average in the total volume of water generated through RRWH over the projected years. The difference between the results was not visually noticeable since the number of new households to be built over the next 10 projected years was quite insignificant (only 0.04%) compared to the number of households already existed.
The antecedent dry period reduces the runoff generation potential of a rainfall event since the moisture content in the atmosphere varies greatly between the wet and dry seasons and also across the states due to the variation in their overall climate conditions. For Arizona, a state with little rainfall associated with high temperature (a common feature for arid or semi-arid regions), the reduction factor was set to 0.70, which rationalized the water generation potential of RRWH. This model parameter was provided to control the effect of moisture content and potential evaporation with a single number. The number was introduced based on the concept of SCS curve number (Yuan et al., 2014). Moreover, the model allows the users to choose different reduction factors at the different time of the year during the study period.
Analyses of the previous cases suggested that there was no single model parameter that could solve the entire problems to meet the outdoor demand by using RRWH. A comprehensive measure is required to generate more water from such systems. At the same time, the demand side of the problem needs to be addressed by reducing the outdoor water demand and implementing BMPs, such as desert landscaping. Several scenarios with different combinations of the chosen parameters provided a realistic solution to the problems. One of these scenarios, shown in Table 4, was chosen as an achievable scenario (AS). Even though this scenario did not meet the demands all year round for a state like Arizona, which had very little rainfall, it provided an example of how the problem could be tackled by controlling several parameters of the system.
Table 4
Parameters of the achievable scenario to meet the outdoor water demand with RRWH systems in Arizona
To attain the AS, the demand side was reduced by decreasing the percentage of CMPCD used for outdoor purposes from 50% (BLS) to 40% (Tables 2 and 4); the use of desert landscaping was increased from 20% (BLS) to 75%; the percentage of existing households with RRWH was increased from 5% (BLS) to 25%; while the percentage of new houses with RRWH systems was increased from 25% (BLS) to 100% (Tables 2 and 4). In Arizona, under the AS, the generated water through RRWH was found to increase by up to 400% and the outdoor demand was decreased by up to 41% compared to the BLS. The total water generated from the rooftops was observed to meet 0.85% to 56% of the total monthly water demands.
Storing, draining, and refilling of rainwater tanks are highly critical in evaluating the efficacy of RWH since the available tanks have specific storage capacities. A passive harvesting system (rain barrel) typically stores 0.2-0.4 m3 of water, whereas an active harvesting system (cistern with treatment facilities) stores from 4.0-40.0 m3 (EPA, 2013). Depending on their size, these tanks can either be placed on the rooftop or on the ground. During the projected years, under the median climate condition, Arizona was observed to experience 22.3 mm of rainfall per month. This rainfall, on an average, generated up to 2.4 m3 of water per month per household, with a roof area of 125 m2.
A 4.0-m3 tank was chosen in this study to evaluate the dynamics of the RWH tanks, which was large enough to store the average water generated from a rooftop in a month in Arizona. If a particular month experienced enough rainfall to meet the outdoor water demand, i.e., if the total volume of water generated in the lawn areas were greater than the total outdoor water demand, then no water was drawn from the tanks. During the months when rainfall was not enough to meet the outdoor demand, the required amount (i.e., the gap/difference between the demand and the water from rainfall) was drawn from the tanks, which sometimes resulted in the emptying of the tanks. During the projected 10 years (120 months), 37 instances (30%) were found where no water was required from the tanks, suggesting that the monthly total rainfall alone was sufficient to meet the monthly outdoor water demand (Fig. 7a). For the remaining months, when a gap was present, water from the storage tanks was drawn. The percentage gap filled by the water stored in the tanks varied from 0.86% to 100% (on 15 occasions out of the 120 months). The average monthly gap filled by the tank water was found to be 27% over the projected years (Fig. 7b). Several tank sizes were tested to suggest a tank size that can be considered feasible. Tank sizes ranging from 1.0-2.0 m3 were found to store close to 80% of the water generated from the rooftops each month under various climate conditions in Arizona.
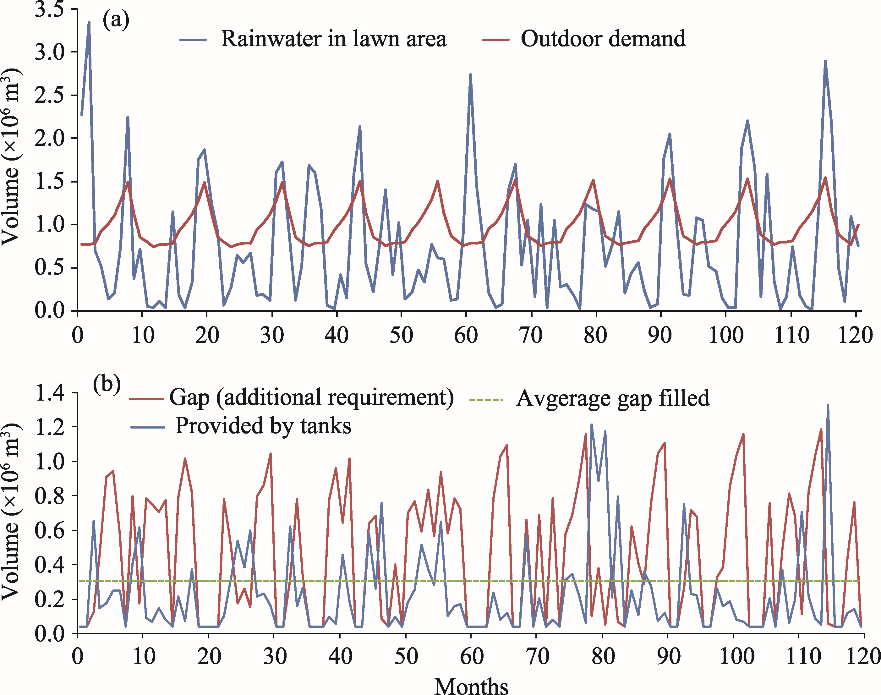
Fig. 7
Total outdoor water demand under achievable scenario and total water generated from household lawn areas due to rainfall in Arizona (a); dynamics of rainwater storage tanks in meeting the additional outdoor water demand and the gap (additional requirement) suggests the difference between the total outdoor water demand and the total rainwater generated in the lawn areas of Arizona (b)
From the BLSs (Table 2), it was observed that Florida, Massachusetts, and Tennessee had the highest potential of meeting the outdoor water demand by using RRWH during the projected years (Fig. 4). Illinois, New York, and Missouri also showed significant potential in meeting the demand across many instances on a monthly basis. Arizona, California, and Texas showed poor potential in the BLSs, as none of them was able to meet the demand by using RRWH consistently. EPA (2013) also suggests that the benefits of RWH, in general, are relatively higher on the east coast of the U.S. compared to the southwestern regions, where rainfall occurs for a limited time of a year. Even though the current study indicates that six out of the nine states can effectively meet a significant portion of the demand through RRWH, many of the states lack relevant regulations and codes for local standards and guidelines (Kloss, 2008). States such as Georgia, North Carolina, Texas, and Virginia have published guidance manuals with design criteria and water quality standards of RWH systems based on their rainfall potential (EPA, 2013). Among the chosen states of the current study, Arizona showed the least potential in meeting the outdoor demand. Hence, Arizona was chosen as the sample state and the model parameters from both the demand and supply sides were adjusted, considering the effects of climate conditions and seasonal variations, to produce an AS that could bring a satisfactory balance between both the demand and supply sides of water.
Seasonal variations (Fig. 3b) indicated that the highest demand was from May to September in a typical year. The effect of climate on rainfall also showed the highest variation during these months (Fig. 3a). The effect of various climate conditions showed that warm or wet climate could generate the maximum rainfall (a 7.2% increase from the long-term average), while hot or dry climate would reduce the amount of rainwater significantly (a 10.5% reduction from the long-term average; Fig. 3c). Rossman (2013) also suggested similar variations in rainfall across the U.S. due to various climate conditions. A discussion on the importance of incorporating climate change in SDS models as a result of a change in the global carbon cycle can be found in Ford (2011); the study showed how SDS models can improve the understanding of interdisciplinary analyses involving climate change. In this study, for Arizona, a median change in climate was considered throughout the study period; however, the users of the model can modify these settings to observe the effects of other climate conditions. Figure 5 showed that warm and wet (hot or dry) climate produced the maximum (minimum) water from RRWH as was expected from the rainfall pattern under different climate conditions (Fig. 3c). A study by Woodhouse et al. (2010) on the 21st-century drought in the southwestern U.S. suggested that the drought conditions in southwestern regions, e.g., Arizona and New Mexico, were highly susceptible to the summer rainfall dictated by the North American monsoon. The climate conditions used in this study also suggest the highest variation during the summer months (Fig. 3a). A wet summer month showed as high as 81% more rainfall compared to a dry summer month in Arizona during the projected years. According to the Arizona Department of Water Resources (ADWR) (www.azwater/gov/azdwr), a 25% reduction in rainfall from the long-term average can cause abnormally dry conditions in the central and western Arizona during summer. ADWR (2016) suggested that in 2016, all the major basins in the mountainous regions of Arizona have experienced a 6%-18% reduction in precipitation compared to the 30-year average. ADWR also suggested that based on the 30-year record, at any given month, the state of Arizona has a 2% (exceptional drought) to 30% (abnormally dry) chance of facing a drought. Multiple climate models suggest that the 21st century southwest U.S. will be increasingly arid and will experience severe and prolonged droughts due to high temperature as a result of increased greenhouse gases (MacDonald, 2010). In the current study, the average monthly difference in rainfall amount between a wet and dry climate was found to be 17.7%, which can be significant for arid regions such as Arizona. Even though the AS used a median change in climate, it can be inferred from the results that the dry climate condition will reduce the storage potential even more due to the reduced rainfall. Hence, a sustainable approach, as presented in the study, that can conserve both water and energy, should draw more attention in dealing with extreme conditions.
A reduction in the percentage of CMPCD used for the outdoor purposes can have a significant effect on the demand side of water (Fig. 6a). Outdoor water demand can be reduced by installing water conservative facilities (appliances), water-efficient irrigation techniques, and implementing BMPs (Rossman, 2013). EPA WaterSense and SNWA water smart landscape program (www.epa.gov/watersense; www.snwa.com/rebates) also provide details on water conservation practices and guidelines that can be implemented in arid and semi-arid regions. Desert landscaping is one of the viable BMPs that can be implemented in residential setups, especially in arid regions. In this study, by implementing desert landscaping (Fig. 6b) along with a reduction in the percentage of CMPCD for the outdoor purposes, the gap between the supply and demand curves was reduced significantly. The percentage of existing houses with RRWH and the percentage of new houses to be built in the projected years with RRWH determined the total volume of water generated through RRWH (Figs. 6c and d). Among these parameters, the percentage of existing houses with RRWH was found to be the most influential as the system was found to be highly sensitive to this parameter. In the AS, the increase in water generation (400% increase compared to the BLS), as a result of installing RRWH systems across Arizona, was found to be much higher compared to the reduction in water demand (41% reduction compared to the BLS), as a result of conservative practices (Fig. 7a). Even though a detailed analysis was conducted for Arizona only, the relationships obtained can easily be relatable to other regions with similar climate conditions. The policies adopted in a number of states can be found in Forasté and Hirschman (2010) where they analyzed the benefits and practice credits resulting from implementing RWH as a BMP.
A 4-m3 tank was chosen to capture the dynamics of the storage tanks, which was big enough to store the mean monthly water generated from the rooftops in Arizona. A detailed description of how to design an RRWH system, including sizing of the tanks, piping of the conduits, and treating of the contaminants, can be found in TCEQ (2007). The results indicated that the water stored in tanks, on an average, can meet up to 27% of the monthly outdoor demand, which was not met by rainfall alone. This potentially can reduce the overall water usage. In the eastern regions with enough rainfall, the water demand can reduce up to 53% using RRWH systems (Basinger et al., 2010). A smaller size of tanks (from 1-2 m3) can also store a significant amount of water generated from the rooftops in Arizona depending on the climate conditions. During the months when the water generated from the rooftops exceeded the capacity of the selected tanks, the surplus water could be conveyed to a drainage disposal facility (EPA, 2013). Even though smaller tanks might not store all the volume generated from the system during each month, they could still play an important role in reducing the surface runoff, especially in urban areas with very little infiltration. Reduction in runoff potentially could reduce the cost of water treatment and maintenance of infrastructures, i.e., roadways, paved parking lots and other water disposal facilities. Basinger et al. (2010) observed a 28% reduction in the runoff volume into the sewer systems as a result of implementing RRWH systems in New York City. More discussions on the benefits of rain harvested water including a reduction in cost and energy consumption can be found in Kloss (2008) and EPA (2013).
The study showed that RRWH could be used effectively as an alternative source of water even in arid or semi-arid regions where rainfall is scarce; however, this would require a decrease on the demand side. The study suggested a few options that can effectively reduce the consumption of water on the users’ end. The potential of RRWH systems could be extended by adding treatment facilities. Even though such systems would be more expensive, water stored in those systems would not be limited to outdoor purposes only. Several major cities, including Los Angeles, San Francisco, Tucson, and Portland, have published guidelines and policy documents at the municipal level to address treatment and permit requirements of RWH systems (EPA, 2013). Regions struggling with meeting water quality standards may greatly benefit from using such facilities. Implementing RWH may require legislative changes as there are water right issues involved if it is to be used on a larger scale. Regional water managers and policymakers may use simulation models, as the one presented in this study, to evaluate the holistic benefits of retrofitting RWH systems.
An extension of the model may work as a tool to provide a cost-benefit analysis of implementing RRWH systems, especially in an urban setup, since RWH can potentially reduce the costs of water treatment and maintenance. A few factors such as the average size of a single household, the birth and death rates etc., were considered to be uniform across all the states and may not be representative of the actual scenarios. Certain assumptions were made in the analyses to simplify the development of the model. However, the assumed simplifications also broadened the scope of the model since it allows the users to compare among several states. For higher accuracy, the model can be adjusted accordingly if a region-specific analysis is required for future applications.
Demographic data and historical records were used as inputs in a system dynamics simulation model in order to determine the efficacy of RRWH across nine states of the United States. As a special case, the state of Arizona was chosen since it had the lowest historical rainfall records among the states selected for the study and the least potential to meet the outdoor water demand with RRWH. The sensitivity of the model parameters was evaluated to determine the most influential factors affecting the efficacy of RRWH. Rainfall anomalies under different climate conditions were tested along with the variations in seasonal demand. The dynamics of storage tanks, based on the variable demand and supply, was also determined. The major findings of the study are:
(1)RRWH has significant potential to meet the outdoor water demand, even in arid regions such as Arizona, as long as the demand side of the problem is also addressed.
(2)The efficacy of RRWH systems are highly sensitive to the climate conditions, the number of existing households with RRWH systems, and the seasonal variation of the outdoor water demand.
(3)BMPs, such as desert landscaping, can significantly reduce the outdoor water demand in arid regions.
(4)In arid regions, small rooftop rainwater barrels (e.g., 1.0-2.0 m3) can potentially store a significant percentage of the monthly rainwater, which can effectively be used in the following months with less rainfall and higher demands.
The study developed a model based on the existing knowledge of RRWH systems and combined them in a tool that can be easily adjusted and modified by the users based on their needs to promptly evaluate the effects of the changes made. The versatility and interactivity of the model could be helpful to policymakers, especially for those who are facing challenges to meet an increasing water demand under changing climate conditions. The model also comes in a web-based interactive format that can easily be utilized by the interested parties.
The authors would like to thank the National Oceanic and Atmospheric Administration, U.S. Department of Commerce; U.S. EPA, Texas Water Development Board, Centers for Disease Control and Prevention National Center for Health Statistics (CDC-NCHS), U.S. Census Bureau, and Bureau of Labor Statistics, United States Department of Labor for the data used in the study.
The authors have declared that no competing interests exist.
| [1] |
|
| [2] |
DOI:10.1007/s11367-011-0330-6
URL
[CJCR: 1]
Purpose At present, many urban areas in Mediterranean climates are coping with water scarcity, facing a growing water demand and a limited conventional water supply. Urban design and planning has so far largely neglected the benefits of rainwater harvesting (RWH) in the context of a sustainable management of this resource. Therefore, the purpose of this study was to identify the most environmentally friendly strategy for rainwater utilization in Mediterranean urban environments of different densities. Materials and methods The RWH systems modeled integrate the necessary infrastructures for harvesting and using rainwater in newly constructed residential areas. Eight scenarios were defined in terms of diffuse (D) and compact (C) urban models and the tank locations ((1) underground tank, (2) below-roof tank, (3) distributed-over-roof tank, and (4) block tank). The structural and hydraulic sizing of the catchment, storage, and distribution subsystems was taken into account using an average Mediterranean rainfall, the area of the harvesting surfaces, and a constant water demand for laundry. The quantification of environmental impacts was performed through a life cycle assessment, using CML 2001 Baseline method. The necessary materials and processes were considered in each scenario according to the lifecycle stages (i.e., materials, construction, transportation, use, and deconstruction) and subsystems. Results and discussion The environmental characterization indicated that the best scenario in both urban models is the distributed-over-roof tank (D3, C3), which provided a reduction in impacts compared to the worst scenario of up to 73% in diffuse models and even higher in compact ones, 92% in the most dramatic case. The lower impacts are related to the better distribution of tank weight on the building, reducing the reinforcement requirements, and enabling energy savings. The storage subsystem and the materials stage contributed most significantly to the impacts in both urban models. In the compact density model, the underground-tank scenario (C1) presented the largest impacts in most categories due to its higher energy consumption. Additionally, more favorable environmental results were observed in compact densities than in diffuse ones for the Global Warming Potential category along with higher water efficiencies. Conclusions The implementation of one particular RWH scenario over another is not irrelevant in drought-stress environments. Selecting the most favorable scenario in the development of newly constructed residential areas provides significant savings in CO 2 emissions in comparison with retrofit strategies. Therefore, urban planning should consider the design of RWH infrastructures using environmental criteria in addition to economic, social, and technological factors, adjusting the design to the potential uses for which the rainwater is intended. Recommendations and perspectives Additional research is needed to quantify the energy savings associated with the insulation caused by using the tank distributed over the roof. The integration of the economic and social aspects of these infrastructures in the analysis, from a life cycle approach, is necessary for targeting the planning and design of more sustainable cities in an integrated way.
|
| [3] |
|
| [4] |
DOI:10.1016/j.jhydrol.2010.07.039
URL
[CJCR: 2]
The reliability with which harvested rainwater can be used as a means of flushing toilets, irrigating gardens, and topping off air-conditioner serving multifamily residential buildings in New York City is assessed using a new rainwater harvesting (RWH) system reliability model. Although demonstrated with a specific case study, the model is portable because it is based on a nonparametric rainfall generation procedure utilizing a bootstrapped markov chain. Precipitation occurrence is simulated using transition probabilities derived for each day of the year based on the historical probability of wet and dry day state changes. Precipitation amounts are selected from a matrix of historical values within a moving 1502day window that is centered on the target day. RWH system reliability is determined for user-specified catchment area and tank volume ranges using precipitation ensembles generated using the described stochastic procedure. The reliability with which NYC backyard gardens can be irrigated and air conditioning units supplied with water harvested from local roofs exceeds 80% and 90%, respectively, for the entire range of catchment areas and tank volumes considered in the analysis. For RWH systems installed on the most commonly occurring rooftop catchment areas found in NYC (51–7502m 2 ), toilet flushing demand can be met with 7–40% reliability, with lower end of the range representing buildings with high flow toilets and no storage elements, and the upper end representing buildings that feature low flow fixtures and storage tanks of up to 502m 3 . When the reliability curves developed are used to size RWH systems to flush the low flow toilets of all multifamily buildings found a typical residential neighborhood in the Bronx, rooftop runoff inputs to the sewer system are reduced by approximately 28% over an average rainfall year, and potable water demand is reduced by approximately 53%.
|
| [5] |
DOI:10.1016/j.apgeog.2016.09.013
URL
Rainwater-harvesting tanks (reservoirs) in Tamil Nadu, India support agricultural livelihoods, mitigate water insecurity, and enable ecosystem services. However, many tanks have fallen into disrepair, as private wells have supplanted collectively managed tanks as the dominant irrigation source. Meanwhile, encroachment by peri-urban development, landless farmers, and Prosopis juliflora has reduced inflow and tank capacity. This exploratory study presents a conceptual framework and proposed indicator set for measuring water security in the context of rainwater harvesting tanks. The primary benefits of tanks and threats to their functionality are profiled as a precursor to construction of a causal network of water security. The causal network identifies the key components, causal linkages, and outcomes of water security processes, and is used to derive a suite of indicators that reflect the multiple economic and socio-ecological uses of tanks. Recommendations are provided for future research and data collection to operationalize the indicators to support planning and assessing the effectiveness of tank rehabilitation.
|
| [6] |
DOI:10.7916/D8FF3S23
URL
[CJCR: 1]
The global water crisis is predicted to kill 34 to 76 million people by 2020. Large-scale infrastructure projects can provide water, but construction of these projects has not proven adequate to meet growing populations and, even where feasible, large-scale projects have significant social, economic and environmental impacts. A different path to solving the global water crisis that emphasizes efficiency and sustainable, community-scale projects in addition to centralized infrastructure, has been mapped by a range of scholars and activists. Small scale rainwater harvesting is one sustainable approach that is proving increasingly effective in both rural and urban settings in the developing world.This paper surveys the use of rainwater harvesting in India and draws some lessons for the application of this approach to other regions.
|
| [7] |
DOI:10.1007/s40899-016-0066-3
URL
[CJCR: 1]
A mixed-integer nonlinear programming water distribution problem that incorporates water rationing is presented. The city of Bulawayo water distribution problem is implemented and solved using max–min ant system, genetic, tabu search, and simulated annealing algorithms with 100 runs performed for each algorithm. The results show that the city of Bulawayo can save $3158 a day. The max–min ant system produced the best optimal costs compared with the other algorithms. The least run time is obtained by implementing the tabu search algorithm. Water lost through hoarding during water-rationing periods contributes significantly to the total operational costs. Statistical analysis of the results obtained by different algorithms shows that the optimal costs obtained by tabu search, and simulated annealing algorithms are insignificantly different. Future research may be directed toward incorporating priority among water users and formulating a hybrid algorithm that uses both the max–min ant system and tabu search algorithms to solve such problems.
|
| [8] |
URL
ABSTRACT This paper discuss about the rainwater harvesting system and its implementation in Malaysia as part of the solution proposed by government to avoid water crisis in the future. It first reviewed the scenario of water shortage in Malaysia. In Malaysia, we are blessed with an ample supply of water because of abundant rains. Normally, we received the rainfall averaging around 2400mm for Peninsular Malaysia, 2360mm for Sabah and 3830mm for Sarawak. However, increasing water consumption by our industry, agricultural and household users had made our existing water supply infrastructure strained. Sandakan was among the early place that did not get enough treated water supply from its
|
| [9] |
|
| [10] |
DOI:10.1139/l04-112
URL
[CJCR: 1]
|
| [11] |
|
| [12] |
|
| [13] |
|
| [14] |
|
| [15] |
DOI:10.1002/sdr.4260100211
URL
Abstract System dynamics, systems thinking, and soft operations research (soft OR) all aspire to understanding and improvement of systems. In all, the first step interprets the real world into a description used in following stages. In system dynamics, description leads to equations of a model, simulation to understand dynamic behavior, evaluation of alternative policies, education and choice of a better policy, and implementation. Case studies, systems thinking, and soft OR usually lack the discipline of explicit model creation and simulation and so rely on subjective use of unreliable intuition for evaluating the complex structures that emerge from the initial description of the real system. Nevertheless, systems thinking and soft OR, with emphasis on eliciting information from-real-world participants, should contribute useful insights to system dynamics. Conversely, the model creation and simulation stages of system dynamics should contribute rigor and clarity to systems thinking and soft OR.
|
| [16] |
DOI:10.1007/s11269-008-9339-4
URL
[CJCR: 1]
The Conchos basin is the largest tributary to the lower part of the Rio Grande/Rio Bravo basin. During recent years a severe drought has affected México’s ability to deliver water from the Conchos basin as required by the 1944 Treaty. In addition, it has generated not only economic problems in the USA and México but also political frictions between these two countries. The Mexican Conchos river has historically contributed with the highest amount of water to USA as established on the water treaty. A Decision Support System (DSS) was developed for the Conchos basin in order to gain a better understanding of the water resources management process in the basin, and to identify the alternatives to improve the cited process. The DSS is a semi-distributed model, based on System Dynamics, and developed using Powersim software. The DSS has been used to evaluate 25 long and short tem water resources allocation alternatives for the two main basin’s users: Irrigation Districts and Water Treaty. Some of the most important factors being tested on the 25 water management alternatives include National Commission of Water’s yearly water allocation policy, reservoir operation rules, improvement on water distribution efficiencies, etc. The DSS model shows that the historic water resources allocation implemented by the Federal government produces adequate results as compared with the other tested water management alternatives. However, for short term drought scenarios, it is showed that there could be other management alternatives that could perform better than the current water management allocation. In general, the DSS shows what we already expect of dynamic models of systems to provide that understanding the effects of multiple interacting variables in necessary to develop good natural resource management policies.
|
| [17] |
DOI:10.1016/j.ecohyd.2013.03.007
URL
Rainwater harvesting (RWH) is increasingly relevant in the context of growing population and its demands on water quantity. Here, we present a method to better understand the hydrologic impacts of urban domestic and agricultural rainwater harvesting and apply the approach to three diverse watersheds within the Albemarle-Pamlico river basins in the southeastern USA. We summarize the design strategy of RWH and use of the Soil and Water Assessment Tool (SWAT) model to simulate baseline and RWH scenarios for urban and agricultural land uses. A high adoption rate (75 100%) of RWH throughout the watersheds reduced the downstream average monthly water yield up to 16%. A lower adoption rate (25%) reduced water yield approximately 6% for the Back Creek watershed (NC). We also present a ten-year average monthly low flow-based rainwater-harvest yield index (rainwater-harvest/water yield) as a RWH metric when comparing downstream impact on flows. The current study is intended to inform water resource sustainability and management decisions at the watershed scale.
|
| [18] |
DOI:10.2307/40982746
URL
[CJCR: 1]
Secondary data and survey information are used to develop a large data set for analyzing water demand in 221 communities. The resulting monthly data are employed to examine seasonal variability in consumer price sensitivity. Several functional forms are contrasted for their abilities to identify monthly price elasticities. Results demonstrate the statistical contribution of a new climate variable for fitting monthly data, generally indicate that summer price elasticities exceed winter price elasticities by 30%, and appear to reject the use of the translog functional form as well as traditional linear and Cobb-Douglas forms for statistical analyses of pooled monthly data. The generalized Cobb-Douglas and augmented Fourier forms are more viable alternatives for pooled monthly data.
|
| [19] |
DOI:10.4236/jwarp.2009.16052
URL
[CJCR: 1]
In India, with ever increasing population and stress on natural resources, especially water, rejuvenation of rainwater harvesting (RWH) technique which was forgotten over the days is becoming very essential. Large number of RWH methods that are available in the literature are demand specific and site specific, since RWH system depends on the topography, land use, land cover, rainfall and demand pattern. Thus for each and every case, a detailed evaluation of RWH structures is required for implementation, including the analysis of hydrology, topography and other aspects like site availability and economics, however a common methodology could be evolved. The present study was aimed at evaluation of various RWH techniques in order to identify the most appropriate technique suitable for a large scale industrial area to meet its daily water demand. An attempt is made to determine the volume of water to be stored using mass balance method, Ripple diagram method, analytical method, and sequent peak algorithm method. Based on various satisfying criteria, analytical hierarchy process (AHP) is employed to determine the most appropriate type of RWH method and required number of RWH structures in the study area. If economy alone is considered along with hydrological and site specific parameters, recharging the aquifer has resulted as a better choice. However other criteria namely risk, satisfaction in obtaining required volume of water for immediate utilization etc. has resulted in opting for concrete storage structures method. From the results it is found that AHP, if used with all possible criteria can result in a better tool for evaluation of RWH methods and structures. This RWH structures not only meets the demand but saves transportation cost of water and reduces the dependability of the industry on irrigation reservoir. Besides monetary benefits it is hoped that the micro environment inside the industry will improve due to the cooling effect of the stored water. Keywords: Rain Water Harvesting, Analytical Hierarchy Process, Large Scale Industrial Area, Aquifer Recharge, Surface Storage Structures, Concrete Storage Structures
|
| [20] |
DOI:10.1007/s40899-016-0069-0
URL
[CJCR: 1]
The study was conducted on the status of water supply at Indore through SDWQ. The performance of the Narmada and Devdharan WTPs was assessed from catchment to consumer for consecutive 702days during th
|
| [21] |
|
| [22] |
DOI:10.1579/0044-7447-29.8.477
URL
The rainwater harvesting agriculture (RHA) technology developed by scientists in Gansu, north-western China, over a decade ago, is an integrated system for water management on rainfed land in semi-arid areas to meet domestic and agricultural water needs. It consists of 3 main components: rainwater harvesting, water-conserving irrigation, and highly effective crop production. The preliminary imp...
|
| [23] |
DOI:10.1111/j.1752-1688.2006.tb04481.x
URL
[CJCR: 1]
ABSTRACT: Few studies have been conducted to explore the effects of initial abstraction on estimated direct runoff despite the widespread use of the curve number (CN) method in many hydrologic models to estimate direct runoff. In this study, use of a 5 percent ratio of initial abstraction (I a ) to storage (S) to estimate daily direct runoff with modified CN values for a 5 percent I a /S value was investigated using the Long-Term Hydrologic Impact Assessment (L-THIA) geographic information system (GIS). In addition, the effects on estimated runoff of altering the hydrologic soil group due to urbanization were investigated. The L-THIA model was applied to the Indiana Little Eagle Creek watershed with 5 percent and 20 percent I a /S values, considering hydrologic soil group alteration due to urbanization. The results indicate that uses of a 5 percent l a /S and modified CN values and Hydrologic Soil Group D for urbanized areas in model runs can improve long term direct runoff prediction.
|
| [24] |
|
| [25] |
DOI:10.3133/cir1405
URL
[CJCR: 2]
Estimates of water use in the United States indicate that about 410 billion gallons per day (Bgal/d) were withdrawn in 2005 for all categories summarized in this report. This total is slightly less than the estimate for 2000, and about 5 percent less than total withdrawals in the peak year of 1980. Freshwater withdrawals in 2005 were 349 Bgal/d, or 85 percent of the total freshwater and saline-water withdrawals. Fresh groundwater withdrawals of 79.6 Bgal/day in 2005 were about 5 percent less than in 2000, and fresh surface-water withdrawals of 270 Bgal/day were about the same as in 2000. Withdrawals for thermoelectric-power generation and irrigation, the two largest uses of water, have stabilized or decreased since 1980. Withdrawals for public-supply and domestic uses have increased steadily since estimates began. 聽 Thermoelectric-power generation water withdrawals were an estimated 201 Bgal/d in 2005, about 3 percent more than in 2000. In 2005, thermoelectric freshwater withdrawals accounted for 41 percent of all freshwater withdrawals. Nearly all of the water withdrawn for thermoelectric power was surface water used for once-through cooling at power plants. Twenty-nine percent of thermoelectric-power withdrawals were saline water from oceans and brackish coastal water bodies. 聽 Withdrawals for irrigation in 2005 were 128 Bgal/d, about 8 percent less than in 2000 and approximately equal to estimates of irrigation water use in 1970. In 2005, irrigation withdrawals accounted for 37 percent of all freshwater withdrawals and 62 percent of all freshwater withdrawals excluding thermoelectric withdrawals. Irrigated acreage increased from 25 million acres in 1950 to 58 million acres in 1980, then remained fairly constant before increasing in 2000 and 2005 to more than 60 million acres. The number of acres irrigated using sprinkler and microirrigation systems has continued to increase and in 2005 accounted for 56 percent of the total irrigated acreage. 聽 Water withdrawals for public supply were 44.2 Bgal/d in 2005, which is 2 percent more than in 2000, although the population increased by more than 5 percent during that time. Public supply accounted for 13 percent of all freshwater withdrawals in 2005 and 21 percent of all freshwater withdrawals excluding thermoelectric withdrawals. The percentage of the U.S. population obtaining drinking water from public suppliers has increased steadily from 62 percent in 1950 to 86 percent in 2005. Most of the population providing their own household water obtained their supplies from groundwater sources. 聽 Self-supplied industrial water withdrawals continued to decline in 2005, as they have since their peak in 1970. Self-supplied industrial withdrawals were an estimated 18.2 Bgal/d in 2005, a 30-percent decrease from 1985. An estimated 4.02 Bgal/d were withdrawn for mining in 2005, which is 11 percent less than in 2000, and 18 percent less than in 1990. Withdrawals for mining were only 58 percent freshwater. 聽 Livestock water use was estimated to be 2.14 Bgal/d in 2005, which is the smallest estimate since 1975, possibly due to the use of standardized coefficients for estimation of animal water needs. Water use for aquaculture was an estimated 8.78 Bgal/d in 2005, nearly four times the amount estimated in 1985. Part of this increase is due to the inclusion of more facilities in the estimates in 2005, and the use of standardized coefficients for estimating aquaculture use from other data. 聽 Fresh surface water was the source for a majority of the public-supply, irrigation, aquaculture, thermoelectric, and industrial withdrawals. Nearly 30 percent of all fresh surface-water withdrawals in 2005 occurred in five States. In California, Idaho, and Colorado, most of the fresh surface-water withdrawals were for irrigation. In Texas and Illinois, most of the fresh surface-water withdrawals were for thermoelectric power generation. 聽 About 67 percent of fresh groundwater withdrawals in 2005 were for irrigation, and 18 percent were for public supply. More than half of fresh groundwater withdrawals in the United States in 2005 occurred in six States. In California, Texas, Nebraska, Arkansas, and Idaho, most of the fresh groundwater withdrawals were for irrigation. In Florida, 52 percent of all fresh groundwater withdrawals were for public supply, and 34 percent were for irrigation.
|
| [26] |
DOI:10.1023/A:1010784727448
URL
[CJCR: 1]
The International Commission for the Hydrology of the Rhine basin (CHR) hascarried out a researchproject to assess the impact of climate change on the river flow conditionsin the Rhine basin. Along abottom-up line, different detailed hydrological models with hourly and dailytime steps have beendeveloped for representative sub-catchments of the Rhine basin. Along atop-down line, a water balancemodel for the entire Rhine basin has been developed, which calculates monthlydischarges and which wastested on the scale of the major tributaries of the Rhine. Using this set ofmodels, the effects of climatechange on the discharge regime in different parts of the Rhine basin werecalculated using the results ofUKHI and XCCC GCM-experiments. All models indicate the same trends in thechanges: higher winterdischarge as a result of intensified snow-melt and increased winterprecipitation, and lower summerdischarge due to the reduced winter snow storage and an increase ofevapotranspiration. When the resultsare considered in more detail, however, several differences show up. These canfirstly be attributed todifferent physical characteristics of the studied areas, but different spatialand temporal scales used in themodelling and different representations of several hydrological processes(e.g., evapotranspiration,snow melt) are responsible for the differences found as well. Climate changecan affect various socio-economicsectors. Higher temperatures may threaten winter tourism in the lower wintersport areas. The hydrologicalchanges will increase flood risk during winter, whilst low flows during summerwill adversely affectinland navigation, and reduce water availability for agriculture and industry.Balancing the required actionsagainst economic cost and the existing uncertainties in the climate changescenarios, a policy of `no-regretand flexibility' in water management planning and design is recommended, whereanticipatory adaptivemeasures in response to climate change impacts are undertaken in combinationwith ongoing activities.
|
| [27] |
|
| [28] |
|
| [29] |
DOI:10.1007/s00267-012-9965-8
PMID:23117399
URL
[CJCR: 1]
Abstract A dynamic water balance model is created to examine the effects of different water conservation policies and recycled water use on water demand and supply in a region faced with water shortages and significant population growth, the Las Vegas Valley (LVV). The model, developed using system dynamics approach, includes an unusual component of the water system, return flow credits, where credits are accrued for returning treated wastewater to the water supply source. In LVV, Lake Mead serves as, both the drinking water source and the receiving body for treated wastewater. LVV has a consumptive use allocation from Lake Mead but return flow credits allow the water agency to pull out additional water equal to the amount returned as treated wastewater. This backdrop results in a scenario in which conservation may cause a decline in the available water supply. Current water use in LVV is 9450002lpcd (2500002gpcd), which the water agency aims to reduce to 7520002lpcd (1990002gpcd) by 2035, mainly through water conservation. Different conservation policies focused on indoor and outdoor water use, along with different population growth scenarios, are modeled for their effects on the water demand and supply. Major contribution of this study is in highlighting the importance of outdoor water conservation and the effectiveness of reducing population growth rate in addressing the future water shortages. The water agency target to decrease consumption, if met completely through outdoor conservation, coupled with lower population growth rate, can potentially satisfy the Valley's water demands through 2035.
|
| [30] |
DOI:10.1155/2014/721357
PMID:3948194
URL
[CJCR: 1]
Water is considered an everlasting free source that can be acquired naturally. Demand for processed supply water is growing higher due to an increasing population. Sustainable use of water could maintain a balance between its demand and supply. Rainwater harvesting (RWH) is the most traditional and sustainable method, which could be easily used for potable and nonpotable purposes both in residential and commercial buildings. This could reduce the pressure on processed supply water which enhances the green living. This paper ensures the sustainability of this system through assessing several water-quality parameters of collected rainwater with respect to allowable limits. A number of parameters were included in the analysis: pH, fecal coliform, total coliform, total dissolved solids, turbidity, NH3???N, lead, BOD5, and so forth. The study reveals that the overall quality of water is quite satisfactory as per Bangladesh standards. RWH system offers sufficient amount of water and energy savings through lower consumption. Moreover, considering the cost for installation and maintenance expenses, the system is effective and economical.
|
| [31] |
|
| [32] |
|
| [33] |
DOI:10.1007/s12665-015-4257-2
URL
[CJCR: 1]
Bosten Lake, the largest inland freshwater lake in China, is similar to other lakes in arid regions in that it faces shrinkage of its area and a decrease in environmental quality due to climate change and anthropogenic pressures. A water and salt balance model, developed using system dynamics approach, was used to estimate potential contributions of natural and socio-economic factors to variations in the lake’s level and salinity. Calibration of the model provided new estimates of conversion coefficients for the actual evaporation and dissolved salt from the lake bed. The sensitivity analysis indicated that the lake’s level and average salinity have significant and high correlation with the water exchange rate and evaporation of surface water. Analysis showed that (1) increasing water exchange of the lake promoted a decreasing average salinity of the lake and an increasing water supply to the downstream area of the lake; (2) the average unproductive water lost was larger than half of the average surface water inflow; (3) enlarging the agricultural area in the Konqi River basin instead of the Kaidu River basin promoted a decrease in the lake’s salinity as well as a decrease in the total amount of salt in the lake. This study implies that increasingly efficient water management practices and greater conservation of water resources are required to save Bosten Lake and its ecosystem.
|
| [34] |
DOI:10.1007/s40899-016-0064-5
URL
[CJCR: 1]
Abstract A total of 21 water samples were collected from surface water (ponds and river) and groundwater samples from shallow tube well (STW) and deep tube well (DTW) from Gopalganj Sadar Upazila to evaluate the salinity hazard and suitability for irrigation purposes. Both surface and groundwater of the study area maintained the trend of Cl > SO > PO . The cation trend in both surface and groundwater of the study area was Na > K > Ca > Mg > Fe. Correlation matrices and principal component analysis (PCA) confirmed the effect on water quality from elevated electrical conductivity (EC) and TDS with Na , K , Cl and total hardness (TH) in relation to Ca , Mg , PO and SO . Salinity hazard classification and Wilcox diagram for irrigation water classification demonstrate that shallow tube wells containing low alkali and low sodium hazard are an excellent source of irrigation waters and fall under good to fair class of water (55 % samples). Higher TH, sodium adsorption ratio (SAR), soluble sodium percentage (SSP) and other important analysis indicated that most of the surface water and DTW were not suitable for irrigation. Therefore, the best irrigation water quality was from STW. Nevertheless, to sustainably and efficiently utilize the existing water resources, cyclic conjunctive uses of river water, STW and DTW as well as excavation of pond to store rainwater were suggested.
|
| [35] |
|
| [36] |
DOI:10.1007/s11069-004-0785-x
URL
[CJCR: 1]
A computerized simulation model for capturing human behavior during flood emergency evacuation is developed using a system dynamics approach. It simulates the acceptance of evacuation orders by the residents of the area under threat; number of families in the process of evacuation; and time required for all evacuees to reach safety. The model is conceptualized around the flooding conditions (physical and management) and the main set of social and mental factors that determine human behavior before and during the flood evacuation. The number of families under the flood threat, population in the process of evacuation, inundation of refuge routes, flood conditions (precipitation, river elevation, etc.), and different flood warnings and evacuation orders related variables are among the large set of variables included in the model. They are linked to the concern that leads to the danger recognition, which triggers evacuation decisions that determine the number of people being evacuated. The main purpose of the model is to assess the effectiveness of different flood emergency management procedures. Each procedure consists of the choice of flood warning method, warning consistency, timing of evacuation order, coherence of the community, upstream flooding conditions, and set of weights assigned to different warning distribution methods. Model use and effectiveness are tested through the evaluation of the effectiveness of different flood evacuation emergency options in the Red River Basin, Canada.
|
| [37] |
DOI:10.1016/S0301-4797(02)00205-0
PMID:12710919
URL
[CJCR: 1]
Water managers increasingly are faced with the challenge of building public or stakeholder support for resource management strategies. Building support requires raising stakeholder awareness of resource problems and understanding about the consequences of different policy options. One approach that can help managers communicate with stakeholders is system dynamics modeling. Used interactively in a public forum, a system dynamics model can be used to explain the resource system and illustrate the effects of strategies proposed by managers or suggested by forum participants. This article illustrates the process of building a strategic-level system dynamics model using the case of water management in Las Vegas, Nevada. The purpose of the model was to increase public understanding of the value of water conservation in Las Vegas. The effects of policies on water supply and demand in the system are not straightforward because of the structure of the system. Multiple feedback relationships lead to the somewhat counterintuitive result that reducing residential outdoor water use has a much greater effect on water demand than reducing indoor water use by the same amount. The model output shows this effect clearly. This paper describes the use of the model in research workshops and discusses the potential of this kind of interactive model to stimulate stakeholder interest in the structure of the system, engage participant interest more deeply, and build stakeholder understanding of the basis for management decisions.
|
| [38] |
|
| [39] |
DOI:10.3390/hydrology3020024
URL
[CJCR: 1]
The study focused on investigating the presence of change patterns in 600 unimpaired streamflow stations across the continental U.S. at different time intervals to understand the change patterns that can provide significant insight regarding climate variability and change. Each station had continuous streamflow data of at least 30 years (the entire dataset covered a range of 109 years). Presence of trends and shifts were detected in water year and the four seasons (fall, winter, spring, and summer) analyzing the water year and seasonal mean flows. Two non-parametric tests, namely, the Mann-Kendall test and the Pettitt鈥檚 test were used to identify the trends and the shifts, respectively. The results showed an increasing trend in the northeast and upper-mid regions, whereas southeast and northwest regions underwent a decrease. Shifts followed similar patterns as trends with higher number of stations with significant change. Fall and spring showed the highest number of stations with increasing and decreasing change, respectively, in the seasonal analyses. Results of this study may assist water managers to understand the streamflow change patterns across the continental U.S., especially at the regional scale since this study covers a long range of years with a large number of stations in each region.
|
| [40] |
DOI:10.2166/wcc.2016.162
URL
[CJCR: 1]
This study investigated the correlation between western US streamflow and two of the most important oceanic–atmospheric indices having significant effects in this region, namely, El Ni09o Southern Oscillation (ENSO) and Pacific Decadal Oscillation (PDO). Data from 61 streamflow stations across six different hydrologic regions of the western USA were analyzed, using a study period of 60 years from 1951 to 2010. Continuous wavelet transformation along with cross wavelet transformation and wavelet coherence were used to analyze the interaction between streamflow and climate indices. The results showed that streamflows have changed coincidentally with both ENSO and PDO over the study period at different time-scale bands and at various time intervals. Both ENSO and PDO showed correlation with streamflow change behavior from 1980 to 2005. ENSO showed a strong correlation with streamflow across the entire study period in the 10–12 year band. PDO showed a strong correlation in bands of 8–10 years and bands beyond 16 years. The phase relationship showed that both ENSO and PDO preceded streamflow change behavior; in some instances, the variables were found to be moving in opposite directions even though they changed simultaneously. The results can be helpful in understanding the relationship between the climate indices and streamflow.
|
| [41] |
DOI:10.1007/s11269-017-1659-9
URL
[CJCR: 1]
Abstract This study evaluated the correlation between the western U.S. snow water equivalent (SWE) and two major oceanic-atmospheric indices of the Pacific Ocean, namely, the El Ni帽o Southern Oscillation (ENSO) and the Pacific Decadal Oscillation (PDO), using continuous wavelet transformation and its derivatives. Snow Telemetry (SNOTEL) data for 1 April SWE from 323 sites (out of which 258 are in six hydrologic regions) were obtained for a study period of 56 years (1961鈥2016). The results showed that ENSO had a much higher influence than PDO throughout the western U.S. SWE across the study period. Both ENSO and PDO showed a higher correlation with SWE at multiple timescale bands across different time intervals, although significant intervals in the higher timescales were of longer duration. ENSO showed a higher correlation in the 10-to-16-years band across the entire study period as well as in the lower timescales. PDO showed a higher correlation below the 4-years band. The relative phase relationship suggested that ENSO led SWE, with certain lags, while both were moving in the same direction in many instances. The lag-response behavior of SWE and PDO was not found to be uniform. The regional analyses, based on the western U.S. hydrologic regions, suggested significant variation across the adjacent regions in terms of their correlation with ENSO/PDO. Association with ENSO was also observed to be higher compared to PDO among the regions. Regions close to the ocean and at lower elevation showed higher correlation compared to the inland regions with higher elevation.
|
| [42] |
DOI:10.1007/s11269-016-1479-3
URL
[CJCR: 1]
Abstract The Ethiopian government has been working on rainwater harvesting (RWH) for more than three decades. Despite its efforts, the results are not as expected. Different barriers have posed challenges to promoting RWH in Ethiopia. This study was done to identify the main problems and obstacles, and reflect on potential solutions. As a result, absence of clear policy definitions, lack of sustainably implemented projects, poor societal perceptions of RWH, local professionals lacking proper knowledge, and initial investment costs are found to be major causes of poor outcomes. Considering the site-specific nature of water issues, the authors propose various management strategies such as policy-oriented promotion, formulation of design guidelines, proactive planning, collaborative research, and integration of RWH with cost covering practices.
|
| [43] |
|
| [44] |
|
| [45] |
DOI:10.1007/s00027-004-0722-9
URL
[CJCR: 1]
The watersheds in which we live are comprised of a complex set of physical and social systems that interact over a range of spatial and temporal scales. These systems are continually evolving in response to changing climatic patterns, land use practices and the increasing intervention of humans. Management of these watersheds benefits from the development and application of models that offer a comprehensive and integrated view of these complex systems and the demands placed upon them. The utility of these models is greatly enhanced if they are developed in a participatory process that incorporates the views and knowledge of relevant stakeholders. System dynamics provides a unique mathematical framework for integrating the physical and social processes important to watershed management, and for providing an interactive interface for engaging the public. We have employed system dynamics modeling to assist in community-based water planning for a three-county region in north-central New Mexico. The planning region is centered on a ~165-km reach of the Rio Grande that includes the greater Albuquerque metropolitan area. The challenge, which is common to other arid/semi-arid environments, is to balance a highly variable water supply among the demands posed by urban development, irrigated agriculture, river/reservoir evaporation and riparian/in-stream uses. A description of the model and the planning process are given along with results and perspectives drawn from both.
|
| [46] |
DOI:10.1007/s11269-009-9457-7
URL
This paper describes a water accounting system (WAS) that has been developed as an innovative new tool for strategic long-term water management. The WAS incorporates both disaggregated water use and availability, provides a comprehensive and consistent historical database, and can integrate climate and hydrological model outputs for the exploration of scenarios. It has been established and tested for the state of Victoria in Australia, and can be extended to cover other or all regions of Australia. The WAS is implemented using stock-and-flow dynamics, currently employing major river basins as the spatial units and a yearly time step. While this system shares features with system dynamics, learning is enhanced and strategic management of water resources is improved by application of a Design Approach and the structure of the WAS. We compare the WAS with other relevant accounting systems and outline its benefits, particularly the potential for resolving tensions between water supply and demand. Integrated management is facilitated by combination with other stocks and flows frameworks that provide data on key drivers such as demography, land-use and electricity production.
|
| [47] |
|
| [48] |
DOI:10.1016/j.scitotenv.2011.03.018
PMID:21514626
URL
This study evaluates the impact of urban growth in the Las Vegas Valley (LVV), Nevada, USA on salinity of the Colorado River. In the past thirty eight years the LVV population has grown from 273,288 (1970) to 1,986,146 (2008). The wastewater effluents and runoff from the valley are diverted back to the Colorado River through the Las Vegas Wash (LVW). With the growth of the valley, the salinity released from urban areas has increased the level of TDS in the wastewater effluents, ultimately increasing the TDS in the Colorado River. The increased usage of water softeners in residential and commercial locations is a major contributor of TDS in the wastewater effluents. Controlling TDS release to the Colorado River is important because of the 1944 Treaty signed between the USA and Mexico. In addition, the agriculture salinity damage cost for the Colorado River has been estimated to be more than $306 a million per year using 2004 salinity levels. With the expected growth of LVV in coming years the TDS release into Lake Mead will increase over time. For this purpose, it is important to investigate future TDS release into the Colorado in anticipation of potential TDS reducing measures to be adopted. In this research, a dynamic simulation model was developed using system dynamics modeling to carry out water and TDS mass balances over the entire LVV. The dynamic model output agreed with historic data with an average error of 2%. Forecasts revealed that conservation efforts can reduce TDS load by 16% in the year 2035 when compared to the current trend. If total population using water softeners can be limited to 10% in the year 2035, from the current 30% usage, TDS load in the LVW can be reduced by 7%.
|
| [49] |
DOI:10.2166/wst.2010.783
PMID:20057094
URL
[CJCR: 1]
The rate of uptake of rainwater harvesting (RWH) in the UK has been slow to date, but is expected to gain momentum in the near future. The designs of two different new-build rainwater harvesting systems, based on simple methods, are evaluated using three different design methods, including a continuous simulation modelling approach. The RWH systems are shown to fulfill 36% and 46% of WC demand. Financial analyses reveal that RWH systems within large commercial buildings maybe more financially viable than smaller domestic systems. It is identified that design methods based on simple approaches generate tank sizes substantially larger than the continuous simulation. Comparison of the actual tank sizes and those calculated using continuous simulation established that the tanks installed are oversized for their associated demand level and catchment size. Oversizing tanks can lead to excessive system capital costs, which currently hinders the uptake of systems. Furthermore, it is demonstrated that the catchment area size is often overlooked when designing UK-based RWH systems. With respect to these findings, a recommendation for a transition from the use of simple tools to continuous simulation models is made.
|
| [50] |
|
| [51] |
|
| [52] |
DOI:10.1002/hyp.9592
URL
[CJCR: 1]
The Soil Conservation Service (SCS) curve number (CN) estimates of direct runoff from rainfall for semiarid catchments can be inaccurate. Investigation of the Walnut Gulch Experimental Watershed (WGEW) (Southeastern Arizona) and its ten nested catchments determined that the inaccuracy is due to the original SCS ratio (脦禄) of 0.2 between initial abstraction and maximum potential retention. Sensitivity analyses indicate that runoff estimation can be very sensitive to the initial abstraction ratio, especially for relatively low rainfall amount and for watersheds covered by deep, coarse, and porous soil, conditions that dominate many semiarid watersheds worldwide. Changing the ratio of initial abstraction to the maximum potential retention to optimal values ranging from 0.01 to 0.53 for different Walnut Gulch catchments improved runoff estimates. The greater the channel area and the finer the soil, the smaller the initial abstraction ratio is. The variation of the initial abstraction ratio for the WGEW is due to the variation of maximum potential retention and initial abstraction, which are channel area and soil-dependent parameters. The greater the channel area, the higher the maximum potential retention S is, and the coarser the soil, the larger the initial abstraction Ia is. In addition, the effect of initial abstraction ratio on runoff estimation increases with decreasing CN. Thus, impacts of initial abstraction ratio on runoff estimation should be considered, especially for semiarid watersheds where the CN is usually low. Copyright 脗漏 2012 John Wiley & Sons, Ltd.
|
| [53] |
DOI:10.1007/s00477-015-1028-2
URL
Snowmelt and water infiltration are two important processes of the hydrological cycle in alpine basins where snowmelt water is a main contributor of streamflow. In insufficiently gauged basins, hydrologic modeling is a useful approach to understand the runoff formation process and to simulate streamflow. In this study, an existing hydrologic model based on the principles of system dynamics was modified by using the effective cumulative temperature (>002°C) to calculate snowmelt rate, and the soil temperature to adjust the influence of the soil’s physical state on water infiltration. This modified model was used to simulate streamflows in the Kaidu River basin from 1982 to 2002, including normal, high, and low flows categorized by the Z index. Sensitivity analyses, visual inspection, and statistical measures were employed to evaluate the capability of the model to simulate various components of the streamflow. Results showed that the modified model was robust, and able to simulate the three categories of flows well. The model’s ability to reproduce streamflow in low-flow and normal-flow years was better than that in high-flow years. The model was also able to simulate the baseflow. Further, its ability to simulate spring-peak flow was much better than its ability to simulate the summer-peak flow. This study could provide useful information for water managers in determining water allocations as well as in managing water resources.
|
