

 ,
, The Palmer drought severity index (PDSI), standardized precipitation index (SPI), and standardized precipitation evapotranspiration index (SPEI) are used worldwide for drought assessment and monitoring. However, substantial differences exist in the performance for agricultural drought among these indices and among regions. Here, we performed statistical assessments to compare the strengths of different drought indices for agricultural drought in the North China Plain. Small differences were detected in the comparative performances of SPI and SPEI that were smaller at the long-term scale than those at the short-term scale. The correlation between SPI/SPEI and PDSI considerably increased from 1- to 12-month lags, and a slight decreasing trend was exhibited during 12- and 24-month lags, indicating a 12-month scale in the PDSI, whereas the SPI was strongly correlated with the SPEI at 1- to 24-month lags. Interestingly, the correlation between the trend of temperature and the mean absolute error and its correlation coefficient both suggested stronger relationships between SPI and the SPEI in areas of rapid climate warming. In addition, the yield-drought correlations tended to be higher for the SPI and SPEI than that for the PDSI at the station scale, whereas small differences were detected between the SPI and SPEI in the performance on agricultural systems. However, large differences in the influence of drought conditions on the yields of winter wheat and summer maize were evident among various indices during the crop-growing season. Our findings suggested that multi-indices in drought monitoring are needed in order to acquire robust conclusions.
Drought, one of the most severe and frequently occurring natural hazards with diverse geographical and temporal distributions, imposes substantial damages and challenges to ecosystems and human society (Hao and Singh, 2015; Jiang et al., 2015). Drought may affect a wide variety of sectors such as economic, agricultural, ecological, and environmental processes worldwide (Du et al., 2013). The large spatial coverage and long-duration characteristics make drought one of the most widespread and costliest natural disasters (Potopová et al., 2015). Generally, drought is initially caused by deficiencies in precipitation for a particular period in association with global climatic circulation patterns (Nichol and Abbas, 2015). Meanwhile, regional drought can cause global impacts such as fluctuation in global food prices induced by drought (Wegren, 2011). These issues highlight the importance of agricultural drought monitoring (AghaKouchak et al., 2015). Therefore, timely and accurate monitoring of drought severity is an important means for water management and drought mitigation efforts (Mishra and Singh, 2010; Mu et al., 2013). As reported by Wilhite and Glantz (1985), droughts are classified into four categories, i.e., meteorological, agricultural, hydrological, and social economic droughts. Meteorological drought is a precipitation deficit caused by atmospheric evaporation; agricultural drought is related to soil moisture deficits; hydrological drought is related to deficits in surface and subsurface water; and social-economical drought refers to the influence of meteorological drought on the socio-economical system (Hao et al., 2015).
Drought is considered to be the most complex of all natural hazards (Dai, 2011). Temporal-spatial identification is difficult owing to the challenges in identifying the moments of beginning and ending of a drought and in quantifying its magnitude, duration, and spatial extent (Vicente-Serrano et al., 2012). Thus, numerous indices have been developed as universally accepted tools used to quantify drought impact (Heim, 2002). Several indices are widely used for regional- to global-scale drought assessment and monitoring. For example, the Palmer drought severity index (PDSI) that derived from precipitation and temperature has been widely used for drought monitoring and assessment (Palmer, 1965; Alley, 1984). This index is based on the demand and supply of the water balance model to measure both wetness (positive values) and dryness (negative values) (Wells et al., 2004). However, a major limitation of PDSI is its fixed time scales and incomparable parameters across different areas (Alley, 1984). The standardized precipitation index (SPI) (McKee et al., 1993) is recommended by the World Meteorological Organization as a standard drought monitoring index for meteorological drought monitoring and analysis. The principle of the SPI is based on conversion of the precipitation data to probabilities by using gamma distribution, the results of which are then used to determine the intensity, duration, and frequency of drought at given time scale. The common advantage of the SPI is its multi-temporal character. Such a feature is essential for assessing drought impacts owing to its flexibility and ease in operation in practical drought monitoring. However, the main criticism of the SPI is that its calculation is based on only precipitation data. The recently developed standardized precipitation evapotranspiration index (SPEI) (Vicente-Serrano et al., 2010) has been claimed to outperform the two previous indices (Vicente-Serrano et al., 2012). Both the sensitivity of the PDSI to changes in evaporation demand caused by temperature and simplicity of calculation and the multi-temporal nature of the SPI are considered in the SPEI framework.
It should be noted that the aforementioned drought indices have likely led to differences in values and change patterns caused mainly by dataset availability and resolution, particularly at relatively small scales (Dai, 2013). As a result, high uncertainty may exist in selecting a single drought index for a specific purpose (Vicente-Serrano et al., 2012). Therefore, it is essential to choose solid and objective criteria for selecting a drought index to be used for a specific task. Recently, great efforts have been made to meet the need for more accurate evaluations for better decision making in drought mitigation and the use of various objective indices. However, very few studies have performed robust statistical assessments by comparing the strengths of various drought indices for agricultural drought. Vicente-Serrano et al. (2012) provided a global assessment of the performance of different drought indices for monitoring drought impacts on several hydrological, agricultural, and ecological response variables. Zhai et al. (2010) investigated the spatial variation and trends in PDSI and SPI and their relationship to stream flow in 10 large regions of China. Potop (2011) compared different indices to assess drought impacts on corn yield in Moldova. Mavromatis (2010) evaluated several drought indices for their abilities to monitor soil moisture. Yang et al. (2017) determined the regional applicability of seven meteorological drought indices in China. Additionally, other studies have compared drought indices to assess the responses of vegetation activity, tree-ring characteristics, and fire frequency (Kempes et al., 2008; Quiring and Ganesh, 2010; Drobyshev et al., 2012).
To our knowledge, few studies have compared the performances of PDSI, SPI, and SPEI on agricultural drought in the North China Plain (NCP). It should be noted that the NCP is major grain production area and thus plays a key role in food security. Such a comparison is necessary to obtain solid and objective criteria for selecting drought indices to be used for a specific purpose. Therefore, the primary purpose of this study is to analyze the performance of the aforementioned widely used drought indices for agricultural drought in the NCP. To achieve this objective, several steps are performed. First, we analyze the consistency among the three indices, and we calculate their correlation coefficients. Next, we discuss the influence of ongoing warming on the relationship between the SPI and SPEI. Finally, we calculate the correlation coefficient of each drought index and the crop yield of both winter wheat and summer maize.
The NCP, formed mainly by the Yellow, Huaihe, Haihe, and Luanhe rivers, is the second largest plain in China (Fig. 1). Owing to its flat terrain and fertile soil, the NCP is the main production area of food crops, with winter wheat and summer maize rotation as the main cropping pattern (Hu et al., 2010). The cultivated land area in the NCP accounts for 27.9% of the total arable land in China. The climate of the NCP is warm temperate semi-humid continental monsoon, and the precipitation is between 400 and 600 mm, occurring mainly in summer. Significant inter-annual and intra-annual variations of precipitation also exist, resulting in frequent drought and flooding in this region. With an occurrence of 9 times in 10 years (Hu, 2013), drought severely affects the agricultural production and is the most prominent natural hazard in this region.
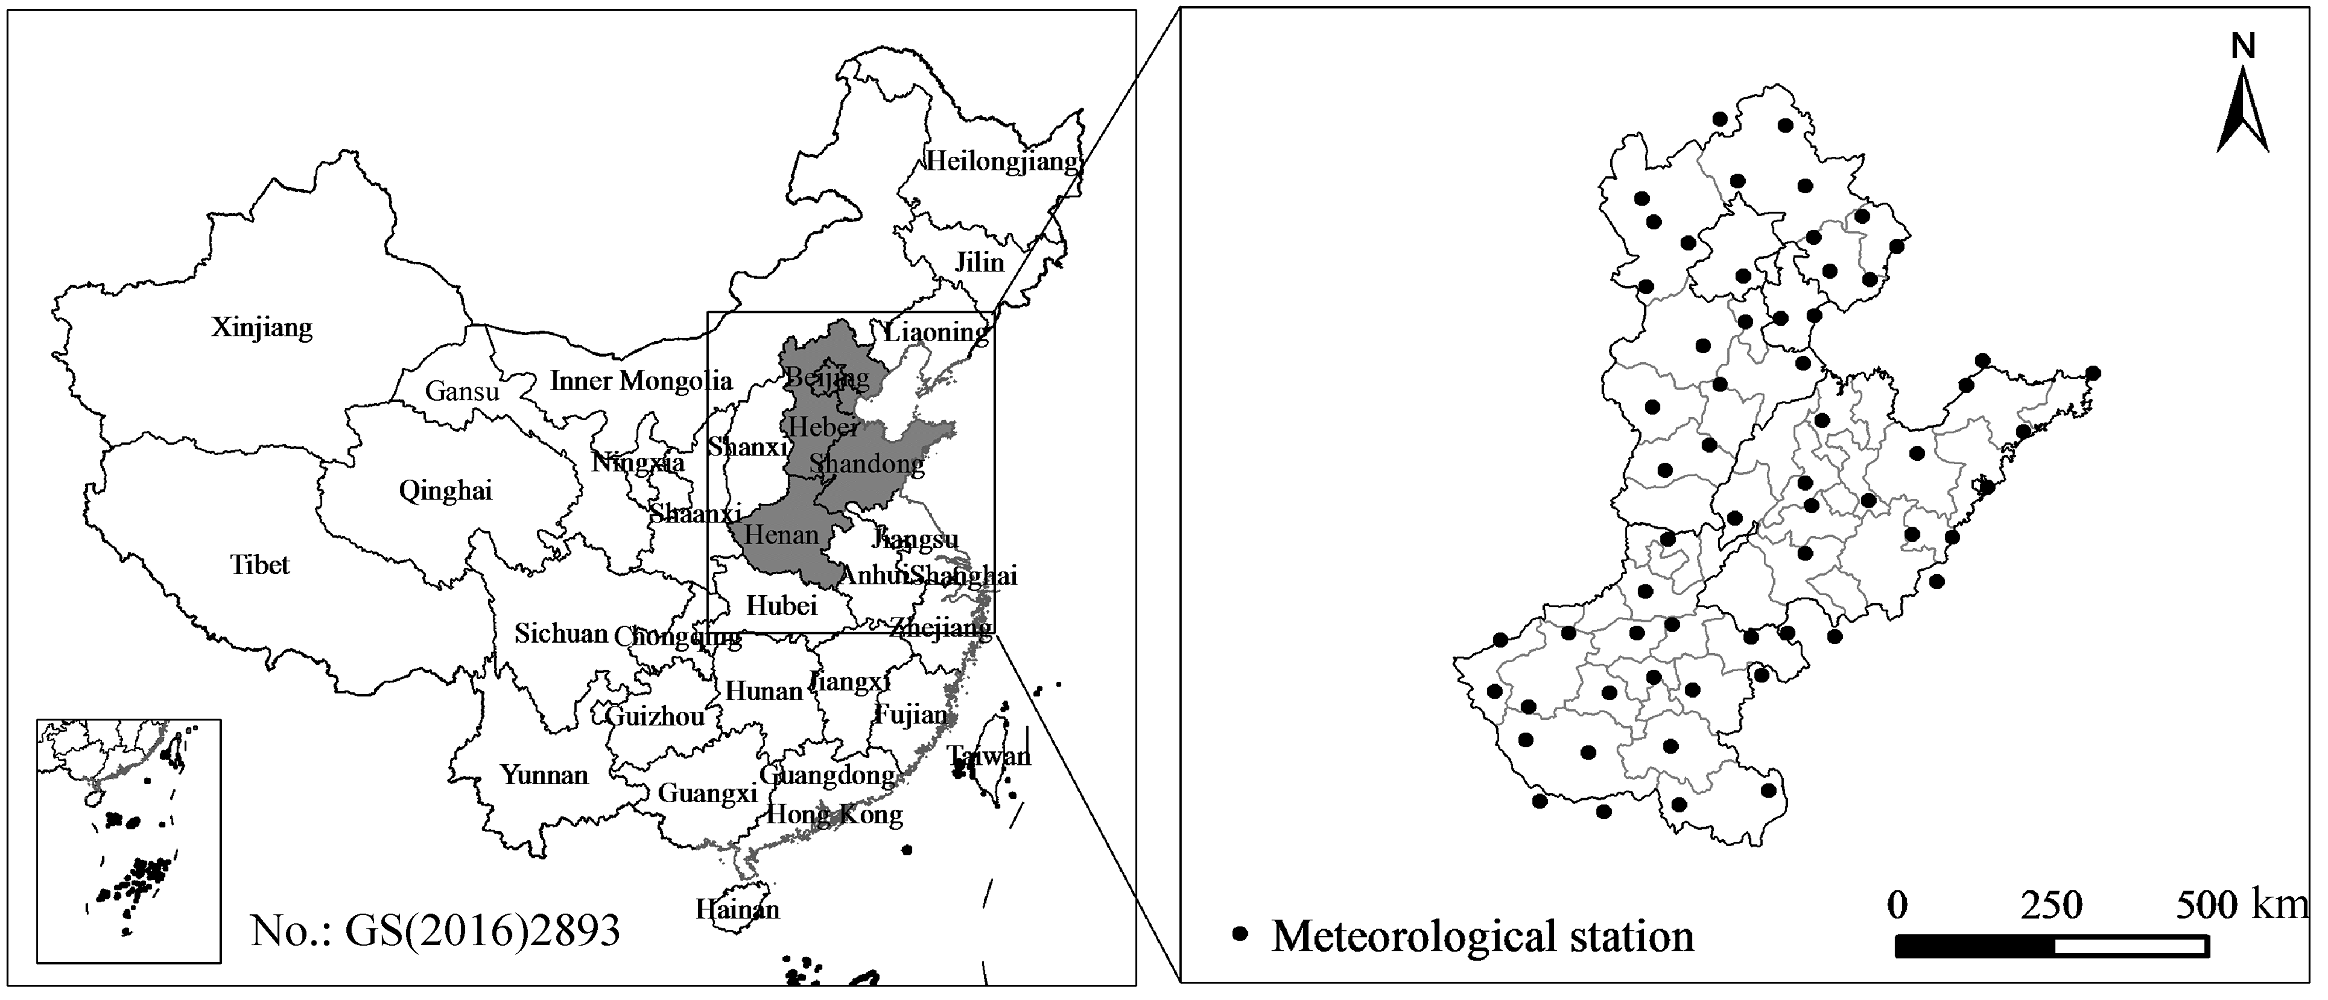
Fig. 1
Study area and meteorological station distribution
Meteorological data of 60 meteorological stations in the NCP during 1980-2013, consisting of daily mean temperature, daily maximum temperature, daily minimum temperature, relative humidity, sunshine hours, wind speed, and precipitation, were collected from the China Meteorological Data Sharing Service System (http://data.cma.gov.cn/). In addition, soil data, such as soil water content, were derived from the Institute of Soil Science, Chinese Academy of Sciences. We used precipitation data to obtain SPI, and other climate data variables to calculate PET based on the PM model. Then, we calculated SPEI on the basis of precipitation and PET (Vicente-Serrano et al., 2010). We obtained PDSI on the basis of all climate and soil datasets (Palmer, 1965).
To determine the performances of the various drought indices for agricultural drought, we used crop yield data to reflect the strengths of the indices in monitoring agricultural drought. Crop yield data of winter wheat and summer maize from 12 agricultural meteorological stations were collected from the China meteorological data network (http://data.cma.gov.cn) covering the period 2000-2013. Only stations that recorded both meteorological and yield datasets with a minimum time series of 10 years were selected in this study. Based on these criteria, we extracted 12 stations over the NCP for assessing the performance of drought indices on winter wheat yield variability, and we only selected 5 stations for summer maize. It should be noted that the scarcity datasets highlight the challenges involved in developing this type of research.
Pearson's correlation analysis was employed to examine the correlation among drought indices as well as their relationships with crop yield. The correlation coefficients from 1- to 24-month lags of the SPI and SPEI were calculated to reflect the different responses of crop yield to drought events. In the analysis, the crop yield data were detrended by using the Z-score method to eliminate the influence of non-climatic factors, such as improved technologies for crop production and field management (Mavromatis, 2007). Moreover, to compare the results of the different crops, we further standardized the time series records of the winter wheat and summer maize yields. The drought indices time series of SPI, SPEI, and PDSI were also detrended in the correlation analysis in order to focus analysis on correlation in inter-annual variability.
To investigate the influence of climate warming on the differences between the SPI and SPEI, we first calculated the trend of temperature (TEM) for all meteorological stations during 1981-2014. Then, the mean absolute error (MAE) between the SPI and SPEI was also calculated. Finally, we performed correlations between the TEM and MAE, and between the TEM and correlation coefficients (CC) of the SPI and SPEI. Additionally, in order to investigate the performance of different drought indices for agriculture drought, the variation in crop yield as an indicator of drought influence, and we correlated the detrended crop yield and the PDSI, as well as 1- to 24-month SPI and SPEI. It should be noted that we separated the crops of winter wheat and summer maize in the processing analysis to compare the possible differences of drought indices on different crops.
To compare the performances of various drought indices on drought events, we analyzed the monthly time series of the SPI, SPEI with 1-, 3-, 6-, and 12-month lags, and PDSI for all stations during 1981-2014 (Fig. 2). The root mean square error (RMSE) of the differences between SPI and SPEI decreased as time scale increased, indicating that SPI and SPEI at long-term scale reflect long-term water deficit conditions in a certain region that is free of the influence of short-term climate variability. Conversely, the short-term drought indices revealed a near-term water deficit condition and were more apt to be affected by weather such as temperature increases or precipitation deficits. In addition, the differences among the PDSI, SPI, and SPEI were compared only for the 12-month lag because the PDSI has a fixed scale of 9-12 months (Jiang et al., 2015). Although all drought indices were able to detect the main drought events in the NCP during the recent 30 years, certain differences were identified in drought intensity derived by the PDSI and SPI as well as those by the PDSI and SPEI (Fig. 2). For example, the drought events in 2002 and 2014 were more clearly detected by the PDSI than the other two drought indices. It should be noted that although the SPI and SPEI have smaller differences and more flexible time scales than the PDSI, the principle of SPEI is more clear and robust because it combines both principles of SPI and PDSI.

Fig. 2
Drought evolution of the standardized precipitation index (SPI), standardized precipitation evapotranspiration index (SPEI), and Palmer drought severity index (PDSI) in the North China Plain (NCP) during 1981-2014 (a) and the root mean square error (RMSE) of the difference between SPI and SPEI at the 1- to 12-month scale (b). The red color indicates drought episode, whereas blue color indicates wet episode.
Figure 3 shows the Pearson's correlations between the detrended PDSI and 1- to 24-month detrended SPI and SPEI during 1981-2014 for all stations. The correlation between SPI and PDSI increased considerably from lags of 1 month to 12 months, and a slight decreasing trend was exhibited during 12- and 24-month lags (Fig. 3a). These results suggest that the PDSI can effectively reflect the conditions of a 12-month water deficit. The same pattern was also detected in the correlation between the SPEI and PDSI (Fig. 3b). The SPI was strongly correlated with the SPEI at lags of 1 to 24 months, with a mean correlation coefficient above 0.90 for all available stations in the NCP. It should be noted that the error bar in Figure 3c, expressed in terms of standard deviation, gradually decreased from 1- to 12-month lags, which further demonstrates the result shown in Figure 2b.

Fig. 3
Correlation among three drought indices at 1-month lag to 24-month lag. Bars indicate standard deviation.
A negative correlation was detected between the TEM and MAE, indicating a stronger correlation between them in areas of rapid climate warming; and the determination coefficient (R2) was 0.203 (Fig. 4a). This phenomenon was also identified in the correlation between the TEM and CC, with an R2 of 0.182 (Fig. 4b). To compare the detailed differences in different areas, we conducted the same experiment in Hebei, Henan, and Shandong provinces (Fig. 1). The R2 values of the TEM and MAE were 0.298 and 0.274 in Hebei and Henan provinces, respectively, whereas those of the TEM and CC for these two provinces were 0.228 and 0.315, respectively. It should be noted that this phenomenon was not obvious in Shandong Province (data not shown). Our findings are in contrast to previous conclusions in which the SPI exhibited increasing differences with the SPEI when the temporal trends of temperature were conspicuous (Vicente-Serrano et al., 2010; Jiang et al., 2015). This result occurred likely because the precipitation deficit is the dominant factor to cause drought in the NCP, and the temperature has a limited contribution to drought evolution. Moreover, the contribution of temperature in areas of rapid climate warming is smaller than that in inconspicuous warming regions. However, a better-designed experiment would allow the acquisition of more robust conclusions.
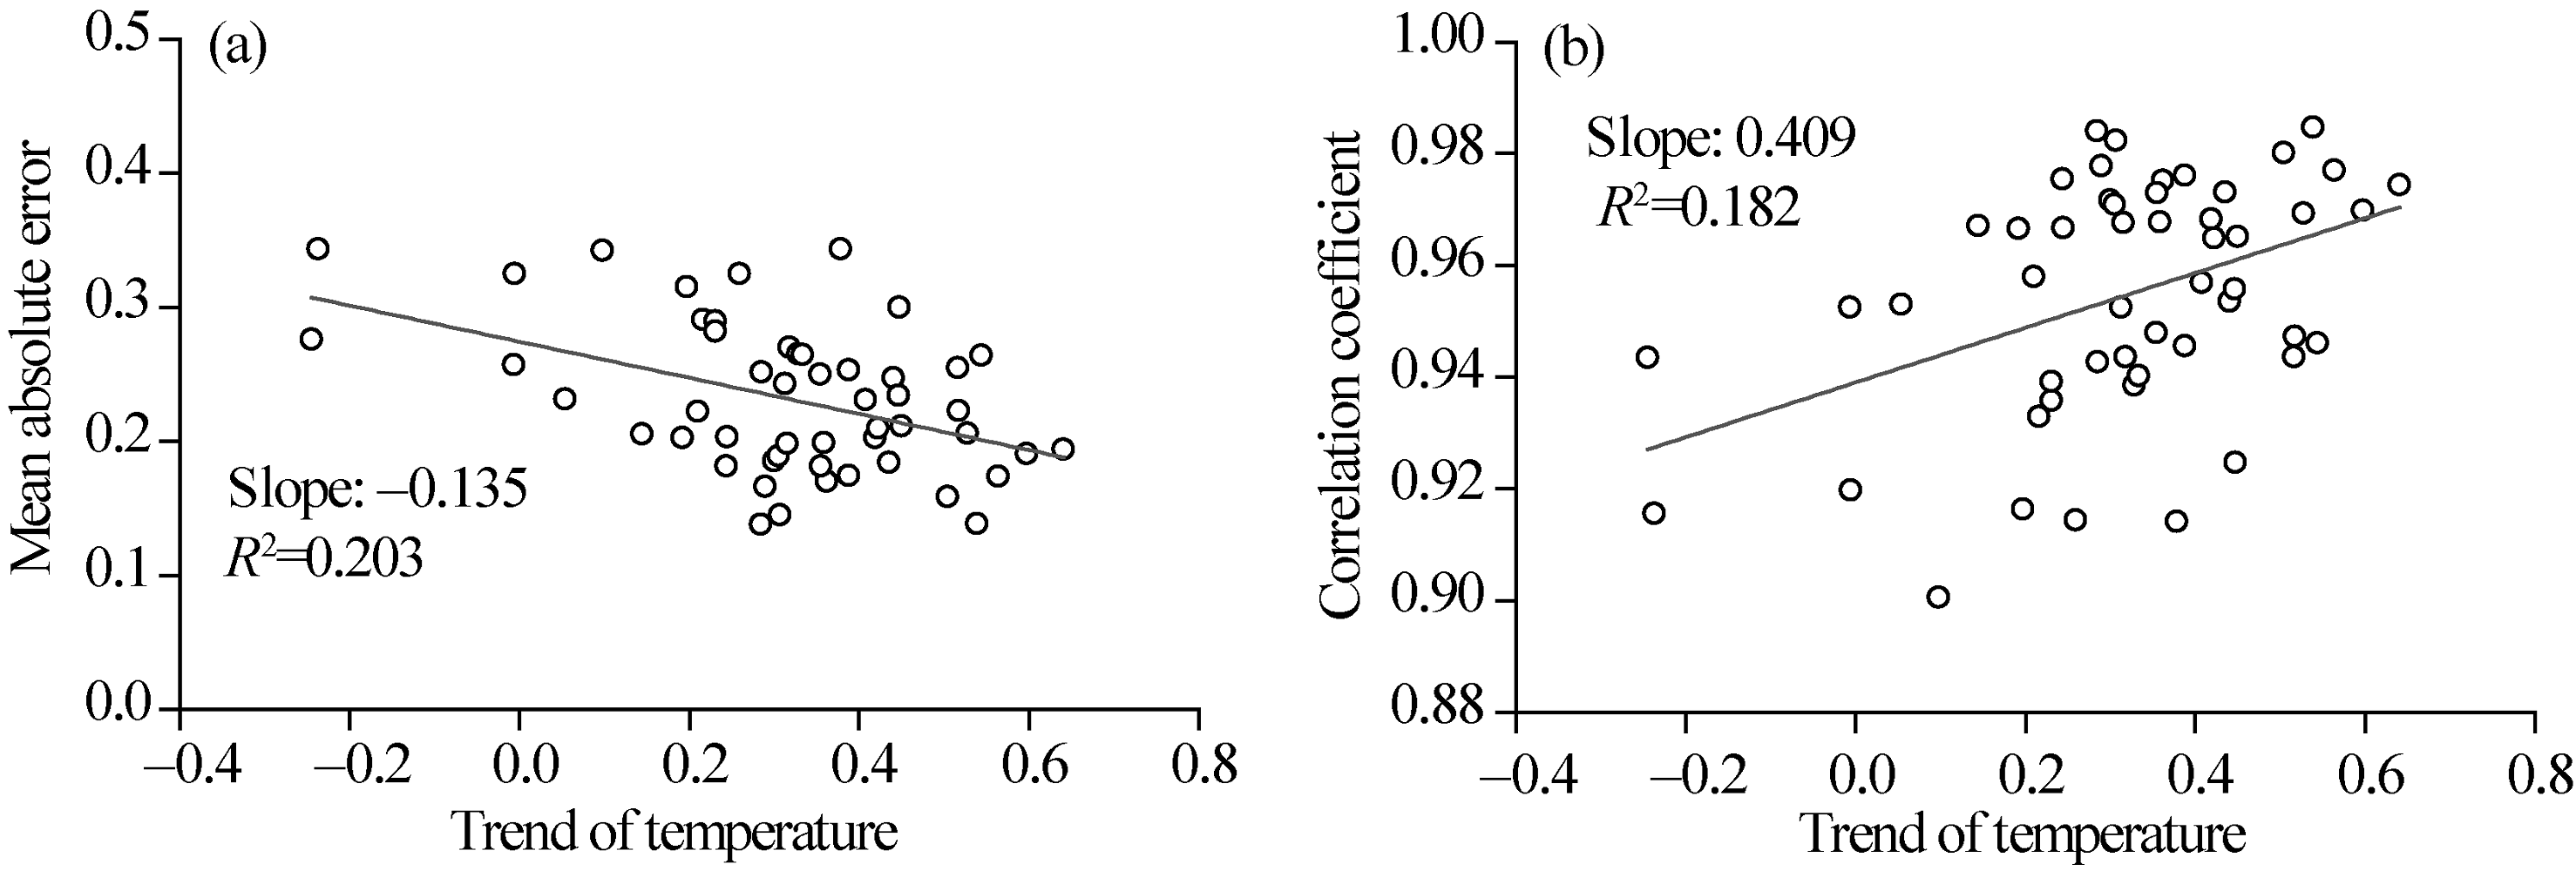
Fig. 4
Relationship between trend of temperature and mean absolute error (a) and correlation coefficient (b) of SPEI and SPI
At the regional scale, large differences were detected between the results from PDSI and those from multi-scale SPI and SPEI. In terms of winter wheat, small differences were identified from January to May at 9- to 12-month lags, as well as from October to December at 4- to 6-month lags. In addition, the correlation coefficients from SPEI and SPI were lower than that from PDSI from October to December at the middle and long-term scales. For summer maize, the correlation between the detrended summer maize yield and detrended PDSI was highly consistent with the results from SPI and SPEI in July at the 2-month lag and in August at the 3-month lag, respectively. Moreover, the correlation coefficients of SPI and SPEI derived from the 1-month lag in June, 4-month lag in September, and 5-month lag in October were all higher than that for PDSI (Fig. 5).

Fig. 5
Correlation coefficients between detrended drought indices and detrended crop yields during winter wheat growing season (a) and summer maize growing season (b) in the North China Plain (NCP)
Station scale analysis of the correlation between the detrended crop yield and detrended drought indices was also performed for the 12 agricultural meteorological stations with minimum data records of 10 years. It is worth noting that the boxplots of the SPI and SPEI were retrieved by the maximum correlation coefficient from 1- to 24-month lags. In contrast to the results from the regional scale, we found that the yield-drought correlations tended to be higher for the SPI and SPEI than for the PDSI at the station scale, whereas small differences between the SPI and SPEI in their performance on agricultural drought were detected. In addition, large differences in the influence of drought conditions on winter wheat and summer maize yields were evident among different months. During the winter wheat growing season, the correlation coefficients (CCs) obtained from the SPI and SPEI were mainly around 0.6 from October to April and around 0.5 in May before sharply decreasing to around 0.3 in June. This result occurred because winter wheat almost completed its growth cycle in June and did not have a great demand for moisture. The same pattern was detected by the CCs obtained from the PDSI and winter wheat yield such that the CCs from January to May were higher than those in other months, with the highest in April. This result is consistent with the key growth stages for winter wheat according to the phenological calendar (Fig. 6). In terms of summer maize growing season, the CCs between summer maize yield and the SPI and SPEI decreased continuously from June to October, whereas the greatest CCs between summer maize yield and the PDSI were observed in July (Fig. 7).

Fig. 6
Correlation coefficients between detrended drought indices and detrended winter wheat yield during winter wheat growing season (October of the former year to June of the current year). The upper and lower boundaries of the box denote the upper and lower quartiles, respectively. The line in the box denotes the median, the lines outside the box denote the upper and lower limits, and + denotes the outlier of the dataset.

Fig. 7
Correlation coefficients between detrended drought indices and detrended summer maize yield during summer maize growing season (June to October of the current year). The upper and lower boundaries of the box denote the upper and lower quartiles, respectively. The line in the box denotes the median, the lines outside the box denote the upper and lower limits, and + denotes the outlier of the dataset.
It should be noted that although significant influences of the demand of atmospheric evaporation have been widely reported (Vicente-Serrano et al., 2012), the results of the current study highlighted the differences in analyzed system and spatial location. Additionally, the magnitudes of the correlations among crop yield and drought indices clearly showed that the SPI and SPEI are most capable of monitoring the agricultural drought conditions in the NCP. However, our findings do not imply that the PDSI is not useful for some purposes; this index is still used worldwide to assess drought conditions in agricultural and hydrological applications.
In this study, we performed statistical assessments to compare the strengths of different drought indices including SPEI, SPI, and PDSI for agricultural drought in the North China Plain. Our results indicated that small differences were detected in the comparative performances of the SPI and SPEI that were smaller at the long-term scale than those at the short-term scale. The correlation between the SPI and PDSI increased considerably from 1- to 12-month lags, and a slight decreasing trend was exhibited during 12- and 24-month lags, indicating a 12-month scale in the PDSI, whereas the SPI was strongly correlated with the SPEI at 1- to 24-month lags. Our results also suggested stronger relationships between the SPI and SPEI in areas of rapid climate warming. More importantly, the yield-drought correlations tended to be higher for the SPI and SPEI than that for the PDSI at the station scale, whereas small differences were detected between the SPI and SPEI in the performance on agricultural systems. However, large differences in the influence of drought conditions on the yields of winter wheat and summer maize were evident among the various indices during the crop-growing season. Our findings suggested that multi- indices in drought monitoring are needed in order to acquire robust conclusions.
This work was supported by the Fundamental Research Funds for the Central Universities (GK201703049) and the Major Project of High Resolution Earth Observation System, China.
The authors have declared that no competing interests exist.
| [1] |
DOI:10.1002/2014RG000456
URL
[CJCR: 1]
Abstract This review surveys current and emerging drought monitoring approaches using satellite remote sensing observations from climatological and ecosystem perspectives. We argue that satellite observations not currently used for operational drought monitoring, such as near-surface air relative humidity data from the Atmospheric Infrared Sounder mission, provide opportunities to improve early drought warning. Current and future satellite missions offer opportunities to develop composite and multi-indicator drought models. While there are immense opportunities, there are major challenges including data continuity, unquantified uncertainty, sensor changes, and community acceptability. One of the major limitations of many of the currently available satellite observations is their short length of record. A number of relevant satellite missions and sensors (e.g., the Gravity Recovery and Climate Experiment) provide only a decade of data, which may not be sufficient to study droughts from a climate perspective. However, they still provide valuable information about relevant hydrologic and ecological processes linked to this natural hazard. Therefore, there is a need for models and algorithms that combine multiple data sets and/or assimilate satellite observations into model simulations to generate long-term climate data records. Finally, the study identifies a major gap in indicators for describing drought impacts on the carbon and nitrogen cycle, which are fundamental to assessing drought impacts on ecosystems.
|
| [2] |
|
| [3] |
DOI:10.1002/wcc.81
URL
[CJCR: 1]
This article reviews recent literature on drought of the last millennium, followed by an update on global aridity changes from 1950 to 2008. Projected future aridity is presented based on recent studies and our analysis of model simulations. Dry periods lasting for years to decades have occurred many times during the last millennium over, for example, North America, West Africa, and East Asia. These droughts were likely triggered by anomalous tropical sea surface temperatures (SSTs), with La Ni01±a-like SST anomalies leading to drought in North America, and El-Ni01±o-like SSTs causing drought in East China. Over Africa, the southward shift of the warmest SSTs in the Atlantic and warming in the Indian Ocean are responsible for the recent Sahel droughts. Local feedbacks may enhance and prolong drought. Global aridity has increased substantially since the 1970s due to recent drying over Africa, southern Europe, East and South Asia, and eastern Australia. Although El Ni01±o-Southern Oscillation (ENSO), tropical Atlantic SSTs, and Asian monsoons have played a large role in the recent drying, recent warming has increased atmospheric moisture demand and likely altered atmospheric circulation patterns, both contributing to the drying. Climate models project increased aridity in the 21st century over most of Africa, southern Europe and the Middle East, most of the Americas, Australia, and Southeast Asia. Regions like the United States have avoided prolonged droughts during the last 50 years due to natural climate variations, but might see persistent droughts in the next 2009000950 years. Future efforts to predict drought will depend on models' ability to predict tropical SSTs. WIREs Clim Change 2011 2 4509000965 DOI: 10.1002/wcc.81For further resources related to this article, please visit the WIREs website
|
| [4] |
DOI:10.1038/NCLIMATE1633
URL
[CJCR: 1]
Historical records of precipitation, streamflow and drought indices all show increased aridity since 1950 over many land areas(1,2). Analyses of model-simulated soil moisture(3,4), drought indices(1,5,6) and precipitation-minus-evaporation(7) suggest increased risk of drought in the twenty-first century. There are, however, large differences in the observed and model-simulated drying patterns(1,2,6). Reconciling these differences is necessary before the model predictions can be trusted. Previous studies(8-12) show that changes in sea surface temperatures have large influences on land precipitation and the inability of the coupled models to reproduce many observed regional precipitation changes is linked to the lack of the observed, largely natural change patterns in sea surface temperatures in coupled model simulations(13). Here I show that the models reproduce not only the influence of El Nino-Southern Oscillation on drought over land, but also the observed global mean aridity trend from 1923 to 2010. Regional differences in observed and model-simulated aridity changes result mainly from natural variations in tropical sea surface temperatures that are often not captured by the coupled models. The unforced natural variations vary among model runs owing to different initial conditions and thus are irreproducible. I conclude that the observed global aridity changes up to 2010 are consistent with model predictions, which suggest severe and widespread droughts in the next 30-90 years over many land areas resulting from either decreased precipitation and/or increased evaporation.
|
| [5] |
DOI:10.1016/j.agrformet.2011.11.002
URL
[CJCR: 1]
We used Swedish county-scale forest fire statistics to quantify modern fire activity, identify its main temporal and geographical patterns, and evaluate statistical performance of six fire-related weather indices as proxy of fire activity in Sweden over 1942–1975 and 1996–2008, the periods with available county-scale fire statistics. The analyzed indices were monthly precipitation, SPI, MDC, PDSI, calibrated PDSI, and DI, a Drought Index calculated as a ratio between actual and equilibrium evapotranspiration. The modern fire cycle (FC) in the northern part of Sweden varies between 2 × 10 3 and 3 × 10 4 years, whereas in southern Sweden the FC is somewhat shorter (10 3–2 × 10 4 years). No temporal trend in average FC was evident at the country scale between the two periods. Significant and negative values of a Mantel test, obtained on county data for both periods ( r = 610.494, p = 0.001 for 1942–1975 and r = 610.281 and p = 0.015 for 1996–2008) indicated the presence of a geographical pattern in annual forest fire activity. Over 1942–1975, PCA revealed that the central and northern counties formed one group with synchronized fire activity, and the southern and south–western counties formed another group. This pattern became less evident during the more recent period (1996–2008). Over 1996–2008, the analysis showed little synchronicity in annual fire activity across different parts of the country. The geographical position of a county had a clear effect on seasonal pattern of forest fires. In southern Sweden, the peak in the number of fires and the burnt area was in April–May, during a relatively short dry period immediately following the snowmelt. In northern Sweden, fires in the second half of fire season dominated the total annual area burnt. Analyzed indices differed considerably in their predictive power in respect to counties’ records of annual area burnt. Calibrated PDSI was a superior proxy of fire activity for the southern region ( R 2 = 60.8% in regression against total annual area burnt for respective provinces), and DI late (Drought Index for the first half of the growing season) was superior for the northern counties ( R 2 = 73.3%). Predictive power of the indices was much higher for the recent period (1996–2002), with R 2 values staying within 81.2 and 97.8%. Even if modern levels of forest fire activity in Sweden are very low from historical perspective, there is a strong spatiotemporal association between fire activity and climatic variability at regional scales, which provides a basis for modeling of the future fire hazard.
|
| [6] |
DOI:10.1016/j.jag.2012.09.010
URL
[CJCR: 1]
Drought is a complex hazard caused by the breaking of water balance and it has always an impact on agricultural, ecological and socio-economic spheres. Although the drought indices deriving from remote sensing data have been used to monitor meteorological or agricultural drought, there are no indices that can suitably reflect the comprehensive information of drought from meteorological to agricultural aspects. In this paper, the synthesized drought index (SDI) is defined as a principal component of vegetation condition index (VCI), temperature condition index (TCI) and precipitation condition index (PCI). SDI integrates multi-source remote sensing data from moderate resolution imaging spectroradiometer (MODIS) and tropical rainfall measuring mission (TRMM) and it synthesizes precipitation deficits, soil thermal stress and vegetation growth status in drought process. Therefore, this method is favorable to monitor the comprehensive drought. In our research, a heavy drought process was accurately explored using SDI in Shandong province, China from 2010 to 2011. Finally, a validation was implemented and its results show that SDI is not only strongly correlated with 3-month scales standardized precipitation index (SPI3), but also with variation of crop yield and drought-affected crop areas. It was proved that this index is a comprehensive drought monitoring indicator and it can contain not only the meteorological drought information but also it can reflect the drought influence on agriculture.
|
| [7] |
DOI:10.1016/j.jag.2014.09.011
URL
[CJCR: 1]
Drought is one of the most frequent climate-related disasters occurring in Southwest China, where the occurrence of drought is complex because of the varied landforms, climates and vegetation types. To monitor the comprehensive information of drought from meteorological to vegetation aspects, this paper intended to propose the optimized meteorological drought index (OMDI) and the optimized vegetation drought index (OVDI) from multi-source satellite data to monitor drought in three bio-climate regions of Southwest China. The OMDI and OVDI were integrated with parameters such as precipitation, temperature, soil moisture and vegetation information, which were derived from Tropical Rainfall Measuring Mission (TRMM), Moderate Resolution Imaging Spectroradiometer Land Surface Temperature (MODIS LST), AMSR-E Soil Moisture (AMSR-E SM), the soil moisture product of China Land Soil Moisture Assimilation System (CLSMAS), and MODIS Normalized Difference Vegetation Index (MODIS NDVI), respectively. Different sources of satellite data for one parameter were compared with in situ drought indices in order to select the best data source to derive the OMDI and OVDI. The Constrained Optimization method was adopted to determine the optimal weights of each satellite-based index generating combined drought indices. The result showed that the highest positive correlation and lowest root mean square error (RMSE) between the OMDI and 1-month standardized precipitation evapotranspiration index (SPEI-1) was found in three regions of Southwest China, suggesting that the OMDI was a good index in monitoring meteorological drought; in contrast, the OVDI was best correlated to 3-month SPEI (SPEI-3), and had similar trend with soil relative water content (RWC) in temporal scale, suggesting it a potential indicator of agricultural drought. The spatial patterns of OMDI and OVDI along with the comparisons of SPEI-1 and SPEI-3 for different months in one year or one month in different years showed significantly varied drought locations and areas, demonstrating regional and seasonal fluctuations, and suggesting that drought in Southwest China should be monitored in seasonal and regional level, and more fine distinctions of seasons and regions need to be considered in the future studies of this area.
|
| [8] |
DOI:10.1016/j.jhydrol.2015.05.031
URL
[CJCR: 1]
Drought is a recurring natural phenomenon that has plagued the civilization throughout its history. Due to the complex nature and widespread impacts of drought, there is a lack of universally accepted definition of drought, which also affects the development of drought indices to characterize drought conditions. Because an individual drought indicator is generally not sufficient for characterizing complex drought conditions and impacts, multiple drought-related variables and indices are required to capture different aspects of complicated drought conditions. To address this issue, a variety of multivariate drought indices have been developed recently to combine multiple drought-related variables and indices for integrated drought characterizations. This paper presents a comprehensive review of major multivariate drought indices developed recently. Different development methods of multivariate drought indices are introduced along with their strengths and limitations. This paper provides useful information for operational drought characterization with current multivariate drought indices and for the development of new multivariate drought indices.
|
| [9] |
DOI:10.1175/1520-0477-83.8.1149
URL
[CJCR: 1]
The monitoring and analysis of drought have long suffered from the lack of an adequate definition of the phenomenon. As a result, drought indices have slowly evolved during the last two centuries from simplistic approaches based on some measure of rainfall deficiency, to more complex problem-specific models. Indices developed in the late nineteenth and early twentieth century included such measures as percent of normal precipitation over some interval, consecutive days with rain below a given threshold, formulae involving a combination of temperature and precipitation, and models factoring in precipitation deficits over consecutive days. The incorporation of evapotranspiration as a measure of water demand by Thornthwaite led to the landmark development in 1965 by Palmer of a water budget-based drought index that is still widely used. Drought indices developed since the 1960s include the Surface Water Supply Index, which supplements the Palmer Index by integrating snowpack, reservoir storage, streamflow, and precipitation at high elevations; the Keetch-Byram Drought Index, which is used by fire control managers; the Standardized Precipitation Index; and the Vegetation Condition Index, which utilizes global satellite observations of vegetation condition. These models continue to evolve as new data sources become available. The twentieth century concluded with the development of the Drought Monitor tool, which incorporates Palmer's index and several other (post Palmer) indices to provide a universal assessment of drought conditions across the entire United States. By putting the development of these drought indices into a historical perspective, this paper provides a better understanding of the complex Palmer Index and of the nature of measuring drought in general.
|
| [10] |
DOI:10.1007/s00267-010-9543-x
PMID:20812011
URL
[CJCR: 1]
Sustainable water use is seriously compromised in the North China Plain (NCP) due to the huge water requirements of agriculture, the largest use of water resources. An integrated approach which combines the ecosystem model with emergy analysis is presented to determine the optimum quantity of irrigation for sustainable development in irrigated cropping systems. Since the traditional emergy method pays little attention to the dynamic interaction among components of the ecological system and dynamic emergy accounting is in its infancy, it is hard to evaluate the cropping system in hypothetical situations or in response to specific changes. In order to solve this problem, an ecosystem model (Vegetation Interface Processes (VIP) model) is introduced for emergy analysis to describe the production processes. Some raw data, collected by investigating or observing in conventional emergy analysis, may be calculated by the VIP model in the new approach. To demonstrate the advantage of this new approach, we use it to assess the wheat-maize rotation cropping system at different irrigation levels and derive the optimum quantity of irrigation according to the index of ecosystem sustainable development in NCP. The results show, the optimum quantity of irrigation in this region should be 240–33002mm per year in the wheat system and no irrigation in the maize system, because with this quantity of irrigation the rotation crop system reveals: best efficiency in energy transformation (transformity02=026.05E02+02402sej/J); highest sustainability (renewability02=0225%); lowest environmental impact (environmental loading ratio02=023.5) and the greatest sustainability index (Emergy Sustainability Index02=020.47) compared with the system in other irrigation amounts. This study demonstrates that application of the new approach is broader than the conventional emergy analysis and the new approach is helpful in optimizing resources allocation, resource-savings and maintaining agricultural sustainability.
|
| [11] |
|
| [12] |
DOI:10.1007/s11069-014-1468-x
URL
[CJCR: 3]
Drought severity was simulated with four drought indices to examine the impacts of climate change on drought conditions in Shaanxi province over the period 1951 to 2012. The drought metrics analyzed were based on the original Palmer drought severity index (orPDSI), self-calibrated PDSI (scPDSI), the standardized precipitation index (SPI) and the standardized precipitation evapotranspiration index (SPEI). Both Thornthwaite (Thor) and Penman–Monteith (PM) parameterizations were used to calculate potential evapotranspiration (PET), and the differences between two PET estimators were studied. Nonparametric Mann–Kendall monotonic test was used to examine the trends of hydroclimatic data. Series of drought indices were compared at five meteorological stations with different climate characteristics, located in the north, central and south parts of Shaanxi province, respectively. Effects of climate change in drought conditions were investigated with hypothetical progressive precipitation decrease (611502%) and temperature increase (202°C). The results showed that there was discrepancy between PET estimated using the Thor and PM parameterization estimators, while the SPEI calculated with the two PET estimators are found to be similar. The SPEI has the combined advantages over the scPDSI and the SPI, considering the effect of temperature variability on drought severity and its multi-scalar characteristic, while scPDSI has an inherent approximately 12-month time scale. The Pearson’s correlation is used to compare the three pairs of drought indices combinations at different time scales. Under climate change conditions, the drought severity increases with the decline of precipitation and higher water demand as a result of the temperature increase based on the metrics of the scPDSI, the SPI and the SPEI.
|
| [13] |
DOI:10.1016/j.jaridenv.2007.07.009
URL
[CJCR: 1]
Annual growth of semiarid tree species is generally limited by a period of water deficit and this relationship can be reflected in interannual variation in tree-ring width of semiarid species such as Pinus edulis, a pi on pine that is widely distributed across the southwestern United States. Tree-ring width of P. edulis and other semiarid tree species is most frequently related to annual precipitation amount alone or to the Palmer drought severity index (PDSI). But water deficit and associated variation in moisture can also be described using numerous other indices such as the standardized precipitation index (SPI), and a comparison of the performance of several indices that relate historical climate data to tree-ring variation in P. edulis is lacking. We compared abilities to predict radial tree-ring growth of P. edulis using five metrics of water availability: PDSI, two indices based on precipitation alone (total precipitation and SPI), and two indices that factor in temperature to determine water deficit (based on Walter climate diagrams that use monthly precipitation and temperature). Each metric was evaluated over three commonly used time periods (water year, calendar year, and June ugust) using the limited available data from P. edulis sites in the southwestern USA where co-located tree-ring and weather data were available. Our results indicate that PDSI was the best predictor of P. edulis ring widths, regardless of time period, and provide a first comparative test of PDSI with SPI and Walter indices that can be further tested as larger data sets become available.
|
| [14] |
DOI:10.1002/joc.1444
URL
[CJCR: 1]
The main objectives of this study were (1) to evaluate the SPI, and three variations of the Palmer Drought Severity Index (PDSI) (the original PDSI (Orig-PDSI), a self-calibrated version (SC-PDSI) and a modified scheme employing Priestlay-Taylor's approach to compute potential evapotranspiration (PET) instead of Thornthwaite's method) and their respective moisture anomaly indices for assessing rainfed common wheat and durum wheat yield in two pilot crop regions in north and central Greece, and (2) to assess the vulnerability of wheat production to climate change, using the most appropriate drought index, with future scenarios provided by the Hadley Centre regional climate model HadRM3. The yield models that performed best at high-drought risk years (the Orig-PDSI index in the northern region and the SC-PDSI in the southern region, explaining 82.5 to 84.7% and 92% of the measured yield variability, respectively) were also the most effective at predicting the observed wheat yields when soil moisture was not an important yield-limiting factor. However, the strength of the relationship between the drought indices and the crop yields was much weaker. Improving the representation of PET in the PDSI algorithm did not improve the model's performance. The sensitivity of the two types of wheat to HadRM3 projections for the high-drought risk years differed dramatically between the two pilot districts, with extremely decreased yields of 3.14 tn ha-1 expected in the southern district and much smaller changes expected in the northern district (-4.6 vs + 6.7% for durum wheat and common wheat, respectively). For the low-drought risk years, the yield models in the northern region predicted lower yields by 30 to 60 kg ha-1. A positive yield response by 30 kg ha-1 was found for the southern district. Copyright 2006 Royal Meteorological Society
|
| [15] |
DOI:10.1002/joc.1976
URL
This paper presents a framework for making use of drought indices in climate change impact assessment studies. To achieve this goal: (1) linear relationships between drought indices and satellite soil moisture information, derived from the ERS scatterometer [Soil Water Index, (SWI)] for the years 1992 2000, are developed by employing [analysis of covariance (ANCOVA)] and (2) the vulnerability of soil water content to climate change is assessed using regional climate model (RCM) projections. Several drought indices are evaluated for their abilities to monitor SWI, on a monthly basis, at nine locations in Greece. The original Palmer Drought Severity Index (Orig-PDSI) and its self-calibrated version (SC-PDSI) correlated best with SWI in three stations each and precipitation in two. The degree of agreement, however, varies substantially among the sites. Seasonality has a significant effect on the relationship between the SWI and the two aforementioned drought indices (Orig-PDSI, SC-PDSI), presenting a bimodal pattern that fluctuates markedly during the year. ANCOVA has proved to be a useful method for measuring the agreement between SWI and the drought indices (r2 ranged from 46.2% to 79.9%), implying that drought indices can be an important information source for detecting and monitoring drought. 11 different RCM runs are compared for their abilities to reproduce present climate mean and variability of temperature and precipitation. Orig-PDSI is not sensitive to the much warmer future climate change scenarios constructed and, therefore, is not suggested for climate change impacts assessment studies. SC-PDSI, on the other hand, has the potential to be used; however, its responses depend on the time period on which the climate characteristics and duration factors are computed from. Copyright 2009 Royal Meteorological Society
|
| [16] |
URL
[CJCR: 1]
[Excerpt: Introduction] The definition of drought has continually been a stumbling block for drought monitoring and analysis. Wilhite and Glantz (1985) completed a thorough review of dozens of drought definitions and identified six overall categories: meteorological, climatological, atmospheric, agricultural, hydrologic and water management. Dracup et al. (1980) also reviewed definitions. All points of view seem to agree that drought is a condition of insufficient moisture caused by a deficit in precipitation over some time period. Difficulties are primarily related to the time period over...
|
| [17] |
DOI:10.1016/j.jhydrol.2010.07.012
URL
[CJCR: 1]
Owing to the rise in water demand and looming climate change, recent years have witnessed much focus on global drought scenarios. As a natural hazard, drought is best characterized by multiple climatological and hydrological parameters. An understanding of the relationships between these two sets of parameters is necessary to develop measures for mitigating the impacts of droughts. Beginning with a discussion of drought definitions, this paper attempts to provide a review of fundamental concepts of drought, classification of droughts, drought indices, historical droughts using paleoclimatic studies, and the relation between droughts and large scale climate indices. Conclusions are drawn where gaps exist and more research needs to be focussed.
|
| [18] |
DOI:10.1175/BAMS-D-11-00213.1
URL
[CJCR: 1]
Water is essential for life. With increasing human development and climate change, water has become a pivotal resource for sustainable development, both societally and environmentally. Agriculture, on which a burgeoning population depends for food, is competing with industrial, household, and environmental uses for increasingly scarce freshwater supplies in many areas (V02r02smarty et al. 2010; Rosegrant et al. 2003). Drought is an important adverse climatic event for both ecosystems and human society. Global mean surface air temperature has increased by about 0.76°C since 1850 (Trenberth et al. 2007) and is expected to increase by 1.5°–6.4°C by the end of the twentyfirst century (Meehl et al. 2007). Under a warming climate, persistent drought may increase (Dai et al. 2004; Pachauri and Reisinger 2007; Dai 2011b), while human populations and associated demands for freshwater resources are rising, increasing food production constraints and putting global food security at risk. Accurate and consistent global mapping and monitoring of drought severity is essential for water management and drought mitigation efforts.
|
| [19] |
DOI:10.1016/j.scitotenv.2014.09.099
PMID:25461052
URL
[CJCR: 1]
61Phase relationships between rainfall and vegetation moisture conditions are observed61Significant difference in response was observed between vegetation cover types61An integrated approach for drought assessment is proposed
|
| [20] |
|
| [21] |
DOI:10.1007/s00704-011-0403-2
URL
Droughts in Moldova were evaluated using meteorological data since 1955 and a long time series (1891–2009). In addition, yields for corn ( Zea mays L.), a crop widely grown in Moldova, were used to demonstrate drought impact. The main aim is to propose use of the S i ( S i -a and S i -m) drought index while discussing its potential use in studying the evolution of drought severity in Moldova. Also, a new multi-scalar drought index, the standardized precipitation–evapotranspiration index (SPEI), is tested for the first time in identifying drought variability in Moldova while comparing it with the commonly used standardized precipitation index (SPI). S i -m, SPI, SPEI, and S i -a indices show an increasing tendency toward more intensive and prolonged severely dry and extremely dry summer months. Drought frequency increased through six decades, which included long dry periods in the 1990s and 2000s. Moreover, the evolution of summer evapotranspiration recorded a positive and significant trend (+3.302mm/year, R 2 65=650.46; p 65≤650.05) between 1955 and 2009. A yield model based on the S i -a agricultural index and historic corn yields explained 43% of observed variability in corn production when drought occurred in May, July, and August. Increasing severity of the 20-year drought during the critical part of the growing season is raising corn yield losses, as net losses have so far exceeded net gains.
|
| [22] |
DOI:10.1016/j.agrformet.2014.11.022
URL
[CJCR: 1]
In this study we investigated the influence of drought on crop productivity and, in particular, the drought time-scales that affect the growth of eleven agricultural crops with growth cycles of different lengths in the Czech Republic. In addition, the performance of the standardised precipitation evapotranspiration index (SPEI) at various lags for the assessment of agricultural drought risks was determined. The SPEI was used to quantify the drought (wet) conditions for each month of the year and 24 accumulated lags for 304 climatological stations from 1961 to 2012. The temporal evolution of the standardised yield residuals series (SYRS) of 11 agricultural crops (spring wheat, winter wheat, spring barley, winter barley, winter rye, oats, oilseed rape, maize, sugar beet, potatoes, and grapevine) over a period of 52 years were conducted. To summarise the correlation analyses and compare the drought effect among crops, we found differences in the responses of agricultural crops to different lags of the SPEI. However, the monthly de-trended SPEI had a relatively strong association with SYRS at critical growth stages of the crops. The greatest yield-drought correlation was for cereals (r=0.52–0.60; May–June), and the least yield-drought correlation was for grapes (r=0.31; early flowering and berry growth). If one compares the frequency of drought between 1961–1980 and 2001–2012, it is evident that over the past 12 years, the drought risk in the April–June period has increased by more than one fold. Drought during the April–June period became a factor explaining a considerable proportion of the yield variability. We found that drought risk expressed in terms of the SPEI at 1-, 3-, and 6-month lags is an increasing problem during the early stages of root and tuber crops.
|
| [23] |
DOI:10.1016/j.agrformet.2009.11.015
URL
[CJCR: 1]
The relationship between the satellite-based Vegetation Condition Index (VCI) and a number of frequently used meteorological drought indices was evaluated using data from all 254 Texas counties during 18 growing-seasons (March to August, 1982 1999). In particular, the response of the VCI was compared to that of the Palmer Drought Severity Index (PDSI), Moisture Anomaly Index (Z-index), Standard Precipitation Index (SPI), percent normal, and deciles. Overall the VCI is most strongly correlated with the 6-month SPI, 9-month SPI and PDSI. This indicates that, at least over Texas, the growing-season VCI responds to prolonged moisture stress and it appears to be less sensitive to short-term precipitation deficiencies. There was also significant spatial variability in the strength of the relationship between the VCI and the meteorological drought indices. Generally, counties in northwestern and southwestern Texas had much higher correlations ( R 2 > 0.6) than counties in eastern Texas and along the Gulf Coast ( R 2 < 0.1). Nearly 75% of these spatial variations can be explained using a series of environmental variables. It appears that the climate region is the most important determinant of the nature of the relationship between the VCI and PDSI. Other important variables include the land use/land cover in each county, the amount of irrigation, and soil properties. These results demonstrate that care must be taken when using the VCI for monitoring drought because it is not highly correlated with station-based meteorological drought indices and it is strongly influenced by spatially varying environmental factors.
|
| [24] |
|
| [25] |
DOI:10.1175/2012EI000434.1
URL
[CJCR: 4]
In this study, the authors provide a global assessment of the performance of different drought indices for monitoring drought impacts on several hydrological, agricultural, and ecological response variables. For this purpose, they compare the performance of several drought indices [the standardized precipitation index (SPI); four versions of the Palmer drought severity index (PDSI); and the standardized precipitation evapotranspiration index (SPEI)] to predict changes in streamflow, soil moisture, forest growth, and crop yield. The authors found a superior capability of the SPEI and the SPI drought indices, which are calculated on different time scales than the Palmer indices to capture the drought impacts on the aforementioned hydrological, agricultural, and ecological variables. They detected small differences in the comparative performance of the SPI and the SPEI indices, but the SPEI was the drought index that best captured the responses of the assessed variables to drought in summer, the season in which more drought-related impacts are recorded and in which drought monitoring is critical. Hence, the SPEI shows improved capability to identify drought impacts as compared with the SPI. In conclusion, it seems reasonable to recommend the use of the SPEI if the responses of the variables of interest to drought are not known a priori.
|
| [26] |
DOI:10.2747/1539-7216.52.1.140
URL
[CJCR: 1]
An American specialist on Russia's agricultural sector examines the progression and impact of that country's 2010 drought (the worst in a half-century), leading to a grain harvest one-third smaller than originally forecast. A particular focus is on the country's grain reserves and the government's response to drought in such areas as grain export policy and maintaining the size of the domestic livestock herd, responses which the author argues are conditioned by the drive for food security, a concept that has dominated the political discourse in tandem with resurgent economic nationalism during the post-Soviet period.
|
| [27] |
|
| [28] |
DOI:10.1080/02508068508686328
URL
The occurrence of widespread, severe drought in Africa, India, North America, China, the USSR, Australia, and western Europe has once again underscored the vulnerability of developed and developing societies to drought The occurrence of severe drought during 1982-83 is shown in Fig. 1. These recent droughts have emphasized the need for more research on the causes as well as the impacts of drought and the need for additional planning to help mitigate the possible worst effects of future droughts. Drought has been the subject of a great deal of systematic study, particularly reconstructions of drought history, computations of drought frequency, and, to a lesser extent, investigations of first-, second-, and even third-order impacts of drought on society.
|
| [29] |
|
| [30] |
DOI:10.1175/2009JCLI2968.1
URL
Time series of the average annual Palmer drought severity index (PDSI) and standardized precipitation index (SPI) were calculated for 483 meteorological stations in China using monthly data from 1961 to 2005. The time series were analyzed for 10 large regions covering the territory of China and represented by seven river basins and three areas in the southeast, southwest, and northwest. Results show that the frequencies of both dry and wet years for the whole period are lower for southern basins than for the northern ones when estimated by PDSI but very similar for all basins when calculated by SPI. The frequencies of dry and wet years calculated for 5- and 15-yr subperiods by both indices show the upward dry trends for three northeastern basins, Songhuajiang, Liaohe, and Haihe; a downward dry trend for the northwest region; a downward wet trend for the Yellow River basin; and an upward wet trend for the northwest region. Trend detection using PDSI indicates statistically significant negative trends for many stations in the northeastern basins (Songhuajiang, Liaohe, Haihe, and Yellow) and in the middle part of the Yangtze, whereas statistically significant positive trends were found in the mountainous part of the northwest region and for some stations in the upper and lower Yangtze. A moderately high and statistically significant correlation between the percentage of runoff anomaly (PRA) and the annual average PDSI and SPI was found for six large rivers. The results confirm that PDSI and SPI indices can be used to describe the tendency of dryness and wetness severity and for comparison in climate impact assessment.
|
