

 ,
, Climate change and human activities can influence vegetation net primary productivity (NPP), a key component of natural ecosystems. The Qinghai-Tibet Plateau of China, in spite of its significant natural and cultural values, is one of the most susceptible regions to climate change and human disturbancesin the world. To assess the impact of climate change and human activities on vegetation dynamics in the grassland ecosystems ofthe northeastern Qinghai-Tibet Plateau, we applied a time-series trend analysis to normalized difference vegetation index (NDVI) datasets from 2000 to 2015 and compared these spatiotemporal variations with trends in climatic variables over the same time period. The constrained ordination approach (redundancy analysis) was used to determine which climatic variables or human-related factors mostly influenced the variation of NDVI. Furthermore, in order to determine whether current conservation measures and programs are effectivein ecological protection and reconstruction, we divided the northeastern Qinghai-Tibet Plateau into two parts: the Three-River Headwater conservation area (TRH zone) in the south and the non-conservation area (NTRH zone) in the north. The results indicatedan overall (73.32%)increasing trend of vegetation NPP in grasslands throughout the study area. During the period 2000-2015, NDVI in the TRH and NTRH zones increased at the rates of 0.0015/aand 0.0020/a, respectively.Specifically, precipitation accounted for 9.2% of the total variation in NDVI, while temperature accounted for 13.4%. In addition, variation in vegetation NPP of grasslands responded not only to long- and short-term changes in climate, as conceptualized in non-equilibrium theory, but also to the impact of human activities and their associated perturbations. The redundancy analysis successfully separated the relative contributions of climate change and human activities, of whichvillage populationand agricultural gross domestic product were the two most important contributors to the NDVI changes, explaining 17.8% and 17.1% of the total variationof NDVI (with the total contribution >30.0%), respectively. The total contributionpercentages of climate change and human activitiesto the NDVI variation were27.5% and 34.9%, respectively, inthe northeastern Qinghai-Tibet Plateau. Finally, our study shows that the grassland restoration in the study area was enhanced by protection measures and programs in the TRH zone, which explained 7.6% of the total variation in NDVI.
Studies have demonstrated that climate change and human activities can affect vegetation characteristics substantially (Parmesan 2006; Krishnaswamy et al., 2014). Assessments at global and regional scales have shown that the range, biomass, phenology and productivity of vegetation have all significantly changed (Nemani et al., 2003; Piao et al., 2005; Cleland et al., 2007). The Qinghai-Tibet Plateau in China, often referred to as the world's "Third Pole", extends for over 2.5×10⁶ km2 and provides a unique environment for awide variety of alpine vegetation types (Cai et al., 2015; Dakhil et al., 2019).
Grasslands are a common type of vegetation worldwide. They totally cover 45.3% of the Qinghai-Tibet Plateau (Ni, 2002). Togetherwith shrublands, they store more than one-third of the total carbon reserves of the globe (Del Grosso et al., 2018).However, grasslands are fragile ecosystems and are very sensitive to environmental perturbations and changes, presumably because of their simple community structure conferring them a low resistance to disturbances(Piao et al., 2011a; Shen et al., 2011). More than 50% of the grasslands in the northeastern Qinghai-Tibet Plateausuffer from environmental degradation to some extent (Nan, 2005), driven by socio-economic developments, human population growth (Kang et al., 2007), and changes in climate and land use (Zhou et al., 2015). Grassland degradation has not only reduced the amount of local carbon sequestration, but also led to serious environmental problems, such as decreased vegetation productivity and soil quality, desertification and dust storms. In the Qinghai-Tibet Plateau, most people rely directly on livestock grazing, so the maintenance of a good quality status of grasslands is an urgent concern for developing the local economy (Zhou et al., 2005; Harris, 2010). Thus, monitoring changes in the extent and condition of grassland ecosystemsand understanding their causes and sensitivity to climate change are of paramount importance (Ciais et al., 2013; Gao et al., 2016).
Vegetation productivity provides a quantitative indicator of carbon sequestration efficiency and underpins the food chains of many living organisms (O'Mara, 2012; Xiong et al., 2016). Net primary productivity (NPP), containing aboveground net primary productivity and belowground net primary productivity, is considered a vital component of the global carbon reserve and is a reliable proxy for analyzing the changes in the functioning of natural ecosystems (Del Grosso et al., 2018). However, the patterns of changes in the grasslandNPP among ecosystems at the global scale and the drivers of these variations are unclear and still debated (Millennium Ecosystem Assessment, 2005; Bai et al., 2008; Xiong et al., 2016). For example, grasslandNPP is positively associated with warming in cold areas yet negatively correlated with warming in hot areas (Ciais et al., 2013; Fu et al., 2015). Generally speaking, NPPof grasslands is very sensitive to changes in the climatic variables, particularly temperature and precipitation, and to other non-climatic factors, such as fires, grazing, rising CO2 levels and nitrogen deposition (Ciais et al., 2013; Zelikova et al., 2014; Xiong et al., 2016).
Various approaches have been used to investigate the influencesof climate change and humanactivitieson vegetation growth. These approaches include the analyses of vegetation index data derived from remote sensing (Myneni et al., 1997; Paudel and Andersen, 2010; Bégué et al., 2011;Piao et al., 2011b; Xiao et al., 2019), vegetation productivity models derived from remote sensingdata (Field et al., 1995; Nemani et al., 2003; Piao et al., 2005), and so on(Zhong et al., 2010; Cong et al., 2013; Che et al., 2014). Several studies have suggestedthat NPP can be used effectively to evaluate the dynamics of grassland ecosystems (Melillo et al., 1993; Defries et al., 1999).However, the existed estimation models, such as the Carnegie-Ames-Stanford Approach (CASA) (Potter et al., 1993; Xiong et al., 2017), are complexity and require many parameters that are sometimes either unavailable or hard to obtain for certain research areas. Therefore, the widespread application of these models is severely limited. The normalized difference vegetation index (NDVI) is by far the most often used spectral index from remotely-sensed data for the description of vegetation biomass(Tucker et al., 2001, 2005). The NDVI is strongly correlated with key vegetation parameters that include leaf area and green leaf biomass (Justice et al., 1985), since it has been used successfully for monitoring vegetation biomass in various ecological regions (Prince and Tucker, 1986; Evans and Geerken, 2004). In sum, NDVI has repeatedly been used as a proxy for NPP because of the strong correlation between them(Paruelo et al., 1997; Jobbágy et al., 2002; Piao et al., 2011b).
Researchers have suggested several methods for determining the underlying drivers (includingclimate, human and natural disturbances)of temporal variations in grassland vegetation dynamics based on NDVI or NPP (Evans and Geerken, 2004; Geerken and Ilaiwi, 2004; Paudel and Andersen, 2010). One approach uses the time series of residuals between the observed and predicted (precipitation-predicted) NDVI as an indicator of the non-precipitation-caused temporal variations in vegetation NPP of grasslands(Geerken and Ilaiwi, 2004). The reduction in NPP due to human activities, equivalent to the difference between the potential NPP simulated by the Thornthwaite model and the actual NPP, reflects the impact of human activities on vegetation NPP (Wessels et al., 2007; Zhou et al., 2015).
Redundancy analysis (RDA) generally performs slightly better (34.7% explained variance) than canonical correspondence analysis (CCA) (28.3%) in assessing the key factors affecting vegetation dynamics (Wildi, 2017). In this study, we used NDVI as an indicator of vegetation NPP, in combination with climaticand socioeconomic parameters, to investigate the relationships among the vegetation dynamics and various controlling factors in the grasslands of northeastern Qinghai-Tibet Plateau. The main objective of our study was to assess the relative contributions of climate change and humanactivities on vegetation changes. We addressed the following three questions:
(1) Does climate change have a greater influence on vegetation NPP of grasslands than human activities in the sparsely populated study area?
(2) Does grazing level have a major influence on grassland vegetation dynamics?
(3) Have current ecological restoration measures and programs in this region had any impacts on variations in vegetationNPP?
The study area is located in the northeastern Qinghai-Tibet Plateau (31°-39°N, 89°-102°E), China. Due to its high elevation, this region has quite cold winters, mild summers and largediurnal temperature variations. Its annual average air temperature is approximately between -5°Cand 8°C.Generally, the minimum and maximum temperatures occur in January (ranging from -18°C to -7°C) and July (ranging from 15°C to 21°C), respectively. Precipitation over the region is highly variable in space and time. It tends to decline from southeast to northwest, with a considerable proportion of the annual precipitation occurring in summer.Spring and winter are the driest seasons at the annual scale. There is a single growing season for vegetation that lasts from April to October, with peak growth occurring in July and August.
In recent years, to remediate grassland degradation in the northeastern Qinghai-Tibet Plateau, the Chinese government has implemented several ecological protection measures and reconstruction programs, which may have greatly affected the ecological structure and functioning of grassland ecosystems in this area. Such measures and programs include the restoration of degraded grassland project, the returning grazing land to grassland project, the ecologicalimmigrationproject, the natural recovery of black soiltype degradedgrassland in the Three River Source Regionand the construction of a rodent control and protection area, amounting to an investment of about 7.5×10⁹CNY. To determine whether these conservation measures and programsare effective on ecological protection and reconstruction, we dividedthe northeastern Qinghai-Tibet Plateau into two parts: (1) the Three-River Headwater conservation area(TRH zone) in the south (Jiang and Zhang, 2016), which refers to the source regions of the Yellow River,Lancang River and Yangtze River; and (2) the non-conservation area (NTRH zone) in the north (Fig. 1).
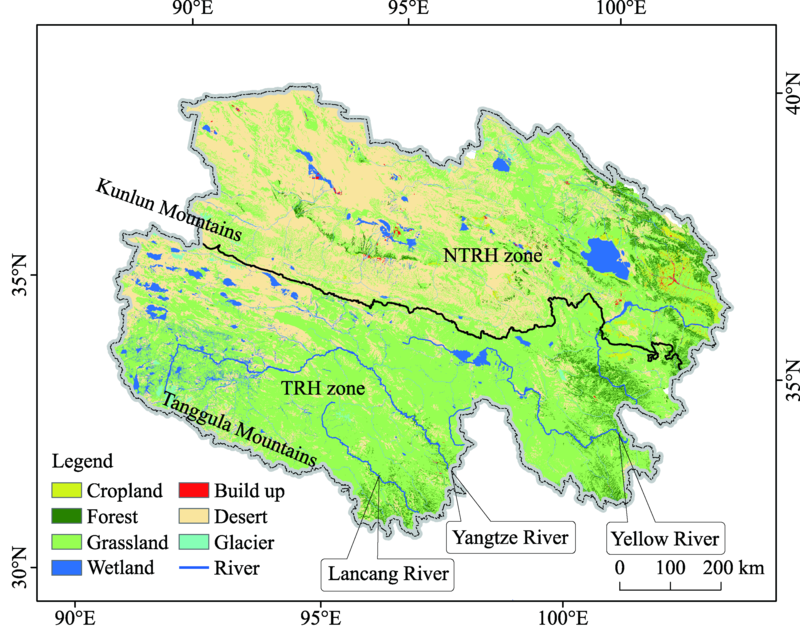
Fig. 1
Zone distribution and land use/land cover map in the northeastern Qinghai-Tibet Plateau. TRH zone, Three-River Headwater conservation area; NTRH zone, non-conservation area. The black line represents the dividing line between TRH zone and NTRH zone. It should be noted that only two important mountains are marked in the figure.
2.2.1 Spectral data
A time-series NDVI dataset for the period 2000-2015 (pixel size of 250 m×250 m) was obtained from the Institute of Remote Sensing and Digital Earth, Chinese Academy of Sciences. We calculatedNDVI values using NDVI reconstruction method based on Savitzky-Golay filtering(Pettorelli et al., 2005). The NDVI is a normalized ratio of red and near infrared reflectance and has been used as a proxy for terrestrial vegetation growth condition. This index is correlated to chlorophyll content, sensitive to structural variations in the plant canopy (Myneni et al., 1995; Myneni et al., 1997; Gao et al., 2000), and closely associated with the fraction of potentialphotosynthesis (Nemani et al., 2003) and the physiological condition of vegetation (Kaufmann et al., 2004). In this study, NDVI layers were multiplied by 0.0001 (a scale factor) so that the pixel values would range from -1 to 1.
2.2.2 Climatic variables
Monthly precipitation and temperature data of 79 weather stations in the study area for the period 2000-2015 were obtained from the Chinese National Metrological Information Center/China Meteorological Administration (http://data.cma.cn). For each weather station, monthly meteorological data were interpolated to a spatial resolution of 1 km×1 km for the whole study area, by using the Kriging interpolation methodwhich was widely used for regionalizing various variables at different scales (Piao et al., 2001; Zhu et al., 2006).
2.2.3 Environmental variables
Since the 1960s, China has experienced rapid social development and economicgrowth, accompanied by a growing population. For example, thepopulation ofQinghai Province has increased threefold since the 1950s (Zhang and Cheng, 2009), thus altering many parts of thisregion.Because the Qinghai-Tibet Plateau contains an extensive area ofgrasslands that covers almost 60% of its total area, livestock husbandry is an importantindustry here. From the 1978, the livestock abundance in this region has almost tripled (Du et al., 2004). Meanwhile, the simultaneous increase in population has accompanied by considerable environmental problems, such as grassland degradation(Lu et al., 2009; Niu et al., 2009). These problems have further magnified the impactof human activities on the plateau's environment.Human-related socioeconomic data, including village population, cattle density, sheep density, gross domestic product (GDP), agriculturalGDP, industrialGDP, service industryGDP and the extent of the conservation area, were from the statistical yearbooks and government sources (Table 1).
Table 1
Sources of data used in this study
Grassland distribution in the northeastern Qinghai-Tibet Plateauwas obtained from the land cover map of China (available at http://www.resdc.cn/), which was generated and interpreted by the Chinese Academy of Sciences. The precise diachronic classifications of grassland areas, which have been already used before as a reference for object-oriented classifications, were compared with ground-based data in this study. The result indicated that the land cover map we used had an89% overall accuracy. The topographic data and elevation data of the study area were extracted from the Shuttle Radar Topography Mission (SRTM) digital elevation model. Table 1 lists the other sources of environmental and cartographic data.
2.3.1Trend analysis
We used the least-squares linear regression model to detect temporal variations in NDVI, an indicator of grassland vegetation NPP, during the study period (i.e., 2000-2015). This method is commonly used to analyze the trends in similar types of data (Eklundh and Olsson, 2003; Stöckli and Vidale, 2004; González and Menenti, 2008; Beck et al., 2011). The per pixel-change trend was obtained by linearly fitting the variables of interest (NDVI or climatic variables) as a function of a time (in years):
y=a+b×t+ε, (1)
where y represents either the NDVI or climatic variables; a is the intercept; b is the slope (as a proxy of the trend); t is the time (years); and ε is the unexplained residual error. It is considered that grassland restoration is occurring if b>0, whereas grassland degradation is occurring if b<0. The significant difference of the slope values was tested using the t-test, with significance threshold set at P<0.05.Interactive Data Language (IDL) 4.8 (Harris Corporation, Melbourne, FL, USA) was used to calculate the slope and P values(Xiao and Ouyang, 2019).
2.3.2Correlation analysis
We used Pearson's correlation coefficient (r) to examine the relationshipbetween NDVI and climatic variables over time, which is expressed as follows:
$r=\frac{\operatorname{cov}(x,y)}{\sqrt{\operatorname{cov}(x,x)\operatorname{cov}(y,y)}}=\frac{n\sum{xy-\sum{x\sum{y}}}}{\sqrt{(n\sum{{{x}^{2}}-(\sum{x{{)}^{2}})(n\sum{{{y}^{2}}-(\sum{y{{)}^{2}})}}}}}},$ (2)
where r is the linear correlation coefficient; covis the covariance; x is the NDVI value; y is the precipitation (mm) or temperature (°C); and n is the sample size.
2.3.3Identification of the precipitation signal
Previous studies suggest that annual maximum NDVI is strongly correlated with climatic variables(Evans and Geerken, 2004). Hence, for a proper assessment of temporal trends in vegetation NPP, we analyzed the monthly variation in grassland NDVI in addition to field observations. Annual maximum NDVI from January to December is simply considered as the highest NDVI value obtained in the grid.Usually, the vegetation NPP peaks between July and August in the study area (Hua et al., 2015). Since annual maximum NDVI is the main factor representing the growthof grasses (Ding et al., 2007), it can be used to gauge grassland vegetation growth in the northeastern Qinghai-Tibet Plateau and by extension, to represent the grassland production capacity.
As described by Liu et al. (2013), we determined the correlation between precipitation amounts over different time scales andannual maximum NDVI. As the precipitation period was most strongly correlated with plant growth, we calculated the precipitation accumulation periodsand lag periodsuntil the occurrence of the absolute NDVI value from September to August of the nextyear (Fig. 2). For example, precipitation accumulated over a 1-month period was correlated with the July or August NDVI for that given year. All possible correlation combinations were tested, from which the strongest correlation was detected. Data processing was carried out in the IDL v4.8 interactive framework, which is aprogramming languageused for data analysis.
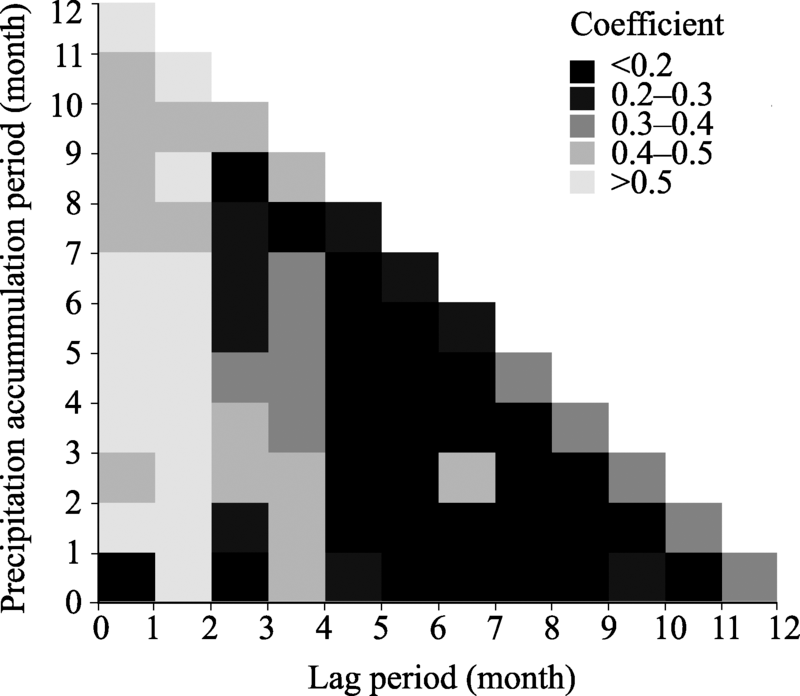
Fig. 2
Pearson’s correlation coefficients of July (or August) NDVI (normalized difference vegetation index) with precipitation accumulation periods and different lag periods until the occurrence of the absolute NDVI value. The x-axis (lag period) shows the time periods (1-month intervals) before the NDVI peaked during the precipitation accumulation time, and the y-axis (accumulation period) gives the total time period over which precipitation had accumulated.
Based on the results, we selected the precipitation accumulated from 1 September of the previous year to 1 August of the current year as annualprecipitationand used the annual average temperature (because of the recurring pattern of low inter-annual variability) to relate climatic variables to plant growth.
2.3.4Statistical and multivariate analyses
A constrained ordination approach, i.e., RDA,was applied to interpret the impact of climate change and human activities on the NDVI trend. This approach also revealed the relative contributions of different variables by assessing how each variable may have influenced the spatial patterns of NDVI. RDA, introduced by van den Wollenberg (1977), is a constrained ordination technique similar to principal component analysis (PCA). It uses sampling site scores that are constrained by linear combinations of the environmental variables used in the analysis, and is recognized as a constrained counterpart of PCA (Ter Braak and Šmilauer, 2015). According to Wildi (2017), RDA performs slightly better (34.7% explained variance) than CCA (28.3% explained variance) for assessing the key factors affecting vegetation dynamics.
In this study, RDA was carried out in CANOCO v4.5 (Ter Braak and Smilauer, 2002; Lepš and Šmilauer, 2003) on the aforementioned environmental variables as predictors (independent variables). We ranked the environmental variables according to their quantitative importance by forward selection. In the RDA calculation, the mean for the NDVI trend was considered as the dependent (response) variable while the environmental variables were regarded as independent variables. Bivariate plots graphically presented the RDA outcomes. One-way analysis of variance (ANOVA) was applied to test the significant differences of NDVI, temperature and precipitation across years, using SPSS v17.0 (SPSS Inc., 2008).
The patterns of annual variation in NDVI and climatic variables during 2000-2015 in the northeastern Qinghai-Tibet Plateau, TRH zone and NTRH zone (Figs. 3-5) revealed that at the temporalscale, the maximum NDVI occurred in 2012. As the same pattern was observed for precipitation in the northeastern Qinghai-Tibet Plateau, TRH zone and NTRH zone, we found a correlation between NDVI and precipitation trends over the whole study area. The highest mean correlation coefficient was obtained for the entire grassland from 1 September to 1 August of the next year. The results showed similar trends of annual NDVI, temperature and precipitation in the TRH zoneand NRTH zone. Evidently, over the entire study period, the NDVI in the northeastern Qinghai-Tibet Plateau increased, and similar trends were also detected in the TRH and NTRH zones. Specifically, the NDVI increased at the rates of 0.0015/a and 0.0020/a from 2000 to 2015in the TRH and NTRH zones, respectively(Fig. 6). Generally, the overall trends of precipitation and temperature displayed a slight increase over the 16-year study period.
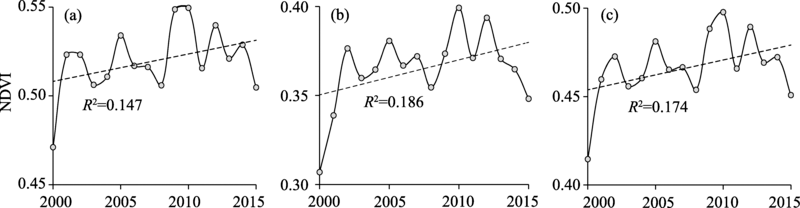
Fig. 3
Annual variations of NDVI from 2000 to 2015 in the TRH zone (a), NTRH zone (b) and northeastern Qinghai-Tibet Plateau (the whole study area; c). The dotted lines indicate regressions fitted for the period 2000-2015.
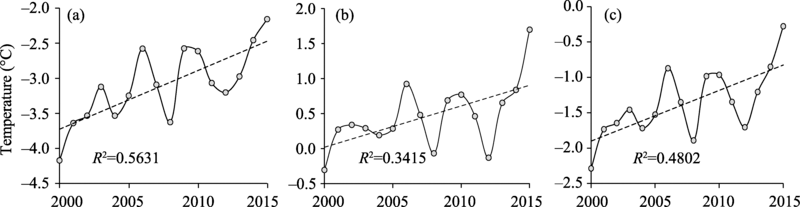
Fig. 4
Annual variations of air temperature from 2000 to 2015 in the TRH zone (a), NTRH zone (b) and northeastern Qinghai-Tibet Plateau (the whole study area; c). The dotted lines indicate regressions fitted for the period 2000-2015.
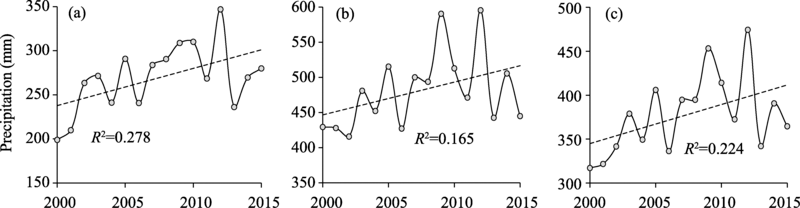
Fig. 5
Annual variations of precipitationfrom 2000 to 2015 in the TRH zone (a), NTRH zone (b) and northeastern Qinghai-Tibet Plateau (the whole study area;c).The dotted lines indicate regressions fitted for the period 2000-2015.
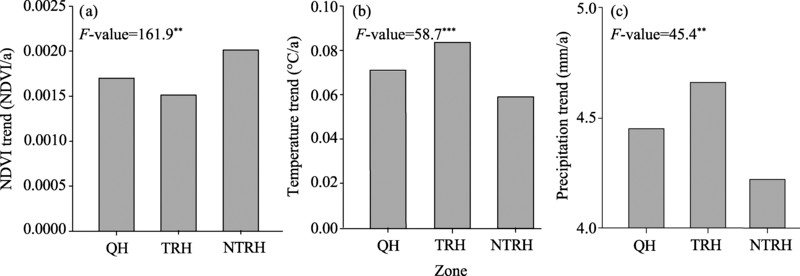
Fig. 6
Overall trends of NDVI (a), temperature (b) and precipitation (c) during the period 2000-2015 in the QH zone (northeastern Qinghai-Tibet Plateau),TRH zone and NTRH zone. An F-value corresponds to the F-ratio from a one-way ANOVA comparing the variables among different zones.**, significance at P<0.01 level; ***, significance at P<0.001 level.
As shown in Figure 7a, during the study period 2000-2015, NDVI indicated an overall increasing trend in the grasslands of the northeastern Qinghai-Tibet Plateau, which occurred in the 73.32% of the total grassland area. Grasslands with the increase of NDVI was continuously distributed, mainly in the central and eastern plains of the study area. In contrast, grasslands in the northeastern and southeastern parts of the study area, which had dense human populations, showed a minor positive trend of long-term vegetation NPP. Figure 7b depicts the significance of changes in the NDVI trend over the whole study area. The areas with slight increase in NDVI generally showed insignificant change trends. Approximately 23.14% of the total grassland area in the northeastern Qinghai-Tibet Plateau showed a decline in vegetation NPP. Grasslands with the decrease of NDVI was patchily distributed, mainly in the eastern and southern pastures of the study area. In contrast, the high-altitude grasslands in the western part, which benefit from the effects of mist, exhibited positive or stable trends in their long-term vegetation NPP.
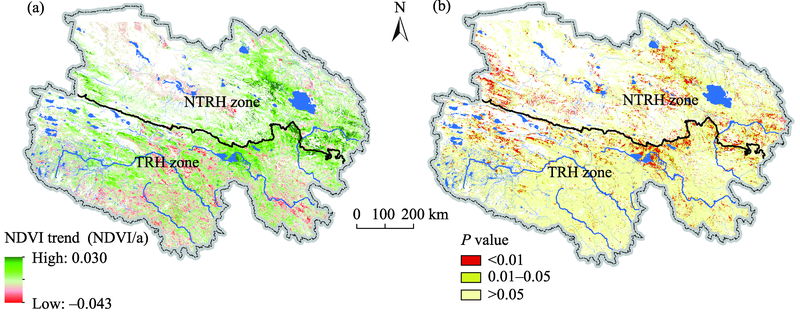
Fig. 7
Overall trends in increasingvegetation (net primary productivity) NPP of grasslands in the northeastern Qinghai-Tibet Plateau during the period 2000-2015 as depicted bythe rate of changesin NDVI(a) and the per pixel significance of changes in the NDVI trend (b) for the study period. Trends are deemed insignificant if the P value is higher than 0.05.
Increased grassland functioning was found in both TRH and NTRH zones, however, the former's improvement exceeded the latter's (Table 2), suggesting that the TRH zone, with lower levels of human disturbances, experienced superior vegetation recovery. In addition to the precipitation and temperature, other factors including the level of human disturbances, plant species composition and differences in plant functional types, may have also contributed to this pattern of change.
Table 2
Increasingand decreasing trends in grasslandsin the northeastern Qinghai-Tibet Plateau
In the RDA, a number of factors, including conservation area, village population, cattle density, sheep density, GDP, agricultural GDP, industrial GDP, service industry GDP, precipitation and temperature, were investigated to determine their influences on the changes of NDVI trend in the northeastern Qinghai-Tibet Plateau. The results derived from the RDA suggested that precipitation accounted for 9.2% of the total variation in NDVI, while temperature accounted for 13.4% (Fig. 8a). Meanwhile, village population, agricultural GDPand conservation area accounted for 17.8%, 17.1% and 7.6% of the total variation in NDVI, respectively (Fig. 8a).
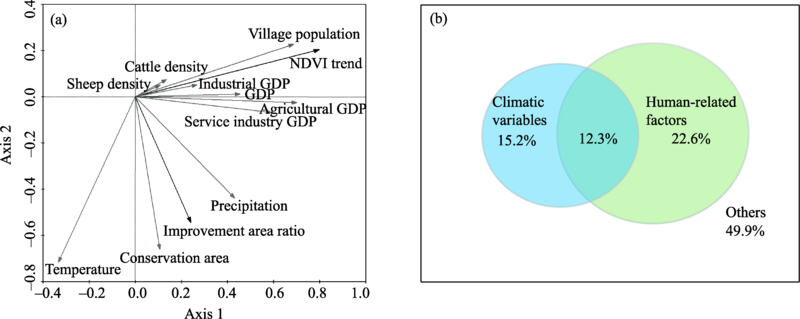
Fig. 8
Ordinate plot from the redundancy analysis (RDA) of vegetation change trends and their relationships with climatic variables and human-related factors (a) and variance partitioning revealed the contribution percentages of the variables (climatic variables, human-related factors and their shared proportion, and the residual variance) to the NDVI variation (b). The first and second axes explained 31.8% and 18.3% of the total variation in NDVI, respectively. GDP, gross domestic product.
Additionally, we applied variance partitioning to reveal the contribution percentages of the variables (climatic variables, human-related factors and their shared proportion, and the residual variance) to the NDVI variation. The total contribution percentage of climatic variables to the NDVI variation was just27.5% (Fig. 8b). The other variables representing the human-related factors in the RDA model, includingGDP, village population, cattle density, sheep density and conservation area, together explained 34.9% of the total variationin NDVI.
Since its original formulation by Rouse et al. (1973), the NDVI has been used in many studies ofvegetation dynamics and their responses to climate change, especially with respect to temperature and precipitation in global change studies (Potter et al., 2008; Piao et al., 2011a; Bao et al., 2015). Our study demonstrated a significant increase in vegetation NPP of grasslands in the northeastern Qinghai-Tibet Plateau over the 16-year study period (from 2000 to 2015). Variation in precipitation likely played a primary role in determining the trend of vegetation productivity. These findings agree with other studies (e.g., Zemmrich et al., 2010). Moreover, variation in vegetation NPP is not only a response to long- and short-term precipitation changes (non-equilibrium theory), but also a response to the effects of human activities (Xiong et al., 2017).
The overall increase in annual NDVI in the NTRH zone (0.0020/a) was greater than that in the TRH zone (0.0015/a). The correlation between NDVI and precipitation trends was found over the whole study area. However, the increase in precipitation in the TRH zone (4.66 mm/a) was slightly higher than that in the NTRH zone (4.22 mm/a; Fig. 6). This may be a consequence of the low initial value of NDVI (Fig. 3) and the rapid increase of grasslands during the period 2000-2002 due to the implementation of the Grain for Green Project in the NTRH zone (Xiao et al., 2019).About 45.69% of the total grassland area in the TRH zone displayed anincreasing trend (with significant positive change in the 9.64% of the total grassland area in this zone), while only about 27.63% of the total grassland area in the NTRH zone showed the similar trend (with significantpositive changein the9.72% of the total grassland area in this zone). This can be attributed to the fact that the TRH zone contains more initial grasslandsthan the NTRH zone. Furthermore, compared with the NTRH zone, the TRH zone also receives more administrative protection, which minimizes human disturbances and could have accelerated the vegetation recovery. Nevertheless, we still observed that in the TRH zone, grasslands with a total area of 4838 km2 (percentage of 1.23%) experienced a significant degradation (Table 2), which are likely caused by human activities. These findings are consistent with the results reported in previous studies (e.g., Cai et al., 2015; Gao et al., 2016).
Climate change is considered one of the major drivers influencing vegetation productivity (Angert et al., 2005), especially in alpine ecosystems (Xiong et al., 2016; Dakhil et al., 2019) which are known for their high sensitivity to fluctuations in climatic conditions, particularly temperature and precipitation(Zhou et al., 2001; Qin et al., 2014).Increasing vegetation productivity of grasslands in response to wetter and warmer conditionsresults from the fact that wetter environment increases the water availability in soil for vegetation uptake and growth (Xiong et al., 2016). Additionally, rising temperature increases the length of growing season, promoting soil water availability by melting snow and ice and finally providingmore available water for plant growth in a relative long time. This interpretation was partly confirmed by the close linear relationship found between NDVI and precipitation or temperature. However, it should be noted that the link between temperature andNDVIof grasslands is more complex than it has been suggested, so thorough investigations are still needed (Shen et al., 2016). Our RDA results agree with recent studies which revealed that climate change, particularly the increase in temperature, has negatively affected plant growth, especially in alpine meadows in the Qinghai-Tibet Plateau (Xiong et al., 2016). The higher temperatures have enhanced permafrost thawing, which in turn inhibited the growth of plants with shallow root systems, causing the degradation of alpine meadows (Xue et al., 2009; Song et al., 2018).Throughout the entire study area (i.e., the northeastern Qinghai-Tibet Plateau), the NDVI was positively correlated with precipitationwhile negatively correlated with temperature (Fig. 8a). The result partly agrees with the finding of Bao et al. (2015), who conducted a study of vegetation in Mongolia and found that the positive correlation between NDVI and precipitation clearly increased from the meadow steppe type to the desert steppe type, implying that precipitationis a key factor regulating vegetation in grasslands (Piao et al., 2006; Bao et al., 2015). These results, at least in part, suggest that at the continental scale, the current increase in vegetation NPP observed across the study area is probably due to recent climate change.
The RDA results indicated that most of the grassland improvement was driven by precipitation and human-related factors, revealing the importance of human activities in vegetation dynamics across the study area. In the northeastern Qinghai-Tibet Plateau, human activities,including agricultural planting, intensive grazing and human-induced land cover changes from the excavation of alluvial gold, collection of medicinal herbs (e.g., Cordyceps sinensis), fuel wood collection and uncontrolled cross-country driving,are likely to have significant impacts on vegetationNPP of alpine meadow (Harris, 2010; Chen et al., 2013). These activities are closely related to the location of people andagricultural GDP. Consequently, with increases in livestock and human populations, grazing pressure intensifies, leading to a loss in sequestered carbon and an increase in ruminant methane emission from the plateau (Chen et al., 2013). Continuous heavy grazing may result in severe degradation of grassland or even desertification in the northeastern Qinghai-Tibet Plateau(Wang et al., 2012; Chen et al., 2013). The RDA results revealed that village populationwas the most important influencing factor on the changes in vegetation dynamics across the entire study area, followed byagricultural GDP(explaining 17.8% and 17.1% of the total variation in NDVI, respectively).
A national policy of ecological protection and ecological compensation has been implemented throughout the TRH zonesince 2003, with the aim of protecting degraded grasslands and maintaining the stocking rate of livestock at acceptable levels. This study revealed that the enforcement of this policy in the TRHzone could have played a positive role in grassland restoration, as it explained 7.6% of the total variation in NDVI. Similar positive effects of such grassland protection policies were also reported for other similar grassland ecosystems in Inner Mongolia and Loess Plateau of China (Feng et al., 2013; Mu et al., 2013).
The resultssuggested that although temperature driver exerted negative impacts, the changes in precipitation regime increased vegetation NPP of grasslands in the northeastern Qinghai-Tibet Plateau. Meanwhile, human-related factorssuch as village population andagricultural GDPhad positiveeffects on changes in the vegetation NPP. Moreover, the implementation of protection measures and programs in the TRH zone may have played a positive role in grassland restoration. An NDVI-based analysis of changes in vegetationNPP is important for facilitating comparisons with the results of earlier and future studies, and could also improve similar analyses in a number of ways. The RDA performed successfully in separating the relative contributions of human activities and climate change to the NDVI variation, showing the former to be the major factor influencing the grassland vegetation dynamics in the northeastern Qinghai-Tibet Plateau. The study thus revealed the merit of using the RDA as a constrained ordination approach to assess the contribution of climate change versus that of other human-related factors on the vegetation dynamics in different ecosystems. However, using more sophisticated analytical modeling approaches could improve our understanding of the respective influence of driving factors on vegetation dynamics. In this respect, additional studies using process-based simulation models that explicitly take into account other human-related factors (e.g., tourism and land cover/use changes) alongside climate change would be very useful. This could improve future assessments, management planning and policy-making relevant to grassland ecosystems in China and to other similar ecosystems of arid and semi-arid lands in the world.
This research was funded by the National Key Research and Development Program of China (2016YFC0502101), the National Natural Science Foundation of China (31700544) and the Chinese Academy of Sciences (CAS) "Light of West China" Program (2016XBZG-XBQNXZ-B005). The authors thank Mr. XIONGKaiming for his help during the preparation of the manuscript. We also appreciate the helpful comments from theanonymous reviewers and editors on this article.
