Please wait a minute...
Journal of Arid Land  2021, Vol. 13 Issue (4): 397-412    DOI: 10.1007/s40333-021-0063-8
Research article     
Enhancement of freshwater production of the seawater greenhouse condenser
Tahani K BAIT SUWAILAM1, Abdulrahim M AL-ISMAILI1,*(), Nasser A AL-AZRI2, L H Janitha JEEWANTHA1, Hemesiri KOTAGAMA3
1Department of Soils, Water and Agricultural Engineering, Sultan Qaboos University, Al-Khoud 123, Oman
2Department of Mechanical and Industrial Engineering, Sultan Qaboos University, Al-Khoud 123, Oman
3Department of Natural Resource Economics, Sultan Qaboos University, Al-Khoud 123, Oman
Download: HTML     PDF(2145KB)
Export: BibTeX | EndNote (RIS)      

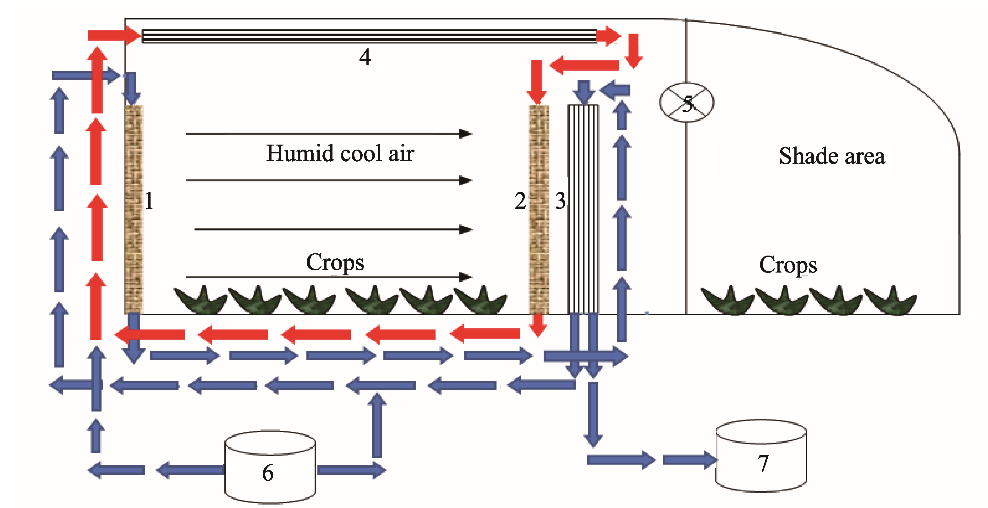
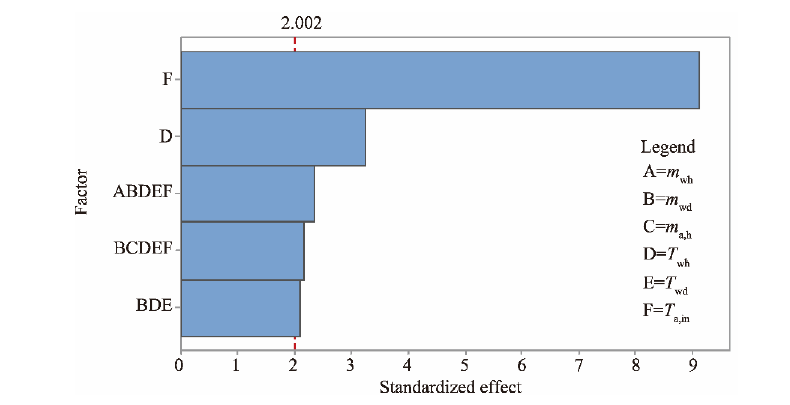
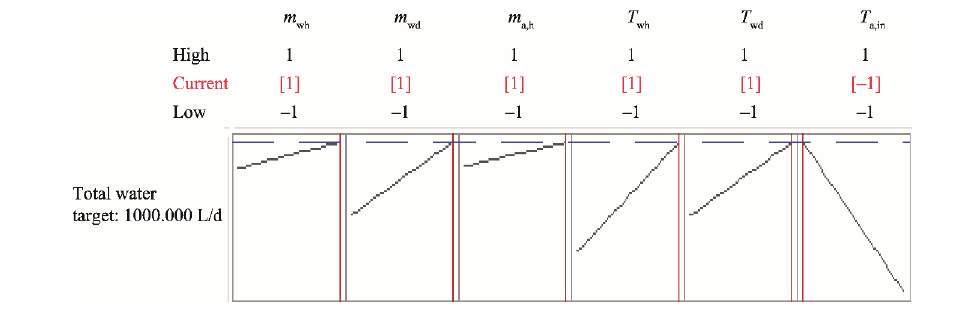
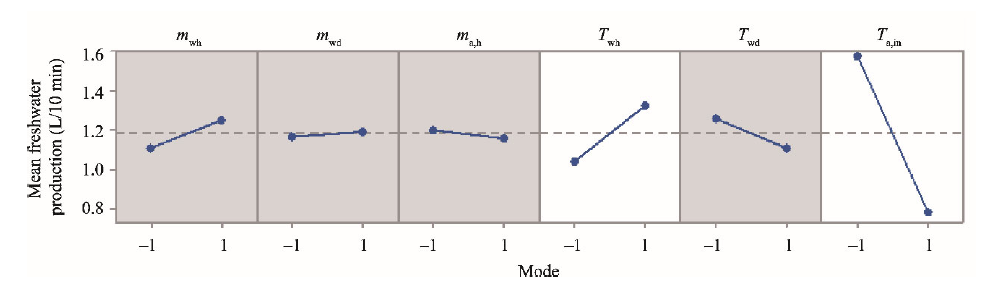
Abstract  

Seawater greenhouse (SWGH) is a technology established to overcome issues related to open field cultivation in arid areas, such as the high ambient temperature and the shortage of freshwater. It adopts the humidification-dehumidification concept where evaporated moisture from a saline water source is condensed to produce freshwater within the greenhouse body. Various condenser designs are adopted to increase freshwater production in order to meet the irrigation demand. The aim of this study was to experimentally investigate the practicality of using the packed-type direct contact condenser in the SWGH to produce more freshwater at low costs, simple design and high efficiency, and to explore the impact of the manipulating six operational variables (inlet air temperature of the humidifier, air mass flowrate of the humidifier, inlet water temperature of the humidifier, water mass flowrate of the humidifier, inlet water temperature of the dehumidifier and water mass flowrate of the dehumidifier) on freshwater condensation rate. For this purpose, a direct contact condenser was designed and manufactured. Sixty-four full factorial experiments were conducted to study the effect of the six operational variables. Each variable was operated at two levels (high and low flowrate), and each experiment lasted for 10 min and followed by a 30-min waiting time. Results showed that freshwater production varied between 0.257 and 2.590 L for every 10 min. When using Minitab statistical software to investigate the significant variables that contributed to the maximum freshwater production, it was found that the inlet air temperature of the humidifier had the greatest influence, followed by the inlet water temperature of the humidifier; the former had a negative impact while the latter had a positive impact on freshwater production. The response optimizer tool revealed that the optimal combination of variables contributed to maximize freshwater production when all variables were in the high mode and the inlet air temperature of the humidifier was in the low mode. The comparison between the old plastic condenser and the new proposed direct contact condenser showed that the latter can produce 75.9 times more freshwater at the same condenser volume.


Key wordsseawater greenhouse      humidification-dehumidification      direct contact condenser      freshwater production      water desalination     
Received: 11 March 2020      Published: 10 April 2021
Corresponding Authors:
About author: * Abdulrahim M AL-ISMAILI (E-mail: abdrahim@squ.edu.om; abdrahim@hotmail.co.uk)
Cite this article:

Tahani K BAIT SUWAILAM, Abdulrahim M AL-ISMAILI, Nasser A AL-AZRI, L H Janitha JEEWANTHA, Hemesiri KOTAGAMA. Enhancement of freshwater production of the seawater greenhouse condenser. Journal of Arid Land, 2021, 13(4): 397-412.

URL:

http://jal.xjegi.com/10.1007/s40333-021-0063-8     OR     http://jal.xjegi.com/Y2021/V13/I4/397

Fig. 1 Schematic diagram of the seawater greenhouse (SWGH). 1, first evaporative cooler; 2, second evaporative cooler; 3, condenser; 4, solar heater; 5, fan; 6, saline groundwater well; 7, freshwater tank. Red arrows, hot water cycle; blue arrows, cold water cycle.
Fig. 2 Schematic diagram of the experimental setup of the packed-type direct contact dehumidification (DCD) system. Red arrows, hot water cycle; blue arrows, cold water cycle.
Fig. 3 Two-dimension design (a) and layout (b) of the direct contact dehumidification (DCD) system. T1-T7, thermocouple sensors; RHT1-RHT3, relative humidity and temperature sensors.
Instrument Model Measurements range Accuracy
Digital anemometer HHF-SD1, OMEGA, Taiwan of China 0.2-5.0 m/s ±5%
T-type thermocouple TT-T-22-SLE-1000, OMEGA, USA 0.0°C-260.0°C ±2%
Relative humidity and
temperature sensor
HMP155, VAISALA, Finland 0%-100% for relative humidity and -80.0°C-60.0°C for temperature ±2% for relative humidity and ±0.2°C for temperature
Table S1 Technical specification of the instruments used in the study
Effect mwh (kg/s) mwd (kg/s) ma,h (kg/s) Twh (°C) Twd (°C) Ta,in (°C)
High 0.27 0.15 0.04±0.01 50.0±5.0 31.0±5.0 28.0±3.0
Low 0.19 0.13 0.02±0.01 35.0±5.0 24.0±5.0 23.0±3.0
Table 1 Experimental values (high and low) of the six operational variables used in this experiment
Fig. 4 Typical 3-d water temperature data of the SWGH as recorded in May 2005 (Bait-Suwailam and Al-Ismaili, 2019)
Fig. 5 Typical 3-d air temperature data of the SWGH as recorded in May 2005 (Bait-Suwailam and Al-Ismaili, 2019)
Fig. 6 Typical 3-d relative humidity data of the SWGH as recorded in May 2005 (Bait-Suwailam and Al Ismaili, 2019)
Experiment mwh
(kg/s)
mwd
(kg/s)
ma,h
(kg/s)
Twh
(°C)
Twd
(°C)
Ta,in
(°C)
Measured
production
(L/10 min)
Measured
production
(L/h)
1 0.19 0.15 0.04±0.01 50.0±5.0 24.0±5.0 23.0±3.0 0.970 5.820
2 0.27 0.15 0.04±0.01 50.0±5.0 24.0±5.0 23.0±3.0 1.800 10.800
3 0.27 0.15 0.02±0.01 35.0±5.0 31.0±5.0 23.0±3.0 1.090 6.540
4 0.27 0.15 0.02±0.01 50.0±5.0 24.0±5.0 23.0±3.0 2.300 13.800
5 0.19 0.13 0.04±0.01 50.0±5.0 31.0±5.0 23.0±3.0 1.520 9.120
6 0.27 0.13 0.04±0.01 35.0±5.0 31.0±5.0 23.0±3.0 2.362 14.172
7 0.27 0.13 0.04±0.01 50.0±5.0 31.0±5.0 23.0±3.0 1.200 7.200
8 0.27 0.13 0.02±0.01 35.0±5.0 24.0±5.0 28.0±3.0 0.590 3.540
9 0.19 0.15 0.04±0.01 35.0±5.0 31.0±5.0 23.0±3.0 1.380 8.280
10 0.19 0.13 0.02±0.01 35.0±5.0 31.0±5.0 23.0±3.0 1.152 6.912
11 0.19 0.13 0.04±0.01 35.0±5.0 31.0±5.0 28.0±3.0 0.674 4.044
12 0.27 0.15 0.04±0.01 50.0±5.0 31.0±5.0 23.0±3.0 2.209 13.254
13 0.19 0.13 0.02±0.01 50.0±5.0 31.0±5.0 23.0±3.0 2.249 13.494
14 0.27 0.13 0.02±0.01 35.0±5.0 31.0±5.0 28.0±3.0 0.617 3.702
15 0.27 0.15 0.02±0.01 35.0±5.0 24.0±5.0 23.0±3.0 2.373 14.238
16 0.27 0.15 0.04±0.01 50.0±5.0 31.0±5.0 28.0±3.0 1.415 8.490
17 0.19 0.15 0.04±0.01 50.0±5.0 24.0±5.0 28.0±3.0 0.485 2.910
18 0.27 0.13 0.02±0.01 50.0±5.0 31.0±5.0 23.0±3.0 1.570 9.420
19 0.27 0.13 0.02±0.01 35.0±5.0 24.0±5.0 23.0±3.0 1.513 9.078
20 0.27 0.13 0.02±0.01 35.0±5.0 31.0±5.0 23.0±3.0 0.874 5.244
21 0.19 0.15 0.02±0.01 35.0±5.0 31.0±5.0 23.0±3.0 1.041 6.246
22 0.19 0.15 0.04±0.01 35.0±5.0 31.0±5.0 28.0±3.0 0.630 3.780
23 0.19 0.13 0.04±0.01 50.0±5.0 24.0±5.0 23.0±3.0 1.920 11.520
24 0.27 0.13 0.04±0.01 50.0±5.0 24.0±5.0 23.0±3.0 2.590 15.540
25 0.19 0.15 0.02±0.01 50.0±5.0 31.0±5.0 23.0±3.0 1.836 11.016
26 0.19 0.15 0.04±0.01 50.0±5.0 31.0±5.0 23.0±3.0 1.760 10.560
27 0.19 0.13 0.02±0.01 50.0±5.0 24.0±5.0 23.0±3.0 1.631 9.786
28 0.19 0.13 0.02±0.01 50.0±5.0 31.0±5.0 28.0±3.0 1.067 6.402
29 0.27 0.15 0.02±0.01 50.0±5.0 31.0±5.0 23.0±3.0 1.070 6.420
30 0.19 0.13 0.02±0.01 35.0±5.0 31.0±5.0 28.0±3.0 0.489 2.934
31 0.19 0.13 0.02±0.01 50.0±5.0 24.0±5.0 28.0±3.0 1.279 7.674
32 0.27 0.13 0.04±0.01 35.0±5.0 24.0±5.0 23.0±3.0 0.940 5.640
33 0.27 0.13 0.04±0.01 50.0±5.0 31.0±5.0 28.0±3.0 0.851 5.106
34 0.27 0.15 0.02±0.01 50.0±5.0 24.0±5.0 28.0±3.0 1.366 8.196
35 0.27 0.13 0.02±0.01 50.0±5.0 24.0±5.0 23.0±3.0 2.000 12.000
36 0.19 0.13 0.02±0.01 35.0±5.0 24.0±5.0 23.0±3.0 1.725 10.350
Experiment mwh
(kg/s)
mwd
(kg/s)
ma,h
(kg/s)
Twh
(°C)
Twd
(°C)
Ta,in
(°C)
Measured
production
(L/10 min)
Measured
production
(L/h)
37 0.19 0.15 0.02±0.01 35.0±5.0 24.0±5.0 23.0±3.0 1.423 8.538
38 0.19 0.15 0.02±0.01 50.0±5.0 31.0±5.0 28.0±3.0 1.007 6.042
39 0.27 0.15 0.02±0.01 35.0±5.0 31.0±5.0 28.0±3.0 0.694 4.164
40 0.19 0.15 0.02±0.01 35.0±5.0 31.0±5.0 28.0±3.0 0.620 3.720
41 0.27 0.13 0.02±0.01 50.0±5.0 31.0±5.0 28.0±3.0 1.015 6.090
42 0.27 0.15 0.04±0.01 35.0±5.0 31.0±5.0 28.0±3.0 0.700 4.200
43 0.19 0.15 0.04±0.01 35.0±5.0 24.0±5.0 28.0±3.0 0.720 4.320
44 0.19 0.13 0.04±0.01 35.0±5.0 24.0±5.0 23.0±3.0 1.519 9.114
45 0.19 0.15 0.04±0.01 35.0±5.0 24.0±5.0 23.0±3.0 1.433 8.598
46 0.27 0.15 0.04±0.01 50.0±5.0 24.0±5.0 28.0±3.0 1.065 6.390
47 0.27 0.15 0.04±0.01 35.0±5.0 24.0±5.0 28.0±3.0 0.932 5.592
48 0.19 0.15 0.02±0.01 35.0±5.0 24.0±5.0 28.0±3.0 0.984 5.904
49 0.19 0.13 0.04±0.01 50.0±5.0 31.0±5.0 28.0±3.0 0.648 3.888
50 0.27 0.15 0.02±0.01 35.0±5.0 24.0±5.0 28.0±3.0 0.828 4.968
51 0.27 0.13 0.02±0.01 50.0±5.0 24.0±5.0 28.0±3.0 1.106 6.636
52 0.19 0.13 0.04±0.01 50.0±5.0 24.0±5.0 28.0±3.0 1.007 6.042
53 0.27 0.15 0.04±0.01 35.0±5.0 31.0±5.0 23.0±3.0 0.885 5.310
54 0.19 0.13 0.04±0.01 35.0±5.0 31.0±5.0 23.0±3.0 0.997 5.982
55 0.27 0.15 0.02±0.01 50.0±5.0 31.0±5.0 28.0±3.0 0.830 4.980
56 0.19 0.15 0.02±0.01 50.0±5.0 24.0±5.0 23.0±3.0 1.327 7.962
57 0.27 0.13 0.04±0.01 35.0±5.0 24.0±5.0 28.0±3.0 0.795 4.770
58 0.19 0.13 0.04±0.01 35.0±5.0 24.0±5.0 28.0±3.0 0.432 2.592
59 0.19 0.15 0.04±0.01 50.0±5.0 31.0±5.0 28.0±3.0 0.662 3.972
60 0.27 0.15 0.04±0.01 35.0±5.0 24.0±5.0 23.0±3.0 2.030 12.180
61 0.19 0.13 0.02±0.01 35.0±5.0 24.0±5.0 28.0±3.0 0.515 3.090
62 0.27 0.13 0.04±0.01 35.0±5.0 31.0±5.0 28.0±3.0 0.257 1.542
63 0.19 0.15 0.02±0.01 50.0±5.0 24.0±5.0 28.0±3.0 0.350 2.100
64 0.27 0.13 0.04±0.01 50.0±5.0 24.0±5.0 28.0±3.0 0.290 1.740
Table S2 Production of freshwater from all 64 experiments with the high and low values of each variable
Fig. 7 Pareto chart of the standardized effects when only the significant variables and interactions were included (P=0.05). mwh, water mass flowrate of the humidifier; mwd, water mass flowrate of the dehumidifier; ma,h, air mass flowrate of the humidifier; Twh, inlet water temperature of the humidifier; Twd, inlet water temperature of the dehumidifier; Ta,in, inlet air temperature of the humidifier.
Item F value P value
Model 21.60 0.000
Linear 46.71 0.000
Twh 10.52 0.002
Ta,in 82.89 0.000
3-way interactions 4.35 0.041
mwd×Twh×Twd* 4.35 0.041
5-way interactions 5.11 0.009
mwh×mwd×Twh×Twd×Ta,in* 5.55 0.022
mwd×ma,h×Twh×Twd×Ta,in* 4.67 0.035
Table 2 Analysis of variance (ANOVA) of the significant effects of the six selected variables and their interactions
Item Coefficient
Constant 1.1814
Twh 0.1435
Ta,in -0.4026
mwd×Twh×Twd* 0.0923
mwh×mwd×Twh×Twd×Ta,in* -0.1041
mwd×ma,h×Twh×Twd×Ta,in* -0.0955
Table 3 Regression coefficients for the significant variables and interactions
Response Goal Lower Target Upper
Total freshwater production (L/d) Target 1.542 1000.000 1100.000
Table 4 Response optimizer tool with the goal of maximizing freshwater production
mwh mwd ma,h Twh Twd Ta,in Total fitted freshwater production (L/10 min)
1 1 1 1 1 -1 2.08848
Table 5 Optimal variable combination that contributes to the maximum freshwater production and the fitted production value
Fig. 8 Optimal combination that contributes to the maximum freshwater production. The value of 1 denotes the high level of each variable while the value of -1 denotes the low level of each variable. Horizontal dashed blue line is the x-axis; red vertical line is the y-axis; black line is the slope that shows the impact of the variable on freshwater production. mwh, water mass flowrate of the humidifier; mwd, water mass flowrate of the dehumidifier; ma,h, air mass flowrate of the humidifier; Twh, inlet water temperature of the humidifier; Twd, inlet water temperature of the dehumidifier; Ta,in, inlet air temperature of the humidifier.
Fig. 9 Overall effect of the six variables on the mean freshwater production. The value of 1 denotes the high level of each variable while the value of -1 denotes the low level of each variable. The effects shaded in grey are considered not significant therefore their impacts on the mean freshwater production are not explained. The slope of line indicates the strength of the effect on the mean freshwater production. The grey dotted line is the mean freshwater production of the 64 experiments, which equals to 1.180 L/10 min.
Fig. 10 Psychrometric chart for the experiments with maximum (P1, P2 and P3 in yellow) and minimum (P4, P5 and P6 in red) freshwater production. P1-P6, state points with the combination of temperature, relative humidity and humidity ratio.
Variable P1 P2 P3 P4 P5 P6
Dry bulb temperature (°C) 24.8 38.5 35.8 26.3 30.9 29.0
Wet bulb temperature (°C) 16.8 38.5 34.0 19.7 30.9 28.3
Dew point (°C) 11.8 38.5 33.6 16.3 30.9 28.0
Relative humidity (%) 44.2 100.0 88.6 54.1 100.0 94.6
Humidity ratio (kg/kg) 0.0086 0.0448 0.0337 0.0116 0.0287 0.0242
Enthalpy (J/kg) 46.8 153.9 122.5 56.0 104.5 91.0
Density (kg/m3) 1.179 1.104 1.120 1.171 1.142 1.152
Specific volume (m3/kg) 0.856 0.947 0.923 0.864 0.901 0.889
Pressure (Pa) 101,325 101,325 101,325 101,325 101,325 101,325
Airflow (m3/h) 122 122 122 122 122 122
Table 6 Values of different variables for each state point in the psychrometric chart of the experiments with the maximum and minimum freshwater production
Direct contact (DC) condenser Old plastic condenser (data source of Al-Ismaili et al. (2019)) Direct contact dehumidification (DCD) condenser (data source of Zamen et al. (2013))
Mode of freshwater collection Experimental Experimental Simulation
Maximum freshwater production (L) 2.590 300.000 450.000
Condensate collection period 10 min 14 h 14 h
Condenser volume (m3) 0.216 22.800 0.216
Freshwater produced per unit volume (L/(10 min·m3)) 11.990 0.158 24.800
Table 7 Specification of the three comparable condensers
[1]   Al-Ismaili A M. 2003. Modification of a Quonset greenhouse to a humidification-dehumidification system: design, construction and pilot testing. MSc Thesis. Muscat: Sultan Qaboos University.
[2]   Al-Ismaili A M, Weatherhead E K, Jayasuriya H P. 2012. Mathematical simulation of the dehumidifier of seawater greenhouse. In: International Conference of Agricultural Engineering. Valencia, Spain.
[3]   Al-Ismaili A M, Jayasuriya H. 2016. Seawater greenhouse in Oman: A sustainable technique for freshwater conservation and production. Renewable and Sustainable Energy Reviews, 54:653-664.
[4]   Al-Ismaili A M, Jayasuriya H, Al-Mulla Y, et al. 2018. Empirical model for the condenser of the seawater greenhouse. Chemical Engineering Communications, 205(9):1252-1260.
[5]   Al-Ismaili A M, Ramli N M, Hussain M A, et al. 2019. Artificial neural network simulation of the condenser of seawater greenhouse in Oman. Chemical Engineering Communications, 206(8):967-985.
[6]   Al-Khalidi A, Zurigat Y H, Dawoud B, et al. 2010. Performance of a greenhouse deslaination condenser: An experimental study. In: The 1st International Nuclear & Renewable Energy Conference (INREC). Amman, Jordan.
[7]   Al-Khalidi A, Zurigat Y H, Dawoud B, et al. 2013. Condenser designs for greenhouse desalination. International Journal of Sustainable Water and Environmental Systems, 5(1):1-6.
[8]   Bait-Suwailam T K, Al-Ismaili A M. 2019. Seawater greenhouse: Achievements and future development. Journal of Recent Patents on Engineering, 13(1):1-13.
[9]   Bourouni K, Chaibi M T, Tadrist L. 2001. Water desalination by humidification and dehumidification of air: state of the art. Desalination, 137(1-3):167-176.
[10]   Davies P, Charlie P. 2004. The seawater greenhouse and the watermaker condenser. In: The 3rd International Conference on Heat Powered Cycles. Larnaca, Cyprus.
[11]   Dawoud B, Zurigat Y H, Klitzing B, et al. 2006. On the possible techniques to cool the condenser of seawater greenhouses. Desalination, 195(1-3):119-140.
[12]   Eslamimanesh A, Hatamipour M S. 2009. Mathematical modeling of a direct contact humidification-dehumidification desalination process. Desalination, 237(1-3):296-304.
[13]   Fadel M A, AlMekhmary M, Mousa M. 2013. Water and energy use efficiencies of organic tomatoes production in a typical greenhouse under UAE weather conditions. In: ISHS Acta Horticulturae 1054: International Conference on Agricultural Engineering: New Technologies for Sustainable Agricultural Production and Food Security. Muscat, Oman, 81-88.
[14]   Ghaffour N, Reddy V K, Abu-Arabi M. 2011. Technology development and application of solar energy in desalination: Middle East Desalination Research Center (MEDRC) contribution. Renewable and Sustainable Energy Reviews, 15(9):4410-4415.
[15]   Ghaffour N, Bundschuh J, Mahmoudi H, et al. 2015. Renewable energy-driven desalination technologies: A comprehensive review on challenges and potential applications of integrated systems. Desalination, 356:94-114.
[16]   Goosen M F, Al-Hinai H, Sablani S. 2001. Capacity-building strategies for desalination: activities, facilities and educational programs in Oman. Desalination, 141(2):181-189.
[17]   Hajiamiri M, Salehi G R. 2013. Modeling of the seawater greenhouse systems. Life Science Journal, 10(8):353-359.
[18]   Liao C M, Chiu K H. 2002. Wind tunnel modeling the system performance of alternative evaporative cooling pads in Taiwan region. Building and Environment, 37(2):177-187.
doi: 10.1016/S0360-1323(00)00098-6
[19]   Mahmoudi H, Spahis N, Abdul-Wahab A S, et al. 2010. Improving the performance of a seawater greenhouse desalination system by assessment of simulation models for different condensers. Renewable and Sustainable Energy Reviews, 14(8):2182-2188.
[20]   Mehrgoo M, Amidpour M. 2012. Constructal design and optimization of a direct contact humidification-dehumidification desalination unit. Desalination, 293:69-77.
[21]   Nawayseh N K, Farid M M, Omar A A, et al. 1999. Solar desalination based on humidification process—IIn. Computer simulatio. Energy Conversion and Management, 40(13):1441-1461.
[22]   Niroomand N, Zamen M, Amidpour M. 2015. Theoretical investigation of using a direct contact dehumidifier in humidification-dehumidification desalination unit based on an open air cycle. Desalination and Water Treatment, 54(2):305-315.
[23]   Pahlavan R, Omid M, Akram A. 2011. Modeling and sensitivity analysis of energy inputs for greenhouse cucumber production. Journal of Agricultural Technology, 7(6):1509-1521.
[24]   Sablani S S, Perret J, Goosen M F A, et al. 2005. Development of humidification-dehumidification seawater greenhouse technology for arid coastal regions. In: The 3th LACCEI International Latin American and Caribbean Conference for Engineering and Technology "Advances in Engineering and Technology: A Global Perspective". Cartagena, Colombia.
[25]   Sideman S, Moalem-Maron D. 1982. Direct contact condensation. Advances in Heat Transfer, 15:227-281.
[26]   Xu L, Chen Y P, Wu P H, et al. 2020. Humidification-dehumidification (HDH) desalination system with air-cooling condenser and cellulose evaporative pad. Water, 12(142):1-14.
[27]   Zamen M, Amidpour M, Firoozjaei M R. 2013. A novel integrated system for fresh water production in greenhouse: Dynamic simulation. Desalination, 322:52-59.
doi: 10.1016/j.desal.2013.04.024
[28]   Zurigat Y H, Aldoss T, Dawoud B, et al. 2008. Greenhouse-State of the art review and performance evaluation of dehumidifier. In: Middle East Desalination Research Center Series of Research and Development Reports. MEDRC Project: 03-AS-003. Muscat: The Middle East Desalination Research Center Muscat Sultanate of Oman. https://www.medrc.org/wp-content/uploads/2020/04/03-AS-003.pdf.
No related articles found!