| Research article |
|

|
|
|
| Drought trend analysis in a semi-arid area of Iraq based on Normalized Difference Vegetation Index, Normalized Difference Water Index and Standardized Precipitation Index |
Ayad M F AL-QURAISHI1,*( ), Heman A GAZNAYEE2, Mattia CRESPI3,4 ), Heman A GAZNAYEE2, Mattia CRESPI3,4 |
1Department of Surveying and Geomatics Engineering, Faculty of Engineering, Tishk International University, Erbil 44001, Iraq
2Department of Forestry, College of Agricultural Engineering Sciences, Salahaddin University, Erbil 44002, Iraq
3Geodesy and Geomatics Division, Department of Civil, Constructional and Environmental Engineering, Sapienza University of Rome, Rome 00185, Italy
4Sapienza School for Advanced Studies, Sapienza University of Rome, Rome 00185, Italy |
|
|
|
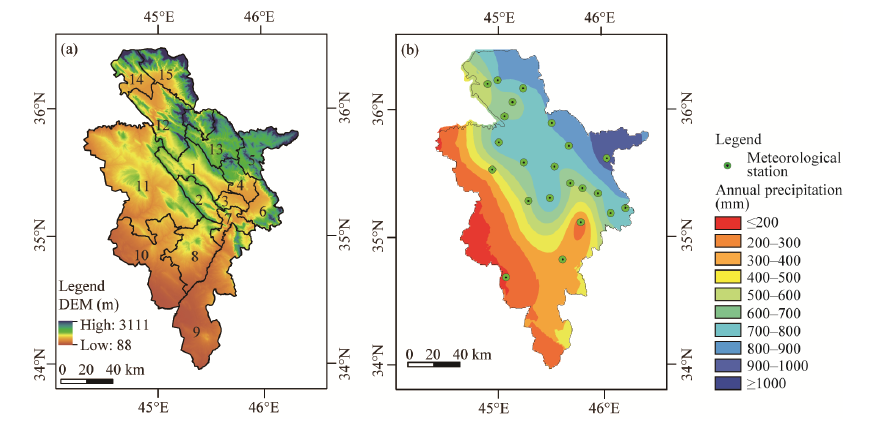
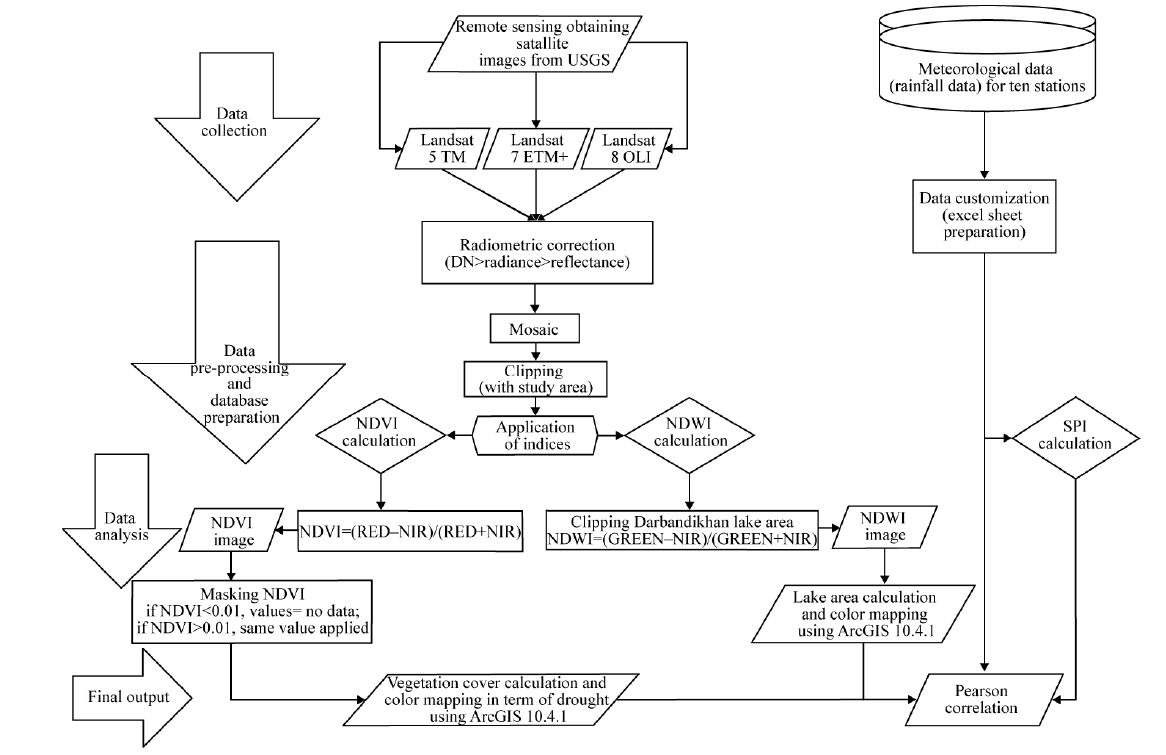
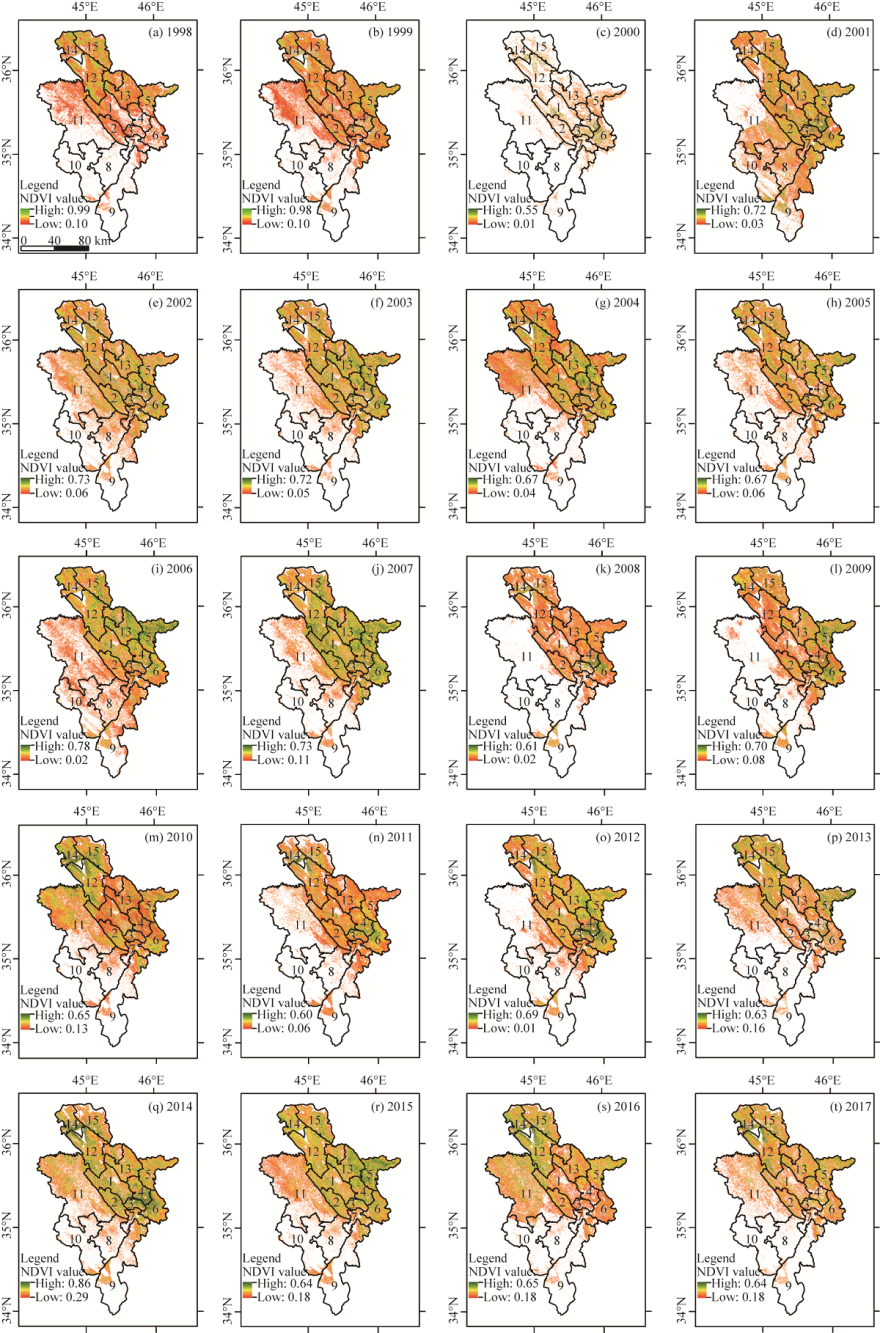
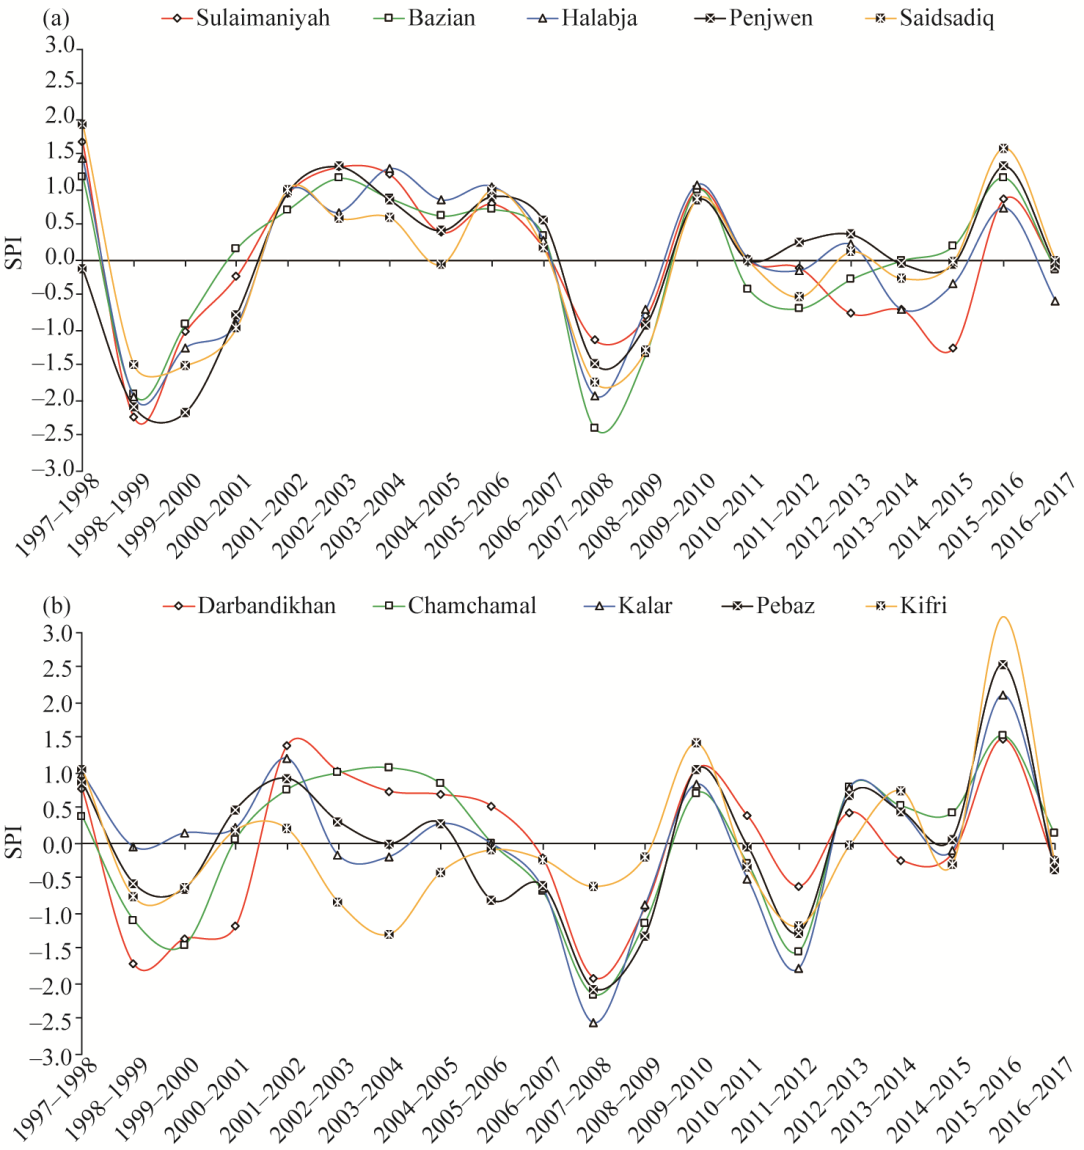
Abstract Drought was a severe recurring phenomenon in Iraq over the past two decades due to climate change despite the fact that Iraq has been one of the most water-rich countries in the Middle East in the past. The Iraqi Kurdistan Region (IKR) is located in the north of Iraq, which has also suffered from extreme drought. In this study, the drought severity status in Sulaimaniyah Province, one of four provinces of the IKR, was investigated for the years from 1998 to 2017. Thus, Landsat time series dataset, including 40 images, were downloaded and used in this study. The Normalized Difference Vegetation Index (NDVI) and the Normalized Difference Water Index (NDWI) were utilized as spectral-based drought indices and the Standardized Precipitation Index (SPI) was employed as a meteorological-based drought index, to assess the drought severity and analyse the changes of vegetative cover and water bodies. The study area experienced precipitation deficiency and severe drought in 1999, 2000, 2008, 2009, and 2012. Study findings also revealed a drop in the vegetative cover by 33.3% in the year 2000. Furthermore, the most significant shrinkage in water bodies was observed in the Lake Darbandikhan (LDK), which lost 40.5% of its total surface area in 2009. The statistical analyses revealed that precipitation was significantly positively correlated with the SPI and the surface area of the LDK (correlation coefficients of 0.92 and 0.72, respectively). The relationship between SPI and NDVI-based vegetation cover was positive but not significant. Low precipitation did not always correspond to vegetative drought; the delay of the effect of precipitation on NDVI was one year.
|
|
Received: 22 March 2020
Published: 10 April 2021
|
|
Corresponding Authors:
|
About author: * Ayad M F AL-QURAISHI (E-mail: ayad.alquraishi@gmail.com; ayad.alquraishi@tiu.edu.iq)
|
|
|
| [1] |
Aadhar S, Mishra V. 2017. High-resolution near real-time drought monitoring in South Asia. Scientific Data, 4:170145, doi: 10.1038/sdata.2017.145.
doi: 10.1038/sdata.2017.145
|
|
|
| [2] |
Acharya T, Ray A K. 2007. Image Processing: Principles and Applications. Hoboken: John Wiley & Sons, Inc., 1-4.
|
|
|
| [3] |
Al-Kanani Y. 2016. Monitoring and calculating the surface area of lakes in northern Iraq using satellite images. Applied Research Journal, 2(2):54-62.
|
|
|
| [4] |
Al-Quraishi A M F, Sadiq H A, Messina J P. 2019. Characterization and modeling surface soil physicochemical properties using Landsat images: A case study in the Iraqi Kurdistan region. In: Stilla U, Hoegner L, Xu Y. The International Archives of the Photogrammetry, Remote Sensing and Spatial Information Sciences. Munich: International Society of Photogrammetry and Remote Sensing, 21-28.
|
|
|
| [5] |
Al-Quraishi A M F, Negm A M. 2020. Environmental Remote Sensing and GIS in Iraq. Heidelberg: Springer International Publishing, 205-223.
|
|
|
| [6] |
Al-Quraishi A M F, Qader S H, Wu W. 2020. Drought monitoring using spectral and meteorological based indices combination: A case study in Sulaimaniyah, Kurdistan region of Iraq. In: Al-Quraishi A M F, Negm A M. Environmental Remote Sensing and GIS in Iraq. Heidelberg: Springer International Publishing, 377-393.
|
|
|
| [7] |
Almamalachy Y S, Al-Quraishi A M F, Moradkhani H. 2020. Agricultural drought monitoring over Iraq utilizing MODIS products. In: Al-Quraishi A M F, Negm A M. Environmental Remote Sensing and GIS in Iraq. Heidelberg: Springer International Publishing, 253-278.
|
|
|
| [8] |
Alobaidy A H M J Abid H S, Maulood B K. 2010. Application of water quality index for assessment of Dokan Lake ecosystem, Kurdistan region, Iraq. Journal of Water Resource and Protection, 2:792-798.
|
|
|
| [9] |
Awchi T A, Jasim A I. 2017. Rainfall data analysis and study of meteorological drought in Iraq for the period 1970-2010. Tikrit Journal of Engineering Sciences, 24(1):110-121.
|
|
|
| [10] |
Bhuiyan C, Singh R P, Kogan F N. 2006. Monitoring drought dynamics in the Aravalli region (India) using different indices based on ground and remote sensing data. International Journal of Applied Earth Observation and Geoinformation, 8(4):289-302.
|
|
|
| [11] |
Camastra F. 2007. Image Processing: Principles and Applications [book review]. In: IEEE Transactions on Neural Networks, 18(2):610, doi: 10.1109/TNN.2007.893088.
doi: 10.1109/TNN.2007.893088
|
|
|
| [12] |
Edossa D C, Babel M S, Gupta A D. 2010. Drought analysis in the Awash River Basin, Ethiopia. Water Resources Management, 24: 1441-1460.
|
|
|
| [13] |
Fadhil A M. 2011. Drought mapping using geoinformation technology for some sites in the Iraqi Kurdistan region. International Journal of Digital Earth, 4(3):239-257.
|
|
|
| [14] |
Fadhil A M. 2013. Sand dunes monitoring using remote sensing and GIS techniques for some sites in Iraq. In: Tan H H. Proceedings Volume 8762 PIAGENG 2013: Intelligent Information, Control, and Communication Technology for Agricultural Engineering. Sanya: The International Society for Optical Engineering, 876206, doi: 10.1117/12.2019735.
doi: 10.1117/12.2019735
|
|
|
| [15] |
Gaznayee H A A, Al-Quraishi A M F. 2019a. Analysis of agricultural drought's severity and impacts in Erbil Province, the Iraqi Kurdistan region based on time series NDVI and TCI indices for 1998 through 2017. Journal of Advanced Research in Dynamical and Control Systems, 11(11):287-297.
|
|
|
| [16] |
Gaznayee H A A, Al-Quraishi A M F. 2019b. Analysis of agricultural drought, rainfall, and crop yield relationships in Erbil Province, the Kurdistan region of Iraq based on Landsat time-series MSAVI2. Journal of Advanced Research in Dynamical and Control Systems, 11(12):536-545.
|
|
|
| [17] |
Gaznayee H A A, Al-Quraishi A M F. 2020. Identifying drought status in Duhok Governorate (Iraqi Kurdistan region) from 1998 through 2012 using Landsat time series dataset. Journal of Applied Science and Technology Trends, 1(1):17-23.
|
|
|
| [18] |
Ghebrezgabher M G, Yang T B, Yang X M, et al. 2019. Assessment of desertification in Eritrea: land degradation based on Landsat images. Journal of Arid Land, 11(3):319-331.
|
|
|
| [19] |
Guttman N B. 1999. Accepting the standardized precipitation index: A calculation algorithm. Journal of the American Water Resources Association, 35(2):311-322.
|
|
|
| [20] |
Hazaymeh K, Hassan Q K. 2017. A remote sensing-based agricultural drought indicator and its implementation over a semi-arid region, Jordan. Journal of Arid Land, 9(3):319-330.
|
|
|
| [21] |
Huang X, Lu Q K, Zhang L P. 2014. A multi-index learning approach for classification of high-resolution remotely sensed images over urban areas. ISPRS Journal of Photogrammetry and Remote Sensing, 90:36-48.
|
|
|
| [22] |
Ji L, Peters A J. 2003. Assessing vegetation response to drought in the northern Great Plains using vegetation and drought indices. Remote Sensing of Environment, 87(1):85-98.
|
|
|
| [23] |
Kamali B, Kouchi D H, Yang H, et al. 2017. Multilevel drought hazard assessment under climate change scenarios in semi-arid regions—A case study of the Karkheh River Basin in Iran. Water, 9(4):241, doi: 10.3390/w9040241.
doi: 10.3390/w9040241
|
|
|
| [24] |
Karthe D, Chalov S, Kasimov N, et al. 2015. Water and Environment in the Selenga-Baikal Basin: International Research Cooperation for an Ecoregion of Global Relevance. Stuttgart: Ibidem Press, 19-22.
|
|
|
| [25] |
Li R, Tsunekawa A, Tsubo M. 2014. Index-based assessment of agricultural drought in a semi-arid region of Inner Mongolia, China. Journal of Arid Land, 6(1):3-15.
|
|
|
| [26] |
Loucks D P, van Beek E. 2017. Water Resource Systems Planning and Management: An Introduction to Methods, Models, and Applications. Herdelberg: Springer International Publishing, 77-89.
|
|
|
| [27] |
McFeeters S K. 1996. The use of the Normalized Difference Water Index (NDWI) in the delineation of open water features. International Journal of Remote Sensing, 17(7):1425-1432.
|
|
|
| [28] |
McKee T B, Doesken N J, Kleist J. 1993. The relationship of drought frequency and duration to time scales. In: Proceedings of the 8th Conference on Applied Climatology. Anaheim, USA.
|
|
|
| [29] |
Mustafa Y T. 2020. Spatiotemporal analysis of vegetation cover in Kurdistan region-Iraq using MODIS image data. Journal of Applied Science and Technology Trends, 1(1):1-7.
|
|
|
| [30] |
Nalbantis I, Tsakiris G. 2009. Assessment of hydrological drought revisited. Water Resources Management, 23:881-897.
|
|
|
| [31] |
Perez G J, Macapagal M, Olivares R, et al. 2016. Forecasting and monitoring agricultural drought in the Philippines. In: Halounova L, Šafář V, Raju P L N, et al. International Archives of the Photogrammetry, Remote Sensing and Spatial Information Sciences. Prague: International Society for Photogrammetry and Remote Sensing, 1263-1269.
|
|
|
| [32] |
Rossi G, Vega T, Bonaccorso B. 2007. Methods and Tools for Drought Analysis and Management. Dordrecht: Springer International Publishing, 46-48.
|
|
|
| [33] |
Rouse J W, Haas R H, Schell J A, et al. 1974. Monitoring vegetation systems in the Great Plains with ERTS. In: Freden S C, Mercanti E P, Becker M A. The 3rd ERTS (Earth Resources Technology Statellite)-1 Symposium Volume I: Technical Presentations. NASA SP-351. Washington D.C.: National Aeronautics and Space Administration, 309-317.
|
|
|
| [34] |
Sharma A. 2006. Spatial data mining for drought monitoring: An approach using temporal NDVI and rainfall spatial data mining for drought monitoring: An approach using temporal NDVI and rainfall relationship. MSc Thesis. Enschede: University of Twente.
|
|
|
| [35] |
Sheffield J, Wood E F. 2008. Global trends and variability in soil moisture and drought characteristics, 1950-2000, from observation-driven simulations of the terrestrial hydrologic cycle. Journal of Climate, 21:432-458.
|
|
|
| [36] |
Smakhtin V U, Hughes D A. 2004. Review, automated estimation and analyses of drought indices in South Asia. Working Paper 83. Colombo: International Water Management Institute.
|
|
|
| [37] |
Street M A. 2012. Capacity Assessment for Drought Risk Management in Iraq. Interdisciplinary Research Consultants. Amman, Jordan.
|
|
|
| [38] |
Sun Q Q, Tan J J, Xu Y H. 2010. An ERDAS image processing method for retrieving LST and describing urban heat evolution: A case study in the Pearl River Delta region in South China. Environmental Earth Sciences, 59:1047-1055.
|
|
|
| [39] |
Tigkas D, Vangelis H, Tsakiris G. 2013. The drought indices calculator (DrinC). In: Maia R, de Brito A G, Teixeira A S, et al. Proceedings of the 8th International Conference of EWRA ''Water Resources Management in an Interdisciplinary and Changing Context''. Porto: European Water Resources Association, 1333-1342.
|
|
|
| [40] |
Tsakiris G, Loukas A, Pangalou D, et al. 2007. Drought characterization [Part 1. Components of drought planning. 1.3. Methodological component]. In: Iglesias A, Moneo M, López-Francos A. Drought Management Guidelines Technical Annex, Zaragoza: CIHEAM/EC MEDA Water, 85-102.
|
|
|
| [41] |
UNESCO (United Nations Educational, Scientific and Cultural Organization). 2014. Integrated drought risk management-DRM national framework for Iraq. [2020-01-12]. http://www.unesco.org/.
|
|
|
| [42] |
Wang Q, Watanabe M, Hayashi S, et al. 2003. Using NOAA AVHRR data to assess flood damage in China. Environmental Monitoring and Assessment, 82: 119-148.
|
|
|
| [43] |
Yang L, Cao Y G, Zhu X H, et al. 2014. Land surface temperature retrieval for arid regions based on Landsat-8 TIRS data: a case study in Shihezi, Northwest China. Journal of Arid Land, 6(6):704-716.
|
|
|
| [44] |
Yaseen A K, Mahmood M I, Yaseen G K, et al. 2018. Area change monitoring of Dokan & Darbandikhan Iraqi lakes using satellite data. Sustainable Resources Management Journal, 3(2):25-41.
|
|
|
| [45] |
Yu W, Li Y, Cao Y, et al. 2019. Drought assessment using GRACE terrestrial water storage deficit in Mongolia from 2002 to 2017. Water, 11(6):1301, doi: 10.3390/w11061301.
doi: 10.3390/w11061301
|
|
|
| [46] |
Zhang F, Tiyip T, Ding J L, et al. 2013. Vegetation fractional coverage change in a typical oasis region in Tarim River Watershed based on remote sensing. Journal of Arid Land, 5(1):89-101.
|
|
|
|
Viewed |
|
|
|
Full text
|
|
|
|
|
Abstract
|
|
|
|
|
Cited |
|
|
|
|
| |
Shared |
|
|
|
|
| |
Discussed |
|
|
|
|