| Research article |
|


|
|
|
| Large scale sand saltation over hard surface: a controlled experiment in still air |
LIU Benli1,2,*( ), WANG Zhaoyun1,3, NIU Baicheng4, QU Jianjun1,2 ), WANG Zhaoyun1,3, NIU Baicheng4, QU Jianjun1,2 |
1Key Laboratory of Desert and Desertification, Northwest Institute of Eco-Environment and Resources, Chinese Academy of Sciences, Lanzhou 730000, China
2Research Station of Gobi Desert Ecology and Environment in Dunhuang of Gansu Province, Lanzhou 730000, China
3University of Chinese Academy of Sciences, Beijing 100049, China
4Qinghai Normal University, Xining 810004, China |
|
|
|
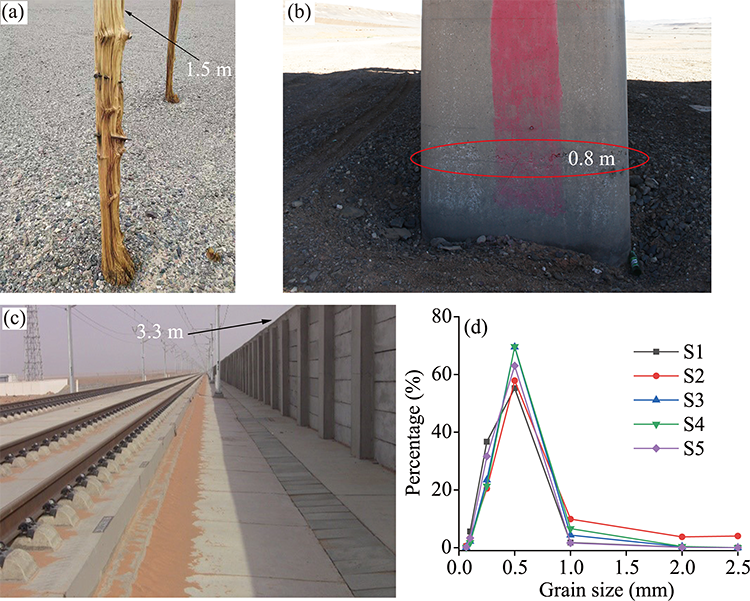
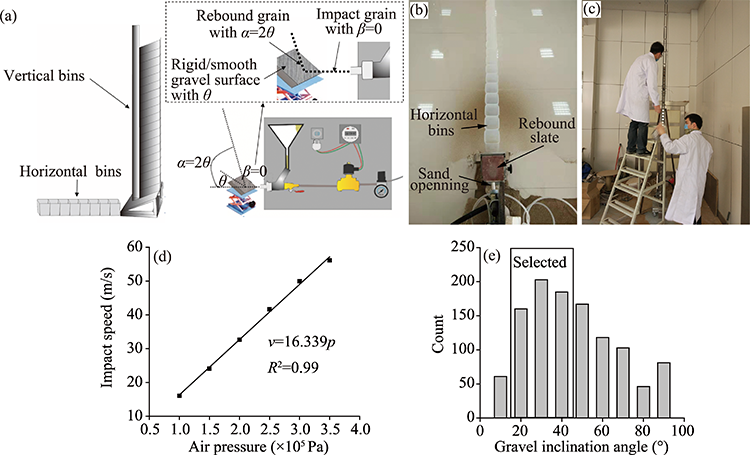
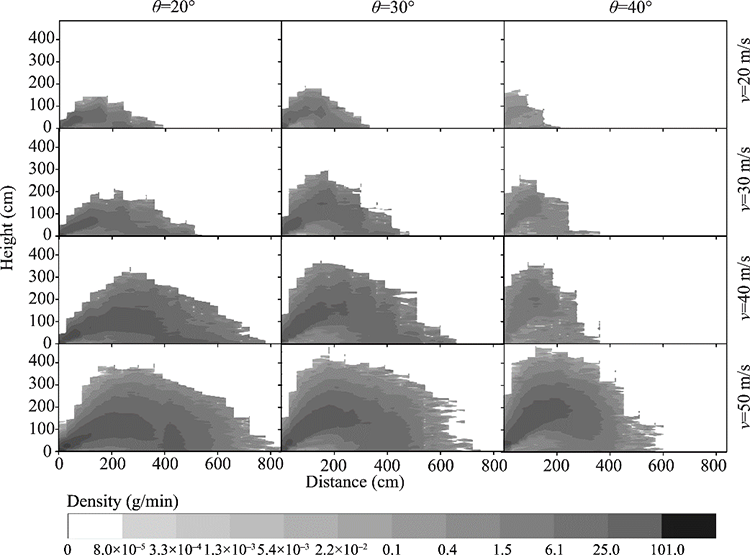
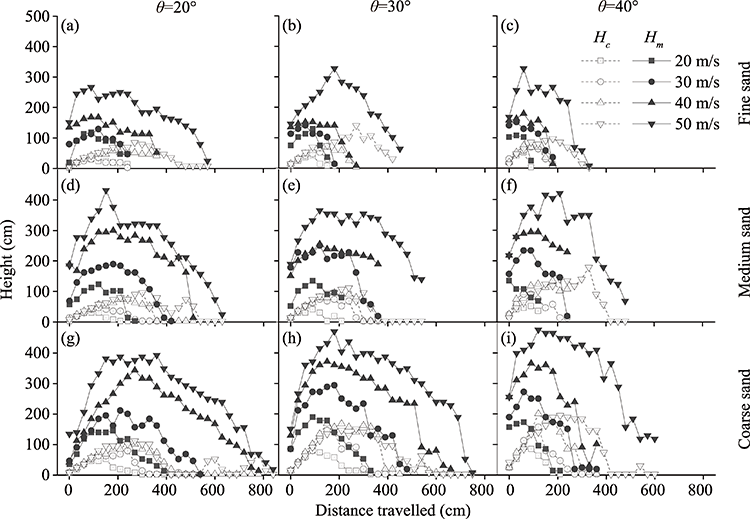
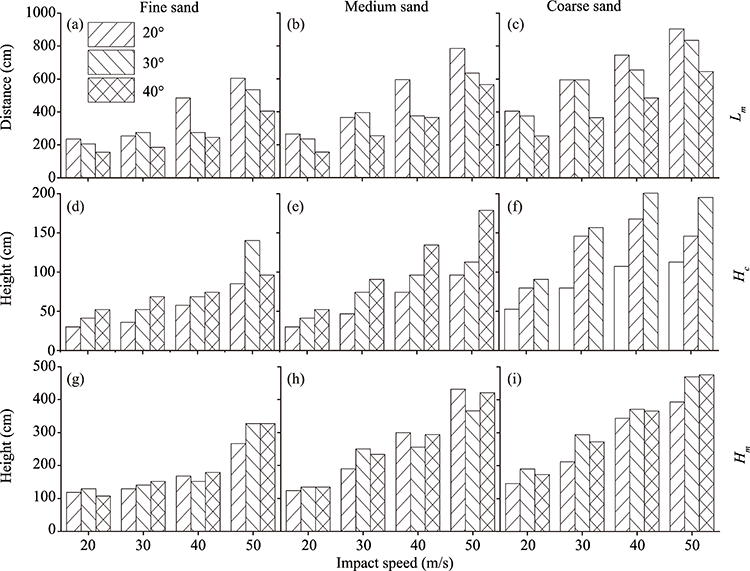
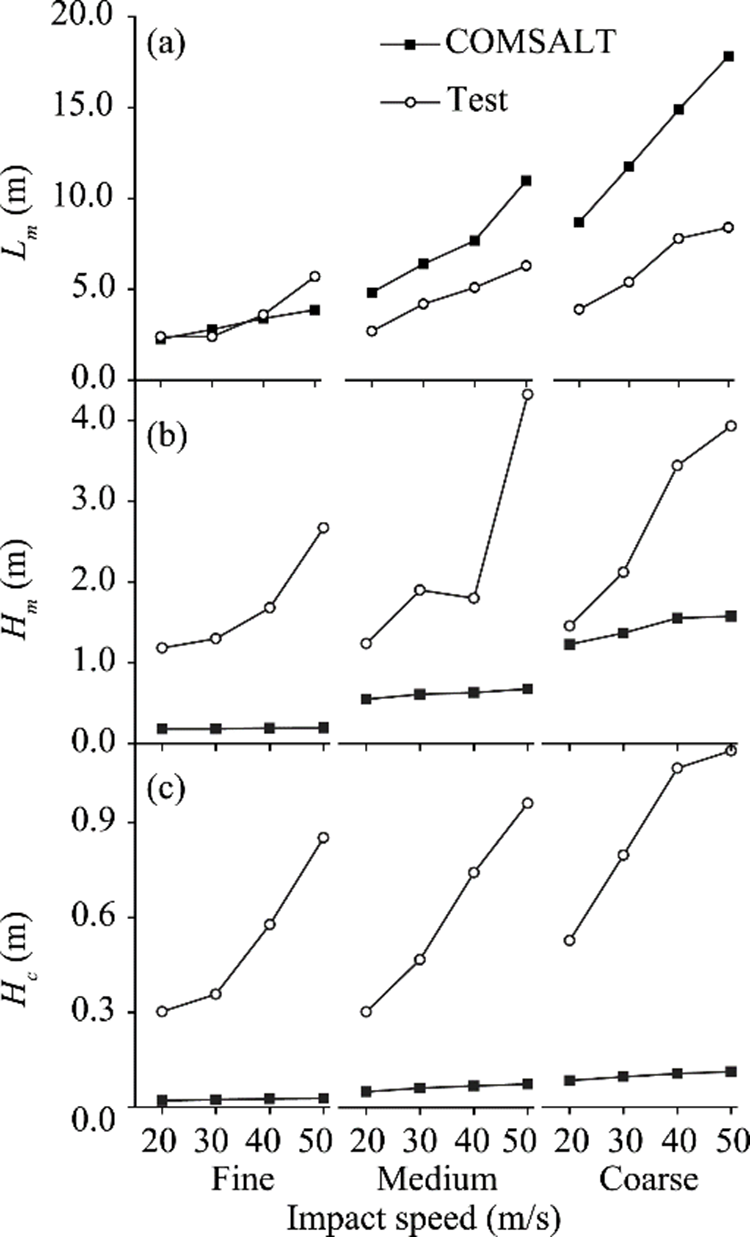
Abstract Saltation is the major particle movement type in wind erosion process. Saltating sand grains can rebound up to tens of times larger in length and height over hard surface (such as gravel surface) than over loose sand surface. Gravels usually have different faces, causing distinct response of the impacting grains, but the effects of the grain and gravel-surface contact angle on grain rebound are not yet well quantified. We performed full-range controlled experiments of grain saltation using different contact angles, grain sizes and impact speeds in still air, to show that contact angle increases the height of representative saltation path but decreases particle travel length. The results were compared with outputs from the COMprehensive numerical model of SALTation (COMSALT). Large saltation height of 4.8 m and length of 9.0 m were recorded. The maximum and representative saltation height over the gravel surface were found to be about 4.9 times and 12.8 times those over the loose sandy surface, respectively. The maximum saltation length may be reduced by 58% and the representative saltation height may be increased by 77% as contact angle increases from 20° to 40°. We further showed that the collision inertia contributes 60% of the saltation length, and wind contributes to the other 40%. These quantitative findings have important implications for modeling saltation trajectory over gravel surface.
|
|
Received: 14 March 2021
Published: 10 June 2021
|
|
Corresponding Authors:
|
About author: LIU Benli (E-mail: liubenli@lzb.ac.cn)
|
|
|
| [1] |
Ammi M, Oger L, Beladjine D, et al. 2009. Three-dimensional analysis of the collision process of a bead on a granular packing. Physical Review, E79:021305, doi: 10.1103/PhysRevE.79.021305.
doi: 10.1103/PhysRevE.79.021305
|
|
|
| [2] |
Ayoub F, Avouac J P, Newman C E, et al. 2014. Threshold for sand mobility on Mars calibrated from seasonal variations of sand flux. Nature Communications, 5(1):5096, doi: 10.1038/ncomms6096.
doi: 10.1038/ncomms6096
|
|
|
| [3] |
Bagnold R A. 1941. The Physics of Blown Sand and Desert Dunes. London: Chapman & Hall, 72.
|
|
|
| [4] |
Bagnold R A. 1973. The nature of saltation and of 'bed-load' transport in water. Proceedings of the Royal Society of London. Mathematical and Physical Sciences, 332:473-504.
|
|
|
| [5] |
Burr D M, Bridges N T, Marshall J R, et al. 2015. Higher-than-predicted saltation threshold wind speeds on Titan. Nature, 517:60-63.
doi: 10.1038/nature14088
|
|
|
| [6] |
Cheng J, Lei J, Li S, et al. 2016. Disturbance of the inclined inserting-type sand fence to wind-sand flow fields and its sand control characteristics. Aeolian Research, 21:139-150.
doi: 10.1016/j.aeolia.2016.04.008
|
|
|
| [7] |
Dong Z, Liu X P, Wang X M. 2002a. Aerodynamic roughness of gravel surfaces. Geomorphology, 43(1-2):17-31.
doi: 10.1016/S0169-555X(01)00097-6
|
|
|
| [8] |
Dong Z, Wang H T, Liu X P, et al. 2002b. Velocity profile of a sand cloud blowing over a gravel surface. Geomorphology, 45(3-4):277-289.
doi: 10.1016/S0169-555X(01)00159-3
|
|
|
| [9] |
Dong Z, Qian G Q. 2007. Characterizing the height profile of the flux of wind-eroded sediment. Environmental Geology, 51:835-845.
doi: 10.1007/s00254-006-0363-5
|
|
|
| [10] |
Hagen L J, van Pelt S, Sharratt B. 2010. Estimating the saltation and suspension components from field wind erosion. Aeolian Research, 1(3-4):147-153.
doi: 10.1016/j.aeolia.2009.08.002
|
|
|
| [11] |
Ho T D, Valance A, Dupont P, et al. 2011. Scaling laws in aeolian sand transport. Physical Review Letters, 106(9):094501, doi: 10.1103/PhysRevLett.106.094501.
doi: 10.1103/PhysRevLett.106.094501
|
|
|
| [12] |
Ho T D, Valance A, Dupont P, et al. 2014. Aeolian sand transport: Length and height distributions of saltation trajectories. Aeolian Research, 12:65-74.
doi: 10.1016/j.aeolia.2013.11.004
|
|
|
| [13] |
Jiang C, Dong Z, Wang X. 2017. An improved particle tracking velocimetry (PTV) technique to evaluate the velocity field of saltating particles. Journal of Arid Land, 9(5):727-742.
doi: 10.1007/s40333-017-0030-6
|
|
|
| [14] |
Kok J F, Renno N O. 2009. A comprehensive numerical model of steady state saltation (COMSALT). Journal of Geophysical Research-Atmospheres, 114(17), doi: 10.1029/2009jd011702.
doi: 10.1029/2009jd011702
|
|
|
| [15] |
Lämmel M, Kroy K. 2017. Analytical mesoscale modeling of aeolian sand transport. Physical Review, E96:052906, doi: 10.1103/PhysRevE.96.052906.
doi: 10.1103/PhysRevE.96.052906
|
|
|
| [16] |
Li S, Li C, Yao D, et al. 2020. Wind tunnel experiments for dynamic modeling and analysis of motion trajectories of wind-blown sands. The European Physical Journal, E43:22, doi: 10.1140/epje/i2020-11945-0.
doi: 10.1140/epje/i2020-11945-0
|
|
|
| [17] |
Ling Y, Wu Z. 1980. Experimention on the dynamic photography of the movement of sand-driving wind. Acta Geographica Sinica, 35:174-181. (in Chinese)
|
|
|
| [18] |
Lorenz R D, Zimbelman J R. 2014. Mechanics of sand transport. In: Lorenz R D, Zimbelman J R. Dune Worlds How Windblown Sand Shapes Planetary Landscapes. Berlin: Springer, 39-54.
|
|
|
| [19] |
Pähtz T, Omeradžić A, Carneiro M V, et al. 2015. Discrete Element Method simulations of the saturation of aeolian sand transport. Physics, 42(6):2063-2070.
|
|
|
| [20] |
Reichardt H. 1941. About a new theory of free turbulence. Journal of Applied Mathematics & Mechanics, 21:257-264. (in German)
|
|
|
| [21] |
Shao Y, Raupach M R, Findlater P A. 1993. Effect of saltation bombardment on the entrainment of dust by wind. Journal of Geophysical Research: Atmospheres, 98(7):12719-12726.
doi: 10.1029/93JD00396
|
|
|
| [22] |
Tan L, An Z, Zhang K, et al. 2020. Intermittent aeolian saltation over a gobi surface: threshold, saltation layer height, and high-frequency variability. Journal of Geophysical Research: Earth Surface, 125(1):e2019JF005329, doi: 10.1029/2019jf005329.
doi: 10.1029/2019jf005329
|
|
|
| [23] |
Williams S H, Leer J A. 1995. Aeolian saltation transport rate: an example of the effect of sediment supply. Journal of Arid Environments, 30(2):153-160.
doi: 10.1016/S0140-1963(05)80066-7
|
|
|
| [24] |
Yin Y. 1989. Study on sand drift in strong wind region in gravel desert. Journal of Desert Research, 9:27-36. (in Chinese)
|
|
|
| [25] |
Zhang K C, Qu J J, Zu R P, et al. 2008. Characteristics of wind-blown sand on Gobi/mobile sand surface. Environmental Geology, 54:411-416.
doi: 10.1007/s00254-007-0827-2
|
|
|
| [26] |
Zheng X, He L, Wu J. 2004. Vertical profiles of mass flux for windblown sand movement at steady state. Journal of Geophysical Research: Solid Earth, 109(1), doi: 10.1029/2003jb002656.
doi: 10.1029/2003jb002656
|
|
|
| [27] |
Zou X, Hao Q, Zhang C, et al. 1999. Parameter analysis on the saltation trajectory of wind blown sand. Chinese Science Bulletin, 44:1084-1088. (in Chinese)
|
|
|
| [28] |
Zou X, Cheng H, Zhang C, et al. 2007. Effects of the Magnus and Saffman forces on the saltation trajectories of sand grain. Geomorphology, 90(1-2):11-22.
doi: 10.1016/j.geomorph.2007.01.006
|
|
|
|
Viewed |
|
|
|
Full text
|
|
|
|
|
Abstract
|
|
|
|
|
Cited |
|
|
|
|
| |
Shared |
|
|
|
|
| |
Discussed |
|
|
|
|