| Geography, geology and natural resources in Central Asia (Guest Editorial Board Member:Prof. Dr. XIAO Wenjiao) |
|

|
|
|
| Estimation of rock Fe content based on hyperspectral indices |
WANG Jinlin1,2,3,4, WANG Wei1,2,3,4,*( ), CHENG Yinyi1,2,3,4, ZHANG Zhixin1,2,3,4, WANG Shanshan1,2,3,4, ZHOU Kefa1,2,3,4, LI Pingheng5 ), CHENG Yinyi1,2,3,4, ZHANG Zhixin1,2,3,4, WANG Shanshan1,2,3,4, ZHOU Kefa1,2,3,4, LI Pingheng5 |
1State Key Laboratory of Desert and Oasis Ecology, Xinjiang Institute of Ecology and Geography, Chinese Academy of Sciences, Urumqi 830011, China
2Xinjiang Key Laboratory of Mineral Resources and Digital Geology, Urumqi 830011, China
3Xinjiang Research Centre for Mineral Resources, Chinese Academy of Sciences, Urumqi 830011, China
4University of Chinese Academy of Sciences, Beijing 100049, China
5Zhejiang A & F University, Hangzhou 311300, China |
|
|
|
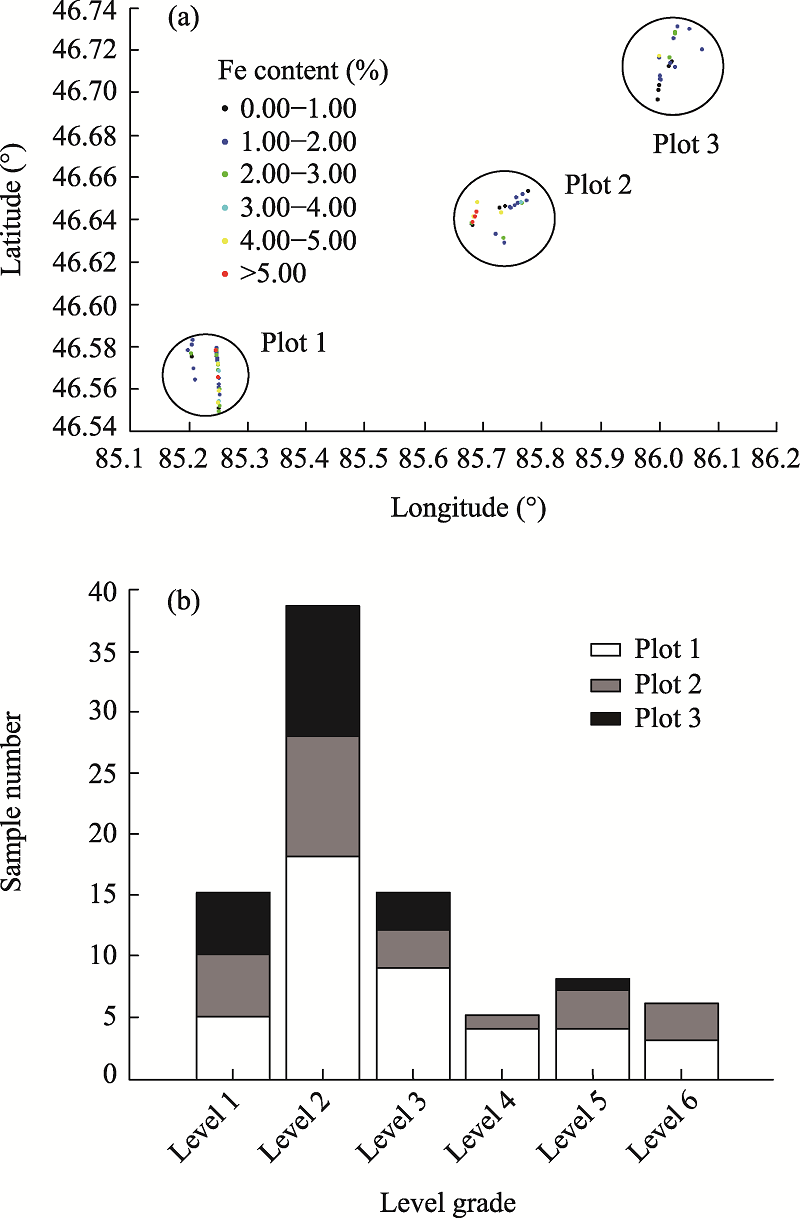
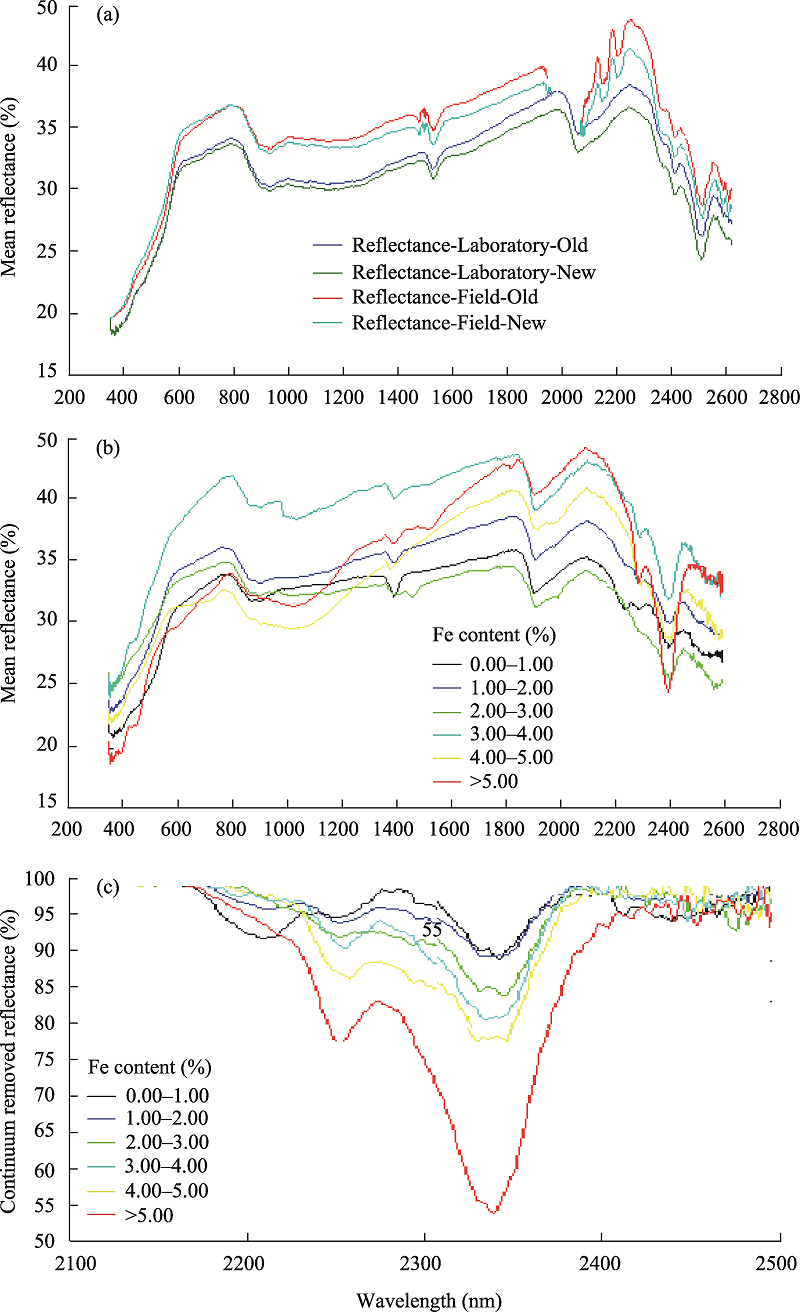
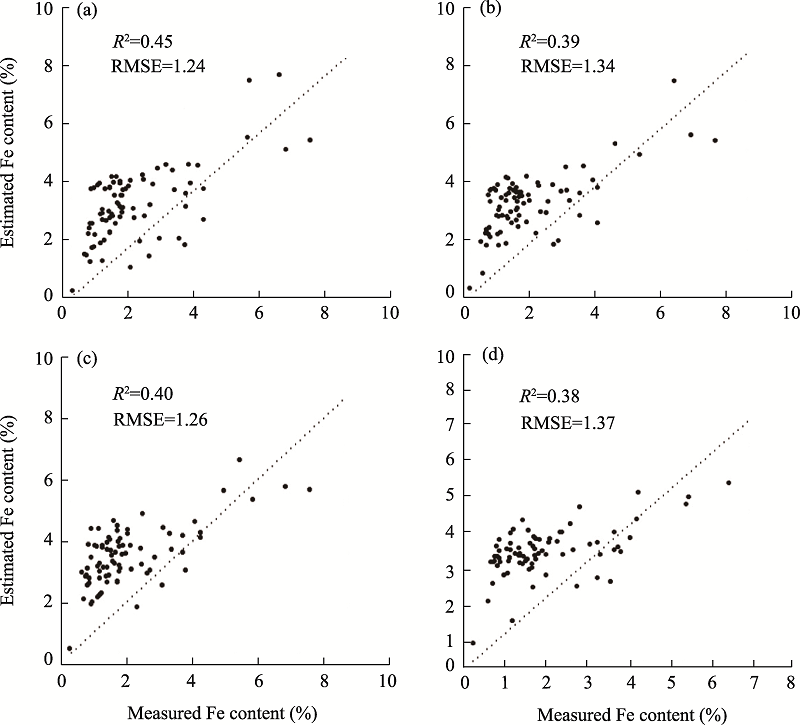
Abstract Information on the Fe content of bare rocks is needed for implementing geochemical processes and identifying mines. However, the influence of Fe content on the spectra of bare rocks has not been thoroughly analyzed in previous studies. The Saur Mountain region within the Hoboksar of the Russell Hill depression was selected as the study area. Specifically, we analyzed six hyperspectral indices related to rock Fe content based on laboratory measurements (Dataset I) and field measurements (Dataset II). In situ field measurements were acquired to verify the laboratory measurements. Fe content of the rock samples collected from different fresh and weathered rock surfaces were divided into six levels to reveal the spatial distributions of Fe content of these samples. In addition, we clearly displayed wavelengths with obvious characteristics by analyzing the spectra of these samples. The results of this work indicated that Fe content estimation models based on the fresh rock surface measurements in the laboratory can be applied to in situ field or satellite-based measurements of Fe content of the weathered rock surfaces. It is not the best way to use only the single wavelengths reflectance at all absorption wavelengths or the depth of these absorption features to estimate Fe content. Based on sample data analysis, the comparison with other indices revealed that the performance of the modified normalized difference index is the best indicator for estimating rock Fe content, with R2 values of 0.45 and 0.40 corresponding to datasets I and II, respectively. Hence, the modified normalized difference index (the wavelengths of 2220, 2290, and 2370 nm) identified in this study could contribute considerably to improve the identification accuracy of rock Fe content in the bare rock areas. The method proposed in this study can obviously provide an efficient solution for large-scale rock Fe content measurements in the field.
|
|
Received: 30 October 2020
Published: 31 December 2021
|
|
Corresponding Authors:
*WANG Wei (wangw1114@ms.xjb.ac.cn)
|
|
|
| [1] |
Baugh W M, Kruse F A, Atkinson Jr W W. 1998. Quantitative geochemical mapping of ammonium minerals in the southern Cedar Mountains, Nevada, using the Airborne Visible/Infrared Imaging Spectrometer (AVIRIS). Remote Sensing of Environment, 65(3): 292-308.
doi: 10.1016/S0034-4257(98)00039-X
|
|
|
| [2] |
Chabrillat S, Goetz A F H, Krosley L, et al. 2002. Use of hyperspectral images in the identification and mapping of expansive clay soils and the role of spatial resolution. Remote Sensing of Environment, 82(2-3): 431-445.
doi: 10.1016/S0034-4257(02)00060-3
|
|
|
| [3] |
Clark R N, Roush T L. 1984. Reflectance spectroscopy: Quantitative analysis techniques for remote sensing applications. Journal of Geophysical Research, 89(B7): 6329-6340.
doi: 10.1029/JB089iB07p06329
|
|
|
| [4] |
Clark R N, Gregg A, Swayze K, et al. 2003. Imaging spectroscopy: Earth and planetary remote sensing with the USGS Tetracorder and expert systems. Journal of Geophysical Resources, 108(E12): 5131-5144.
|
|
|
| [5] |
Clénet H, Pinet P, Daydou Y, et al. 2011. A new systematic approach using the Modified Gaussian Model: Insight for the characterization of chemical composition of olivines, pyroxenes and olivine-pyroxene mixtures. Icarus, 213(1): 404-422.
doi: 10.1016/j.icarus.2011.03.002
|
|
|
| [6] |
Galvao L S, Formaggio A R, Couto E G, et al. 2008. Relationships between the mineralogical and chemical composition of tropical soils and topography from hyperspectral remote sensing data. ISPRS Journal of Photogrammetry and Remote Sensing, 63(2): 259-271.
doi: 10.1016/j.isprsjprs.2007.09.006
|
|
|
| [7] |
Gasmi A, Gomez C, Lagacherie P, et al. 2018. Surface soil clay content mapping at large scales using multispectral (VNIR-SWIR) ASTER data. International Journal of Remote Sensing, 40(4): 1506-1533.
doi: 10.1080/01431161.2018.1528018
|
|
|
| [8] |
Hao L, Zhang Z, Yang X. 2019. Mine tailing extraction indexes and model using remote-sensing images in southeast Hubei Province. Environmental Earth Sciences, 78: 493, doi: 10.1007/s12665-019-8439-1.
doi: 10.1007/s12665-019-8439-1
|
|
|
| [9] |
Jia X Y, O'Connor D, Shi Z, et al. 2021. VIRS based detection in combination with machine learning for mapping soil pollution. Environmental Pollution, 268: 115845, doi: 10.1016/j.envpol.2020.115845.
doi: 10.1016/j.envpol.2020.115845
|
|
|
| [10] |
Le Maire G, Francois C, Dufrene E. 2004. Towards universal broad leaf chlorophyll indices using PROSPECT simulated database and hyperspectral reflectance measurements. Remote Sensing of Environment, 89(1): 1-28.
|
|
|
| [11] |
Le Maire G, François C, Soudani K, et al. 2008. Calibration and validation of hyperspectral indices for the estimation of broadleaved forest leaf chlorophyll content, leaf mass per area, leaf area index and leaf canopy biomass. Remote Sensing of Environment, 112(10): 3846-3864.
doi: 10.1016/j.rse.2008.06.005
|
|
|
| [12] |
Li H, Lin Q Z, Liu Q J, et al. 2009. Feasibility research on estimating geochemistry element abnormity based on reflectance spectrum of gold deposit in Hatu-Baogutu. Remote Sensing Applications, 8: 43-49.
|
|
|
| [13] |
Liu B, Jin H, Sun Z, et al. 2016. Geochemical weathering of aeolian sand and its palaeoclimatic implications in the Mu Us Desert, northern China, since the Late Holocene. Journal of Arid Land, 8(5): 647-659.
doi: 10.1007/s40333-016-0014-y
|
|
|
| [14] |
Liu M, Lin Q Z, Wang Q J, et al. 2010. Study on the geochemical anomaly of copper element based on reflectance spectra. Spectroscopy and Spectral Analysis, 5: 1320-1323.
|
|
|
| [15] |
Liu Y, Vekerdy Z. 2003. Possibilities of assessing heavy metal contamination of soil in the Sajo River Flood Plains (Hungary) using reflectance spectroscopy. MSc Thesis. Enschede, Netherlands: International Institute for Geo-information Science and Earth Observation.
|
|
|
| [16] |
Metelka V, Baratoux L, Jessell M W, et al. 2015. Visible and infrared properties of unaltered to weathered rocks from Precambrian granite-greenstone terrains of the West African Craton. Journal of African Earth Sciences, 112: 570-585.
doi: 10.1016/j.jafrearsci.2015.10.003
|
|
|
| [17] |
Middleton M, Närhi P, Kuosmanen V, et al. 2011. Quantification of glacial till chemical composition by reflectance spectroscopy. Applied Geochemistry, 26(12): 2215-2225.
doi: 10.1016/j.apgeochem.2011.08.004
|
|
|
| [18] |
Moumane A, El Ghazali F E, Al Karkouri J, et al. 2021. Monitoring spatiotemporal variation of groundwater level and salinity under land use change using integrated field measurements, GIS, geostatistical, and remote-sensing approach: case study of the Feija aquifer, Middle Draa watershed, Moroccan Sahara. Environmental Monitoring and Assessment, 193: 769, doi: 10.1007/s10661-021-09581-2.
doi: 10.1007/s10661-021-09581-2
|
|
|
| [19] |
Nair A, Mathew G. 2012. Lithological discrimination of the Phenaimata felsic-mafic complex, Gujarat, India, using the Advanced Spaceborne Thermal Emission and Reflection Radiometer (ASTER). International Journal of Remote Sensing, 33(1): 198-219.
doi: 10.1080/01431161.2011.591441
|
|
|
| [20] |
Pour A B, Park T S, Park Y, et al. 2019. Landsat-8, advanced spaceborne thermal emission and reflection radiometer, and worldView-3 multispectral satellite imagery for prospecting copper-gold mineralization in the Northeastern Inglefield Mobile Belt (IMB), Northwest Greenland. Remote Sensing, 11(20): 2430, doi: 10.3390/rs11202430.
doi: 10.3390/rs11202430
|
|
|
| [21] |
Qian T, Tsunekawa A, Peng F, et al. 2019. Derivation of salt content in salinized soil from hyperspectral reflectance data: A case study at Minqin Oasis, Northwest China. Journal of Arid Land, 11(1): 111-122.
doi: 10.1007/s40333-019-0091-9
|
|
|
| [22] |
Rathod P H, Müller I, van der Meer F D, et al. 2016. Analysis of visible and near infrared spectral reflectance for assessing metals in soil. Environmental Monitoring and Assessment, 188(10): 558, doi: 10.1007/s10661-016-5568-9.
doi: 10.1007/s10661-016-5568-9
|
|
|
| [23] |
Rowan L C, Simpson C J, Mars J C. 2004. Hyperspectral analysis of the ultramafic complex and adjacent lithologies at Mordor, NT, Australia. Remote Sensing of Environment, 91(3-4): 419-431.
|
|
|
| [24] |
Sarathjith M C, Das B S, Wani S P, et al. 2016. Variable indicators for optimum wavelength selection in diffuse reflectance spectroscopy of soils. Geoderma, 267: 1-9.
doi: 10.1016/j.geoderma.2015.12.031
|
|
|
| [25] |
Simandl G J, Paradis S. 2018. Carbonatites: related ore deposits, resources, footprint, and exploration methods. Applied Earth Science, 127(4): 123-152.
doi: 10.1080/25726838.2018.1516935
|
|
|
| [26] |
Sims D A, Gamon J A. 2002. Relationships between leaf pigment content and spectral reflectance across a wide range of species, leaf structures and developmental stages. Remote Sensing of Environment, 81(2-3): 337-354.
doi: 10.1016/S0034-4257(02)00010-X
|
|
|
| [27] |
Sracek O, Bhattacharya P, Jacks G. 2004. Behavior of arsenic and geochemical modeling of arsenic enrichment in aqueous environments. Applied Geochemistry, 19(2): 169-180.
doi: 10.1016/j.apgeochem.2003.09.005
|
|
|
| [28] |
van der Meer F D, van der Werff H M A, van Ruitenbeek F J A. 2014. Potential of ESA's Sentinel-2 for geological applications. Remote Sensing of Environment, 148: 124-133.
doi: 10.1016/j.rse.2014.03.022
|
|
|
| [29] |
van der Meer F D. 2018. Near-infrared laboratory spectroscopy of mineral chemistry: A review. International Journal of Applied Earth Observation and Geoinformation, 65: 71-78.
doi: 10.1016/j.jag.2017.10.004
|
|
|
| [30] |
Velasco F, Alvaro A, Suarez S, et al. 2005. Mapping Fe-bearing hydrated sulphate minerals with short wave infrared (SWIR) spectral analysis at San Miguel mine environment, Iberian Pyrite Belt (SW Spain). Journal of Geochemical Exploration, 87(2): 45-72.
doi: 10.1016/j.gexplo.2005.07.002
|
|
|
| [31] |
Wang Q, Li P, Pu Z, et al. 2011. Calibration and validation of salt-resistant hyperspectral indices for estimating soil moisture in arid land. Journal of Hydrology, 408(3-4): 276-285.
doi: 10.1016/j.jhydrol.2011.08.012
|
|
|
| [32] |
Wang Y, Jia J, Lu H, et al. 2019. Fluvial sediments in the Alagxa Plateau as a dust source: iron mineralogical and geochemical evidence. Journal of Arid Land, 11(2): 217-227.
doi: 10.1007/s40333-019-0125-3
|
|
|
| [33] |
Wu Y Z, Chen J, Ji J F, et al. 1997. A mechanism study of reflectance spectroscopy for investigating heavy metals in soils. Soil Science Society of America Journal, 71(3): 918-926.
doi: 10.2136/sssaj2006.0285
|
|
|
| [34] |
Zeng Y, Hao D, Badgley G, et al. 2021. Estimating near-infrared reflectance of vegetation from hyperspectral data. Remote Sensing of Environment, 267: 112723, doi: 10.1016/j.rse.2021.112723.
doi: 10.1016/j.rse.2021.112723
|
|
|
| [35] |
Zeraatpisheh M, Ayoubi S, Sulieman M, et al. 2019. Determining the spatial distribution of soil properties using the environmental covariates and multivariate statistical analysis: a case study in semi-arid regions of Iran. Journal of Arid Land, 11(4): 551-566.
doi: 10.1007/s40333-019-0059-9
|
|
|
|
Viewed |
|
|
|
Full text
|
|
|
|
|
Abstract
|
|
|
|
|
Cited |
|
|
|
|
| |
Shared |
|
|
|
|
| |
Discussed |
|
|
|
|