| Research article |
|


|
|
|
| Influence of vapor pressure deficit on vegetation growth in China |
LI Chuanhua1,*( ), ZHANG Liang1, WANG Hongjie2, PENG Lixiao1, YIN Peng1, MIAO Peidong1 ), ZHANG Liang1, WANG Hongjie2, PENG Lixiao1, YIN Peng1, MIAO Peidong1 |
1College of Geography and Environmental Science, Northwest Normal University, Lanzhou 730070, China
2Hebei First Surveying and Mapping Institute, Shijiazhuang 050000, China |
|
|
|
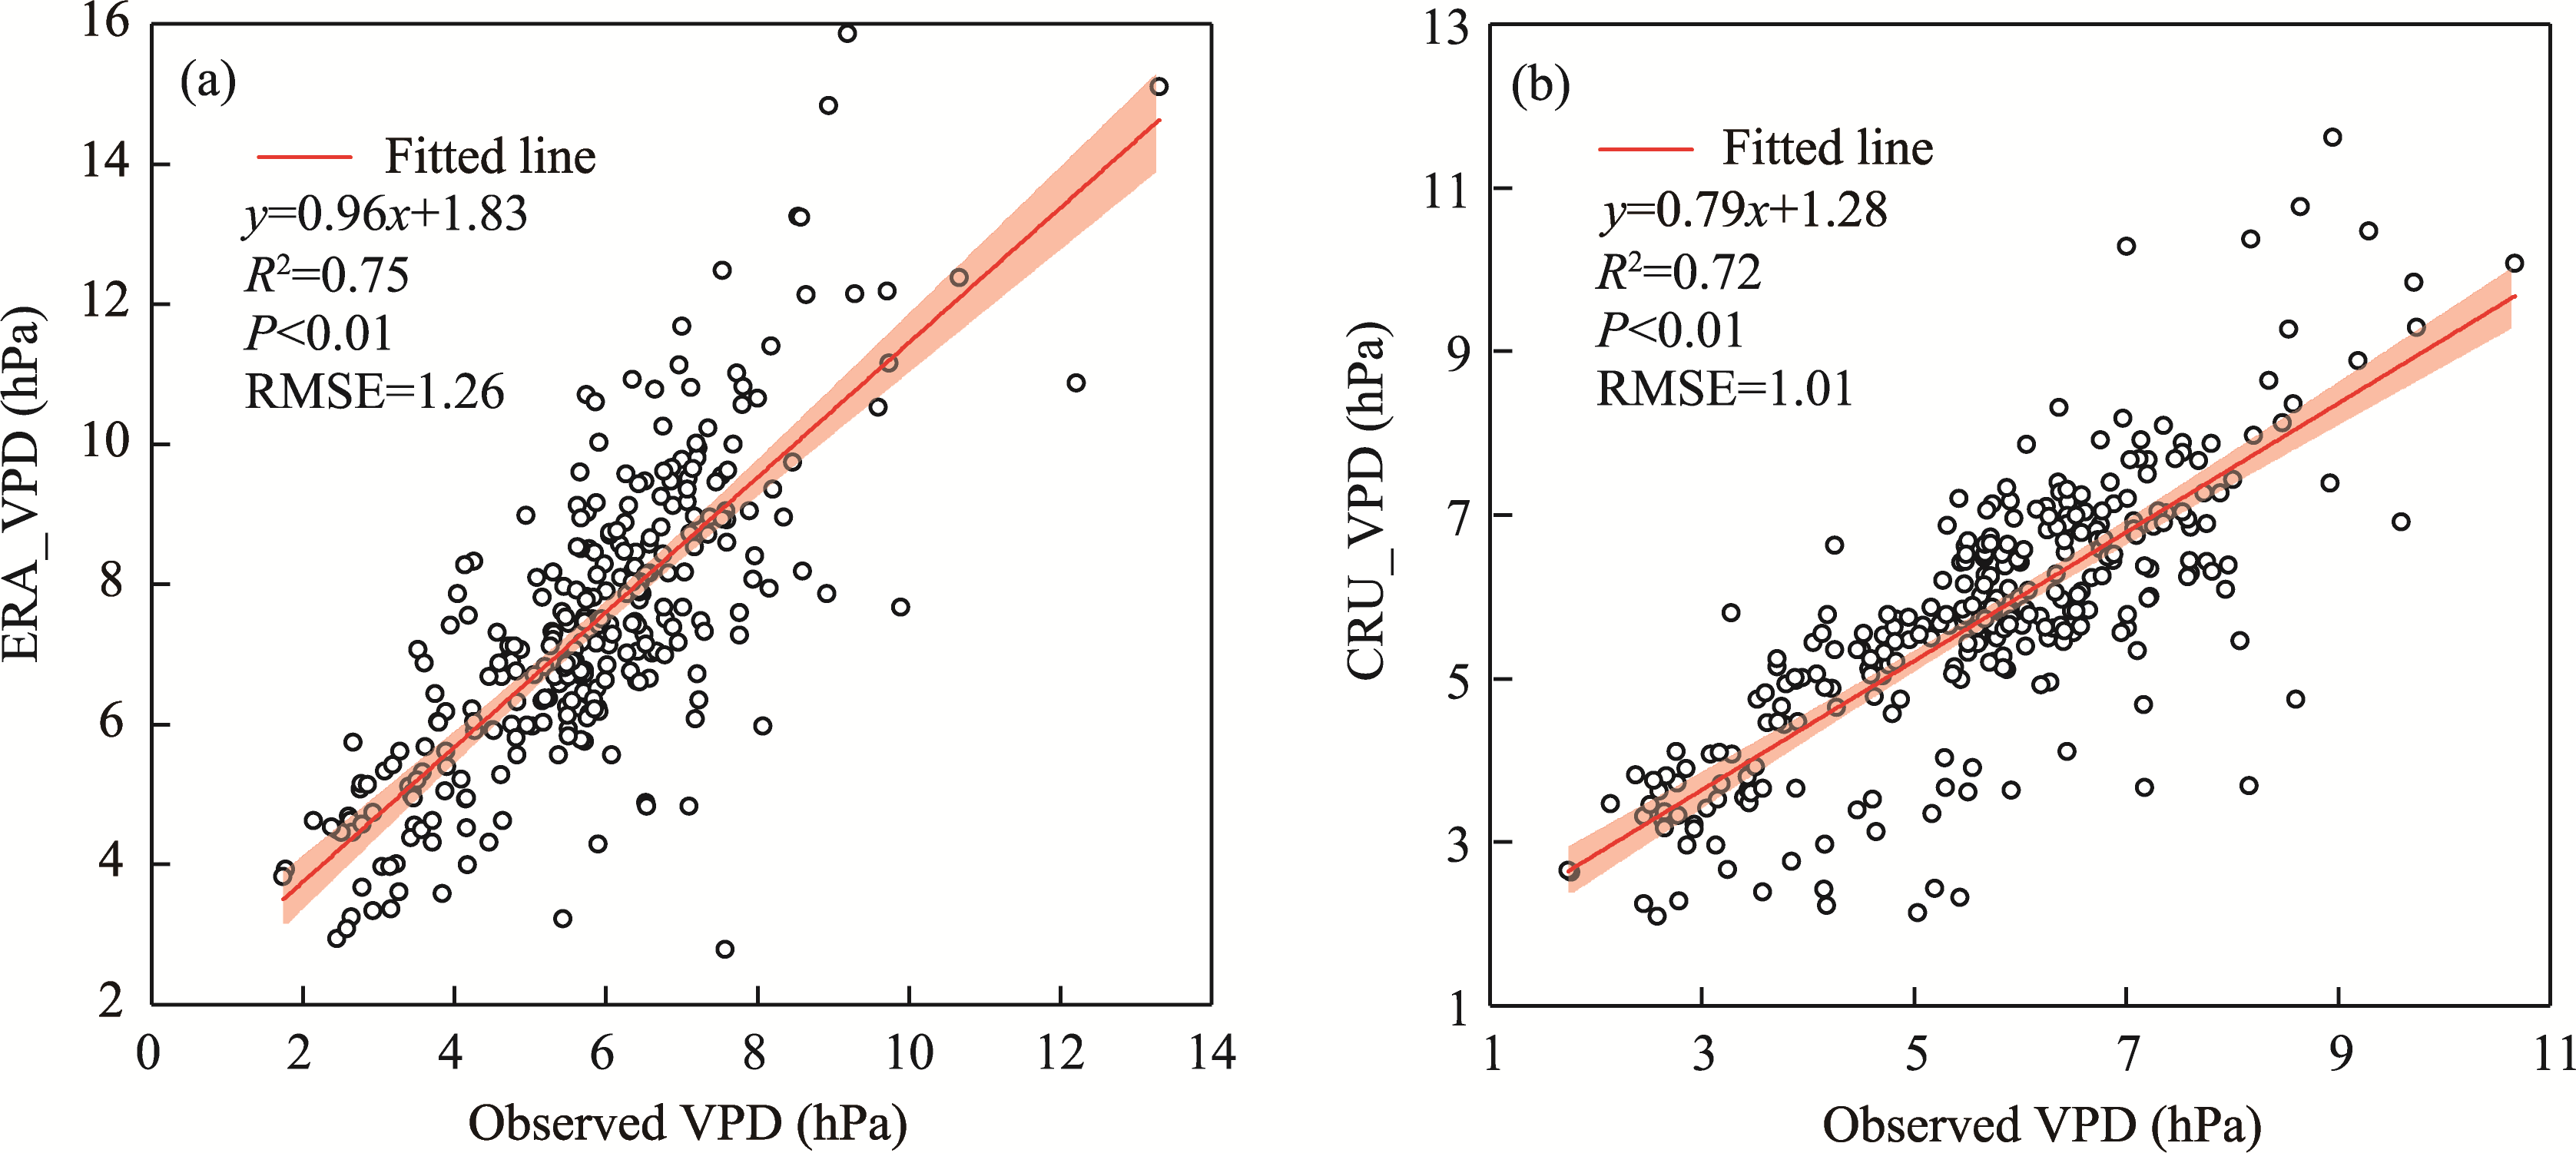
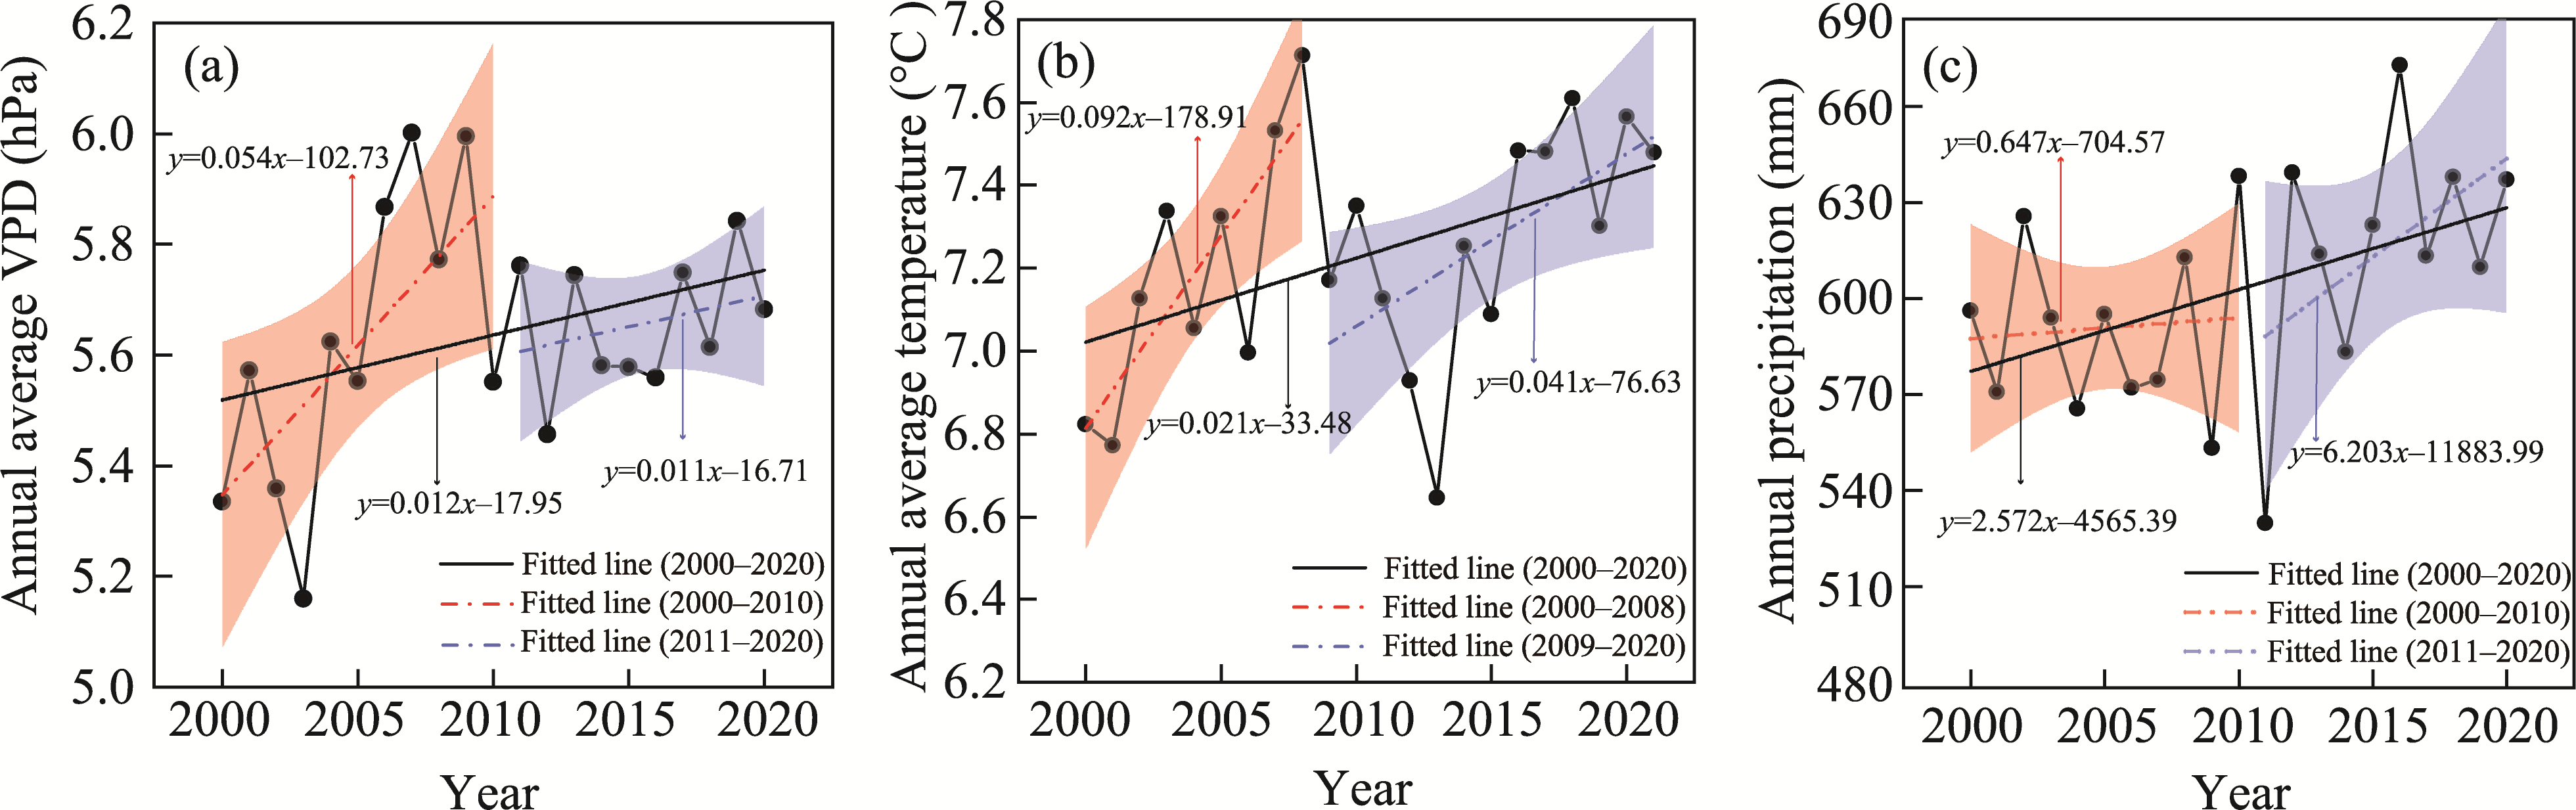
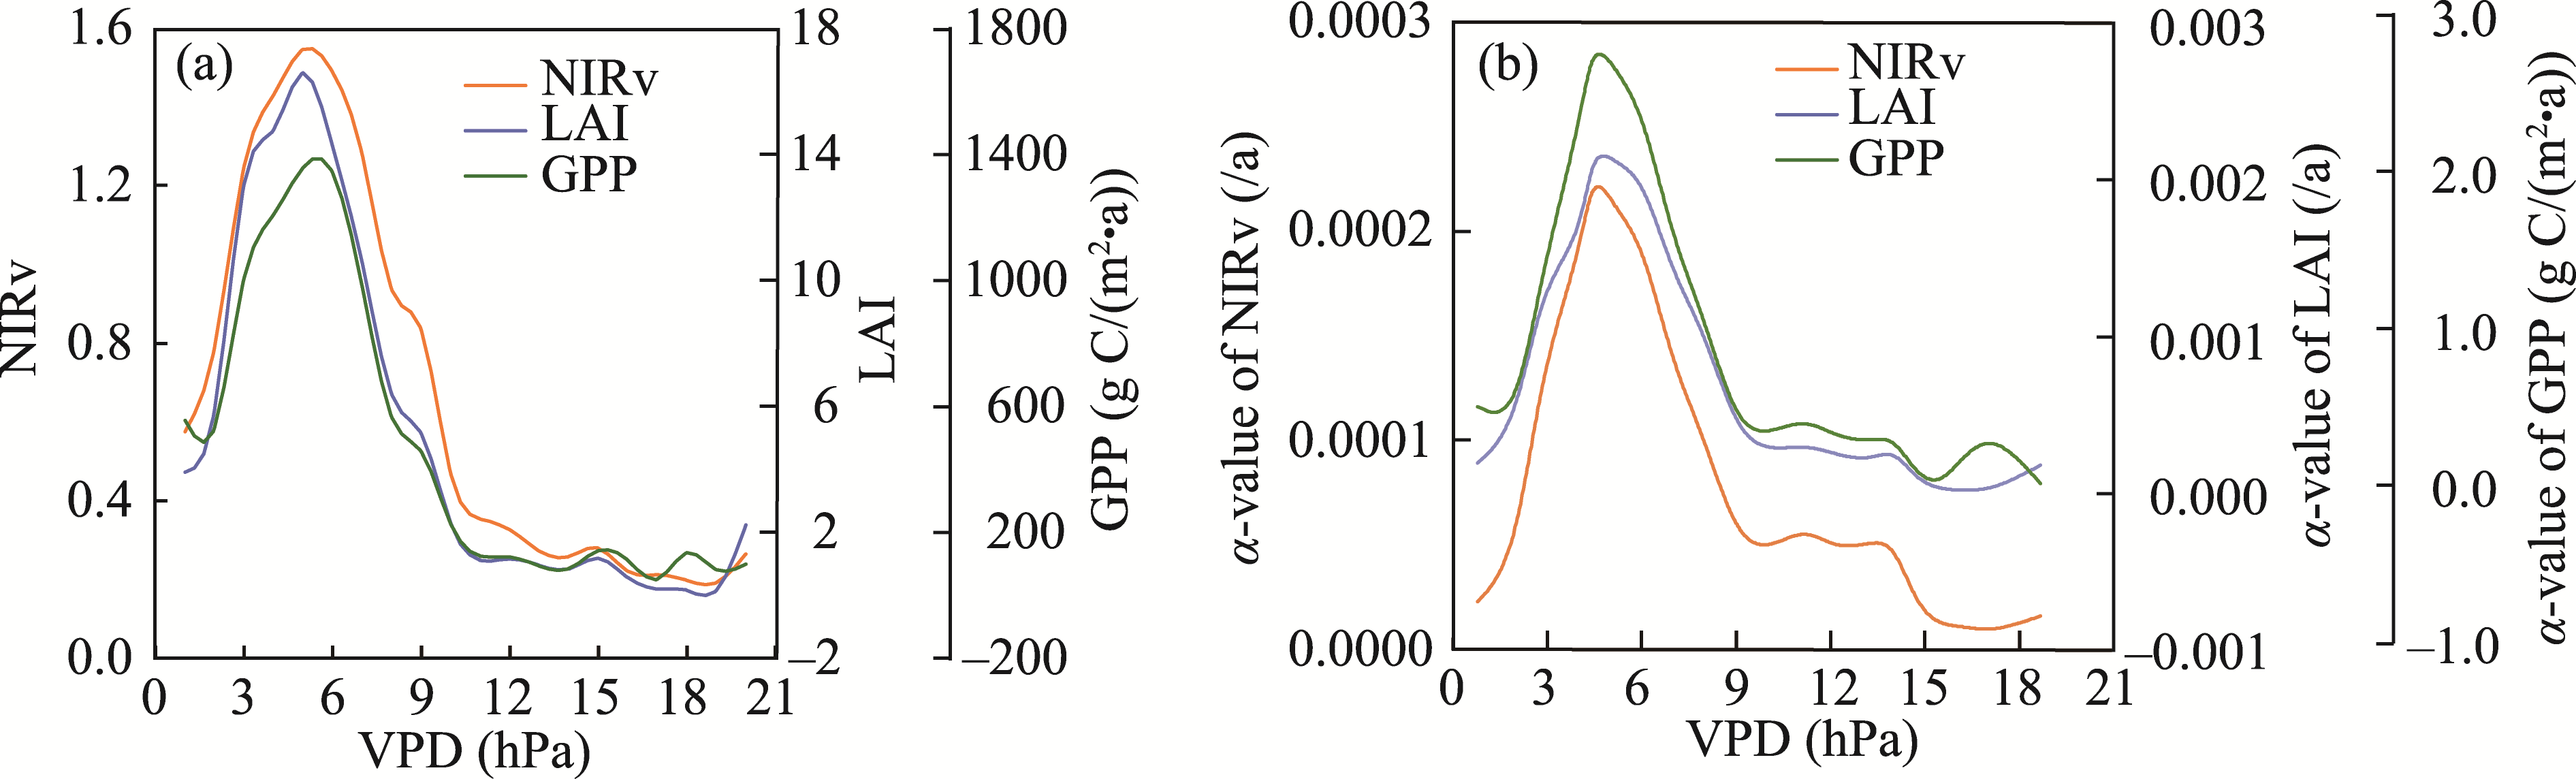
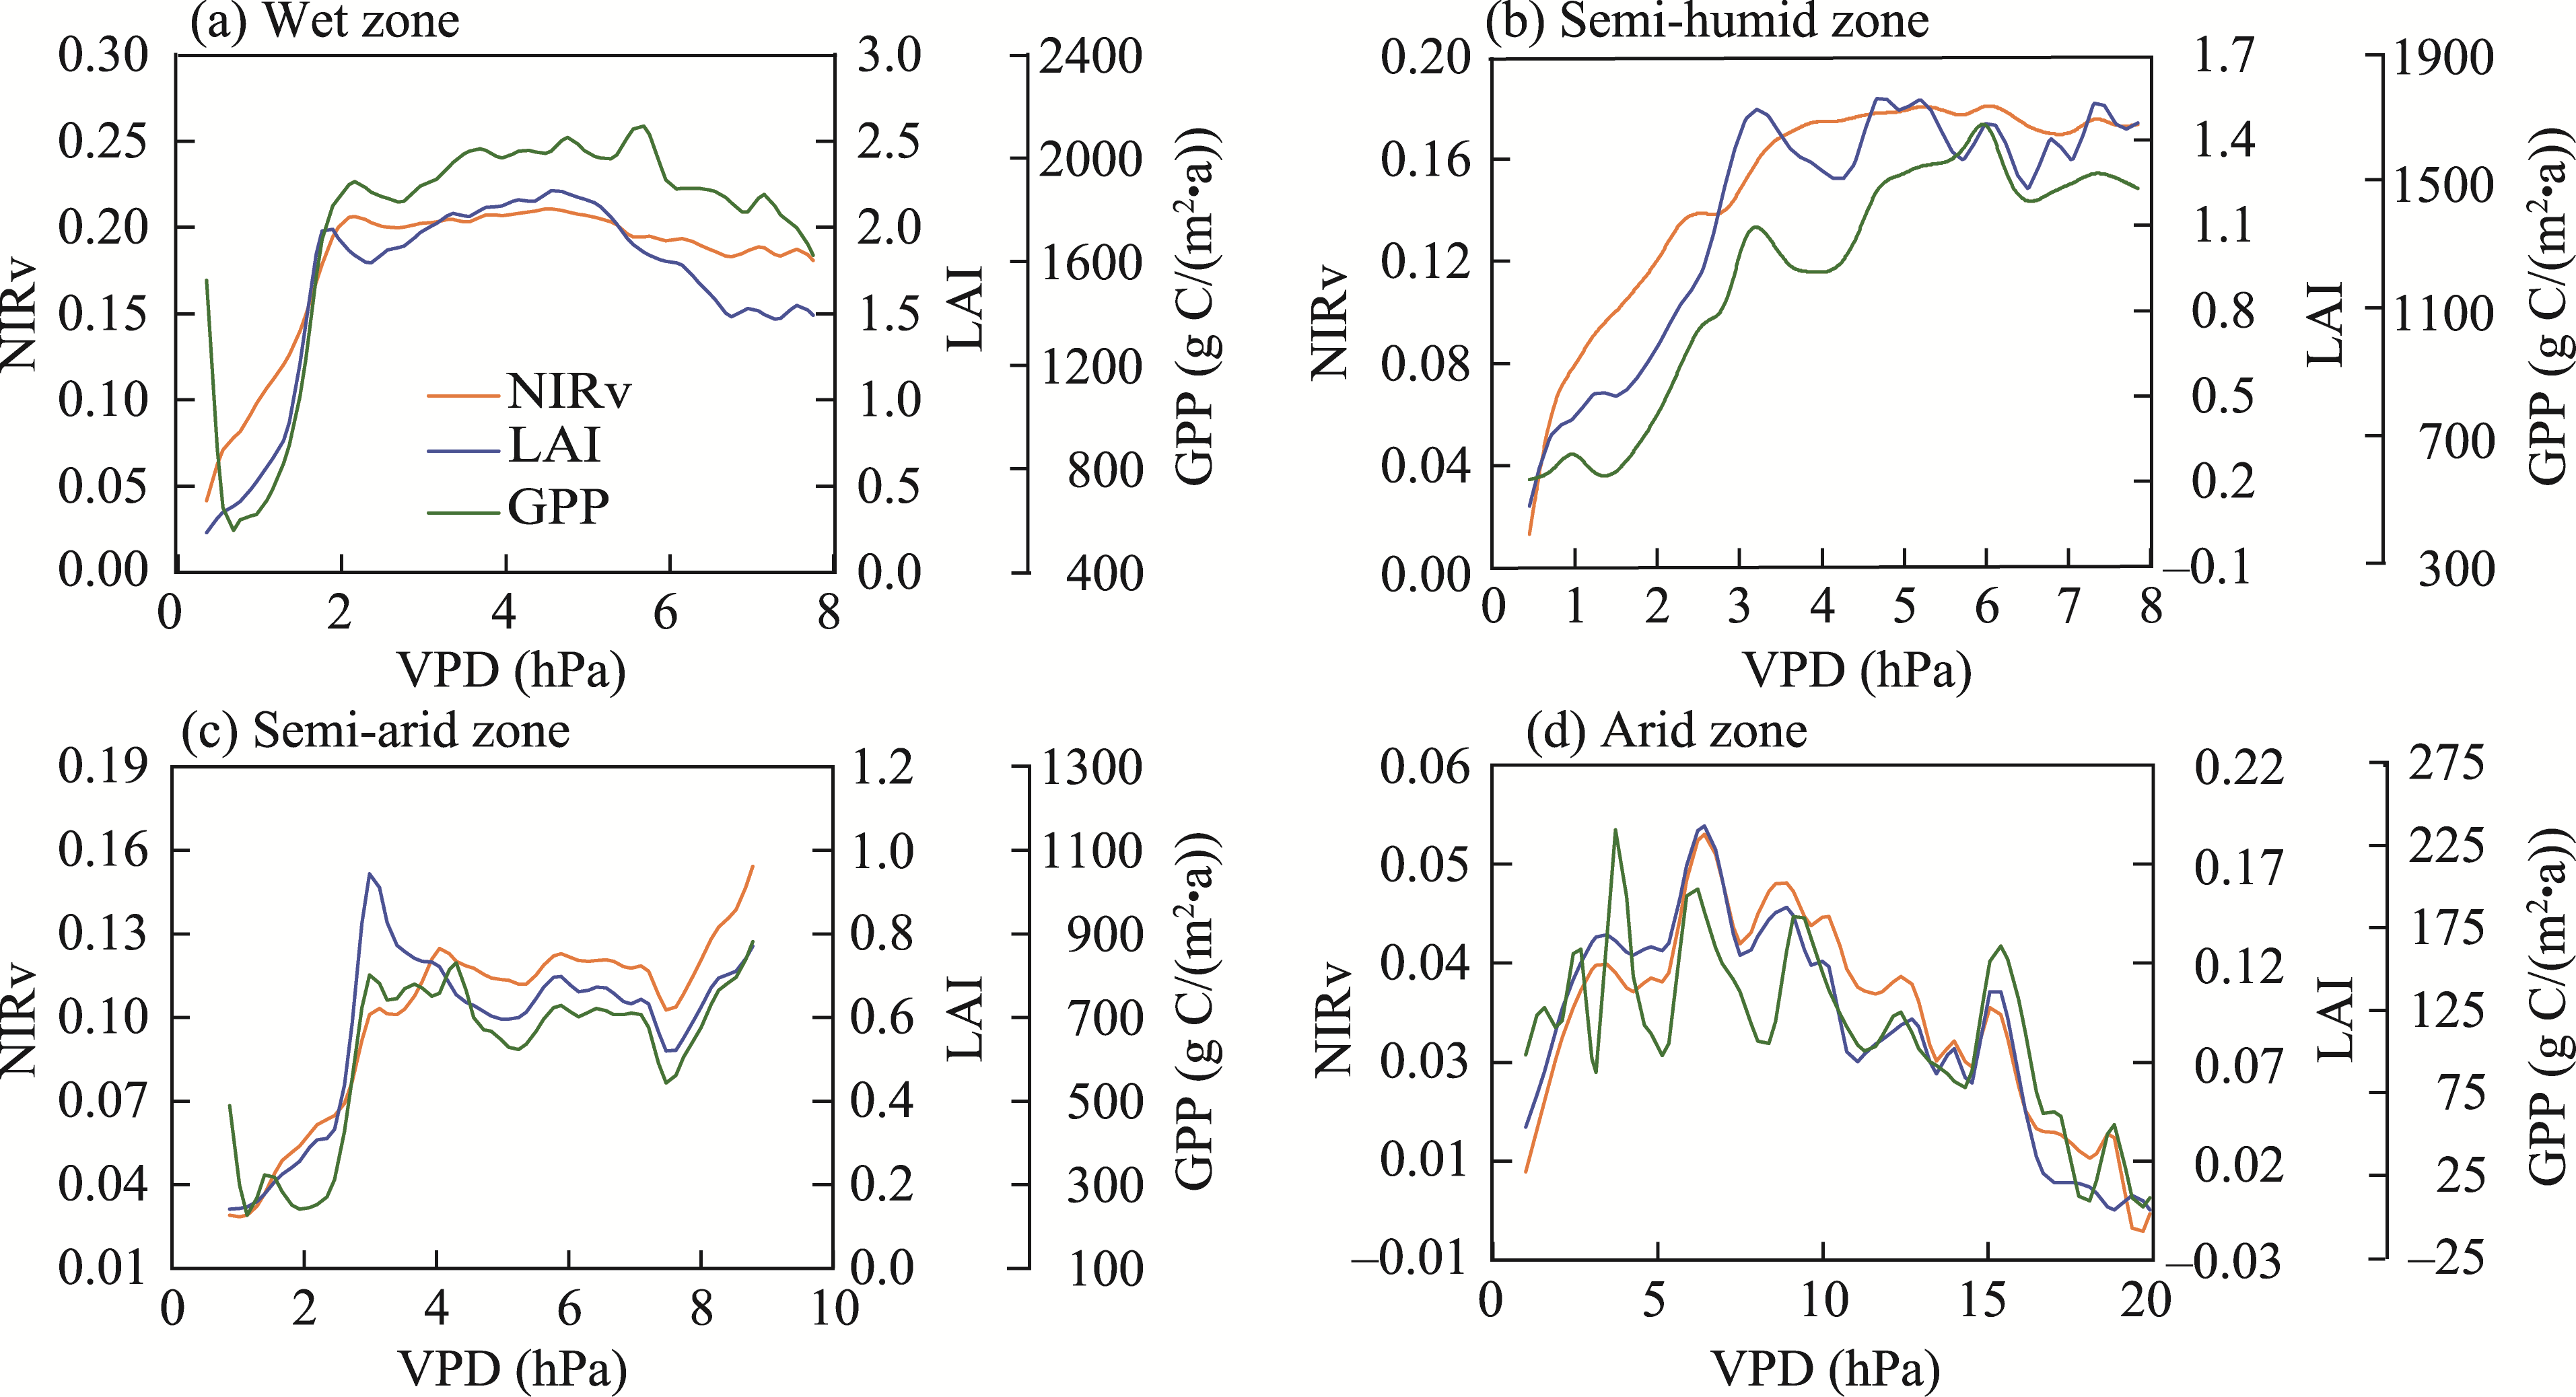
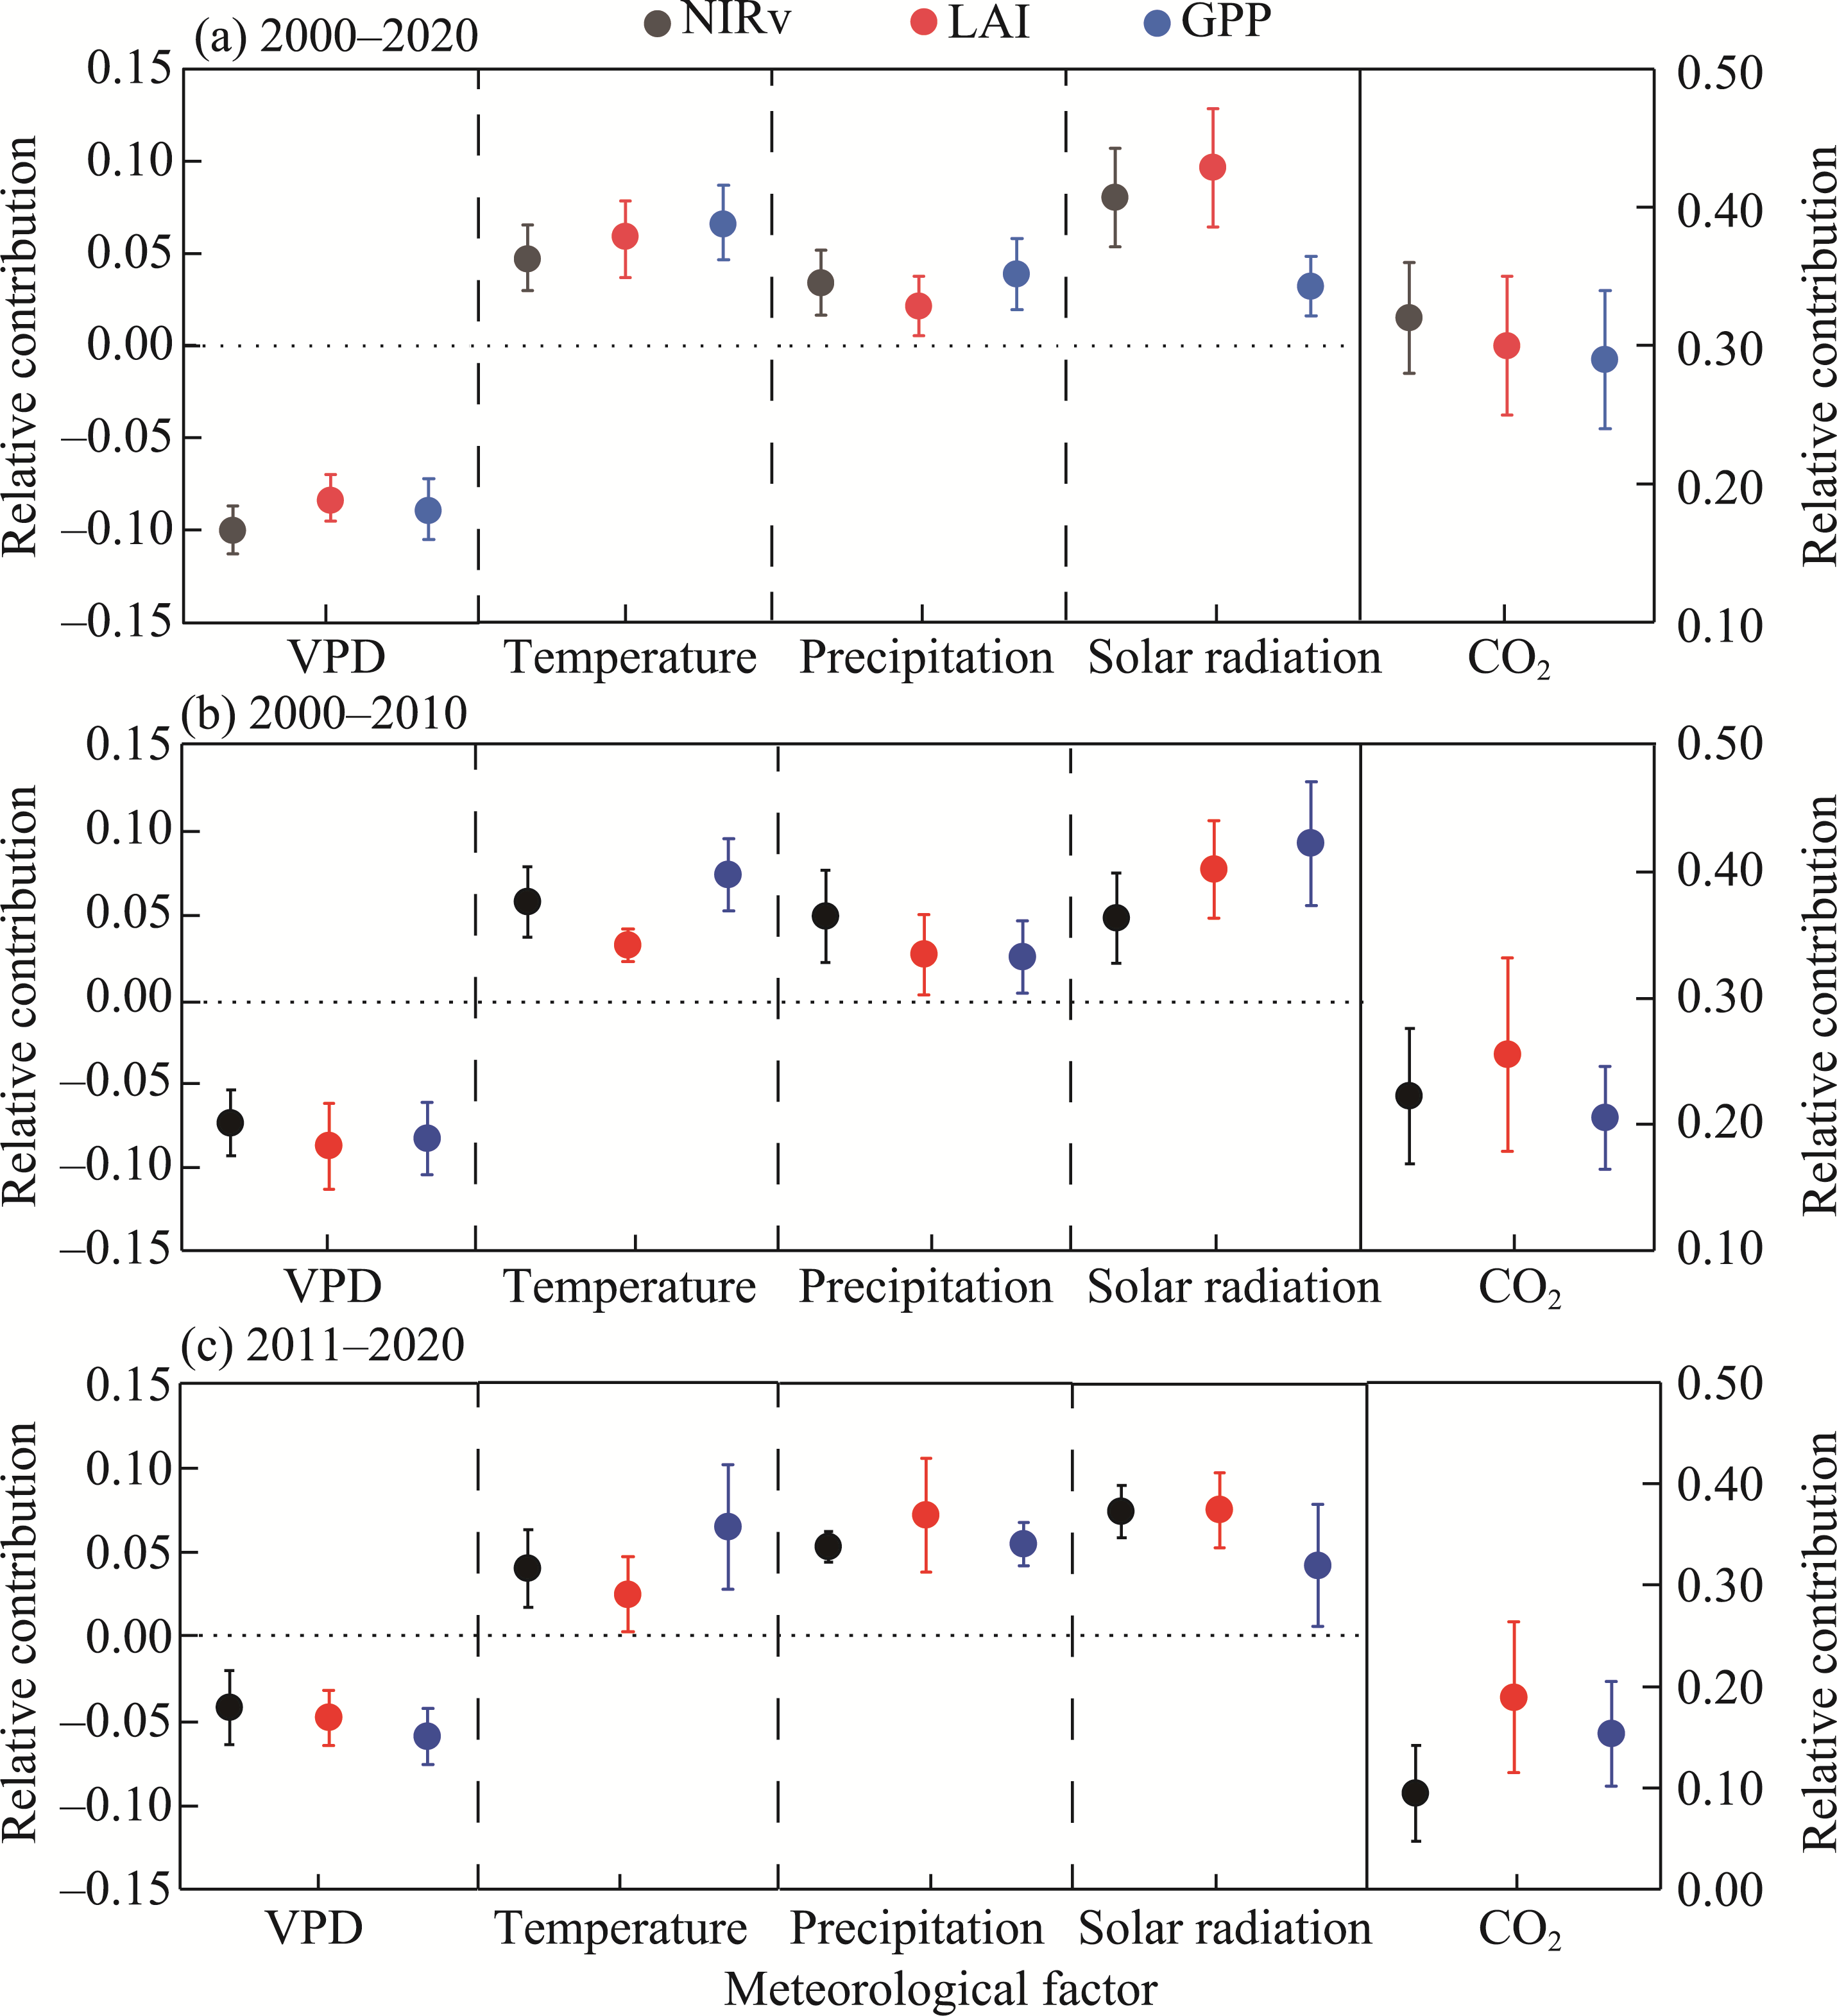
Abstract Vapor pressure deficit (VPD) plays a crucial role in determining plant physiological functions and exerts a substantial influence on vegetation, second only to carbon dioxide (CO2). As a robust indicator of atmospheric water demand, VPD has implications for global water resources, and its significance extends to the structure and functioning of ecosystems. However, the influence of VPD on vegetation growth under climate change remains unclear in China. This study employed empirical equations to estimate the VPD in China from 2000 to 2020 based on meteorological reanalysis data of the Climatic Research Unit (CRU) Time-Series version 4.06 (TS4.06) and European Centre for Medium-Range Weather Forecasts (ECMWF) Reanalysis 5 (ERA-5). Vegetation growth status was characterized using three vegetation indices, namely gross primary productivity (GPP), leaf area index (LAI), and near-infrared reflectance of vegetation (NIRv). The spatiotemporal dynamics of VPD and vegetation indices were analyzed using the Theil-Sen median trend analysis and Mann-Kendall test. Furthermore, the influence of VPD on vegetation growth and its relative contribution were assessed using a multiple linear regression model. The results indicated an overall negative correlation between VPD and vegetation indices. Three VPD intervals for the correlations between VPD and vegetation indices were identified: a significant positive correlation at VPD below 4.820 hPa, a significant negative correlation at VPD within 4.820-9.000 hPa, and a notable weakening of negative correlation at VPD above 9.000 hPa. VPD exhibited a pronounced negative impact on vegetation growth, surpassing those of temperature, precipitation, and solar radiation in absolute magnitude. CO2 contributed most positively to vegetation growth, with VPD offsetting approximately 30.00% of the positive effect of CO2. As the rise of VPD decelerated, its relative contribution to vegetation growth diminished. Additionally, the intensification of spatial variations in temperature and precipitation accentuated the spatial heterogeneity in the impact of VPD on vegetation growth in China. This research provides a theoretical foundation for addressing climate change in China, especially regarding the challenges posed by increasing VPD.
|
|
Received: 27 December 2023
Published: 30 June 2024
|
|
Corresponding Authors:
*LI Chuanhua (E-mail: lch_nwnu@nwnu.edu.cn)
|
|
|
| [1] |
Accadia C, Mariani S, Casaioli M, et al. 2003. Sensitivity of precipitation forecast skill scores to bilinear interpolation and a simple nearest-neighbor average method on high-resolution verification grids. Weather and Forecasting, 18(5): 918-932.
|
|
|
| [2] |
Badgley G, Field C B, Berry J A. 2017. Canopy near-infrared reflectance and terrestrial photosynthesis. Science Advances, 3(3): e1602244, doi: 10.1126/sciadv.1602244.
|
|
|
| [3] |
Bourbia I, Lucani C, Carins-Murphy M R, et al. 2023. In situ characterisation of whole-plant stomatal responses to VPD using leaf optical dendrometry. Plant, Cell and Environment, 46(11): 3273-3286.
|
|
|
| [4] |
Buck A L. 1981. New equations for computing vapor pressure and enhancement factor. Journal of Applied Meteorology, 20(12): 1527-1532.
|
|
|
| [5] |
Cai W Y, Ullah S, Yan L, et al. 2021. Remote sensing of ecosystem water use efficiency: A review of direct and indirect estimation methods. Remote Sensing, 13(12): 2393, doi: 10.3390/rs13122393.
|
|
|
| [6] |
Chang S T. 2018. Characteristics and impact on regional climate of water vapor over the Tibetan Plateau in summer under global warming. MSc Thesis. Lanzhou: Lanzhou University. (in Chinese)
|
|
|
| [7] |
Chen Z, Gao J, Yang X. 2013. Introduction of IGRA dataset and analysis of its data quality. Journal of Meteorology and Environment, 29(5): 106-111. (in Chinese)
|
|
|
| [8] |
Cucchi M, Weedon G P, Amici A, et al. 2020. WFDE5: Bias-adjusted ERA5 reanalysis data for impact studies. Earth System Science Data, 12(3): 2097-2120.
|
|
|
| [9] |
Cui T X, Wang Y J, Sun R, et al. 2016. Estimating vegetation primary production in the Heihe River Basin of China with multi-source and multi-scale data. PLoS ONE, 11(4): e0153971, doi: 10.1371/journal.pone.0153971.
|
|
|
| [10] |
Daly C, Smith J I, Olson K V. 2015. Mapping atmospheric moisture climatologies across the conterminous United States. PLoS One, 10(10): e0141140, doi: 10.1371/journal.pone.0141140.
|
|
|
| [11] |
Dee D P, Uppala S M, Simmons A J, et al. 2011. The ERA-Interim reanalysis: Configuration and performance of the data assimilation system. Quarterly Journal of the Royal Meteorological Society, 137(656): 553-597.
|
|
|
| [12] |
Ding J Z, Yang T, Zhao Y T, et al. 2018. Increasingly important role of atmospheric aridity on Tibetan alpine grasslands. Geophysical Research Letters, 45(6): 2852-2859.
|
|
|
| [13] |
Eamus D, Boulain N, Cleverly J, et al. 2013. Global change-type drought-induced tree mortality: Vapor pressure deficit is more important than temperature per se in causing decline in tree health. Ecology and Evolution, 3(8): 2711-2729.
doi: 10.1002/ece3.664
pmid: 24567834
|
|
|
| [14] |
Engelen R J, Mcnally A P. 2005. Estimating atmospheric CO2 from advanced infrared satellite radiances within an operational four-dimensional variational (4D-var) data assimilation system: Results and validation. Journal of Geophysical Research: Atmospheres, 110(D18): 305, doi: 10.1029/2005JD005982.
|
|
|
| [15] |
Fan Z M, Bai X Y. 2021. Scenarios of potential vegetation distribution in the different gradient zones of Qinghai-Tibet Plateau under future climate change. Science of the Total Environment, 796: 148918, doi: 10.1016/j.scitotenv.2021.148918.
|
|
|
| [16] |
Ficklin D L, Novick K A. 2017. Historic and projected changes in vapor pressure deficit suggest a continental-scale drying of the United States atmosphere. Journal of Geophysical Research: Atmospheres, 122(4): 2061-2079.
|
|
|
| [17] |
Fu Q, Feng S. 2014. Responses of terrestrial aridity to global warming. Journal of Geophysical Research: Atmospheres, 119(13): 7863-7875.
|
|
|
| [18] |
Gamelin B L, Feinstein J, Wang J L. et al. 2022. Projected U.S. drought extremes through the twenty-first century with vapor pressure deficit. Scientific Reports, 12: 8615, doi: 10.1038/s41598-022-12516-7.
pmid: 35597807
|
|
|
| [19] |
Goetz S J, Fiske G J, Bunn A G. 2006. Using satellite time-series data sets to analyze fire disturbance and forest recovery across Canada. Remote Sensing of Environment, 101(3): 352-365.
|
|
|
| [20] |
Grossiord C, Buckley T N, Cernusak L A, et al. 2020. Plant responses to rising vapor pressure deficit. New Phytologist, 226(6): 1550-1566.
doi: 10.1111/nph.16485
pmid: 32064613
|
|
|
| [21] |
Guo M, Li J, He H S, et al. 2018. Detecting global vegetation changes using Mann-Kendal (MK) trend test for 1982-2015 time period. Chinese Geographical Science, 28(6): 907-919.
|
|
|
| [22] |
Harris I, Osborn T J, Jones P, et al. 2020. Version 4 of the CRU TS monthly high-resolution gridded multivariate climate dataset. Scientific Data, 7: 109, doi: 10.1038/s41597-020-0453-3.
pmid: 32246091
|
|
|
| [23] |
Hashimoto H, Dungan J L, White M A, et al. 2008. Satellite-based estimation of surface vapor pressure deficits using MODIS land surface temperature data. Remote Sensing of Environment, 112(1): 142-155.
|
|
|
| [24] |
Huete A R. 2012. Vegetation indices, remote sensing and forest monitoring. Geography Compass, 6(9): 513-532.
|
|
|
| [25] |
Jaramillo C, Ochoa D, Contreras L, et al. 2010. Effects of rapid global warming at the Paleocene-Eocene boundary on neotropical vegetation. Science, 330(6006): 957-961.
doi: 10.1126/science.1193833
pmid: 21071667
|
|
|
| [26] |
Jarvis P G. 1976. The interpretation of the variations in leaf water potential and stomatal conductance found in canopies in the field. Philosophical Transactions of the Royal Society of London. Series B, Biological Sciences, 273(927): 593-610.
|
|
|
| [27] |
Keenan T F, Hollinger D Y, Bohrer G, et al. 2013. Increase in forest water-use efficiency as atmospheric carbon dioxide concentrations rise. Nature, 499(7458): 324-327.
|
|
|
| [28] |
Kiel M, O'dell C W, Fisher B, et al. 2019. How bias correction goes wrong: measurement of XCO2 affected by erroneous surface pressure estimates. Atmospheric Measurement Techniques, 12(4): 2241-2259.
|
|
|
| [29] |
Kong D D, Zhang Q, Huang W L, et al. 2017. Vegetation phenology change in Tibetan Plateau from 1982 to 2013 and its related meteorological factors. Acta Geographica Sinica, 72(1): 39-52. (in Chinese)
|
|
|
| [30] |
Konings A G, Williams A P, Gentine P. 2017. Sensitivity of grassland productivity to aridity controlled by stomatal and xylem regulation. Nature Geoscience, 10(4): 284-288.
doi: 10.1038/NGEO2903
|
|
|
| [31] |
Leonardi C, Guichard S, Bertin N. 2000. High vapour pressure deficit influences growth, transpiration and quality of tomato fruits. Scientia Horticulturae, 84(3-4): 285-296.
|
|
|
| [32] |
Li F, Xiao J F, Chen J Q, et al. 2023. Global water use efficiency saturation due to increased vapor pressure deficit. Science, 381(6658): 672-677.
doi: 10.1126/science.adf5041
pmid: 37561856
|
|
|
| [33] |
Li Q Q, Cao Y P, Miao S L. 2022. Spatio-temporal variation in vegetation coverage and its response to climate factors in the Yellow River Basin, China. Acta Ecologica Sinica, 42(10): 4041-4054. (in Chinese)
|
|
|
| [34] |
Li X, Xiao J F. 2019. A global, 0.05-degree product of solar-induced chlorophyll fluorescence derived from OCO-2, MODIS, and reanalysis data. Remote Sensing, 11(5): 517, doi: 10.3390/rs11050517.
|
|
|
| [35] |
Liu B, Wang Y, Lou Z S, et al. 2019. The MODIS PWV correction based on CMONOC in Chinese Mainland. Acta Geodaetica et Cartographica Sinica, 48(10): 1207-1215. (in Chinese)
doi: 10.11947/j.AGCS.2019.20180386
|
|
|
| [36] |
Liu K, Nie G G, Zhang S. 2020. Study on the spatiotemporal evolution of temperature and precipitation in China from 1951 to 2018. Advances in Earth Science, 35(11): 1113-1126. (in Chinese)
doi: 10.11867/j.issn.1001-8166.2020.102
|
|
|
| [37] |
Liu M, Yang G J, Yuan W P, et al. 2024. Overridingly increasing vegetation sensitivity to vapor pressure deficit over the recent two decades in China. Ecological Indicators, 161: 111977, doi: 10.1016/j.ecolind.2024.111977.
|
|
|
| [38] |
Liu Y X, Liu X F, Hu Y N, et al. 2015a. Analyzing nonlinear variations in terrestrial vegetation in China during 1982-2012. Environmental Monitoring and Assessment, 187(11): 722, doi: 10.1007/s10661-015-4922-7.
|
|
|
| [39] |
Liu Y X, Wang Y L, Peng J, et al. 2015b. Correlations between urbanization and vegetation degradation across the world's metropolises using DMSP/OLS nighttime light data. Remote Sensing, 7(2): 2067-2088.
|
|
|
| [40] |
Lou J P, Xu G Y, Wang Z J, et al. 2021. Multi-year NDVI values as indicator of the relationship between spatiotemporal vegetation dynamics and environmental factors in the Qaidam Basin, China. Remote Sensing, 13(7): 1240, doi: 10.3390/rs13071240.
|
|
|
| [41] |
Ma Z C, Yu H B, Cao C M, et al. 2020. Spatiotemporal characteristics of fractional vegetation coverage and its influencing factors in China. Resources and Environment in the Yangtze Basin, 29(6): 1310-1321. (in Chinese)
|
|
|
| [42] |
Mathias J M, Thomas R B. 2021. Global tree intrinsic water use efficiency is enhanced by increased atmospheric CO2 and modulated by climate and plant functional types. Proceedings of the National Academy of Sciences, 118(7): e2014286118, doi: 10.1073/pnas.2014286118.
|
|
|
| [43] |
Mcdowell N, Pockman W T, Allen C D, et al. 2008. Mechanisms of plant survival and mortality during drought: Why do some plants survive while others succumb to drought? New Phytologist, 178(4): 719-739.
doi: 10.1111/j.1469-8137.2008.02436.x
pmid: 18422905
|
|
|
| [44] |
Novick K A, Ficklin D L, Stoy P C, et al. 2016. The increasing importance of atmospheric demand for ecosystem water and carbon fluxes. Nature Climate Change, 6(11): 1023-1027.
|
|
|
| [45] |
Obu J, Westermann S, Bartsch A, et al. 2019. Northern hemisphere permafrost map based on TTOP modelling for 2000-2016 at 1 km2 scale. Earth-Science Reviews, 193: 299-316.
doi: 10.1016/j.earscirev.2019.04.023
|
|
|
| [46] |
Park Williams A, Allen C D, Macalady A K, et al. 2013. Temperature as a potent driver of regional forest drought stress and tree mortality. Nature Climate Change, 3(3): 292-297.
|
|
|
| [47] |
Peng S Z, Ding Y X, Wen Z M, et al. 2017. Spatiotemporal change and trend analysis of potential evapotranspiration over the Loess Plateau of China during 2011-2100. Agricultural and Forest Meteorology, 233: 183-194.
|
|
|
| [48] |
Piao S L, Fang J Y. 2001. Dynamic vegetation cover change over the last 18 years in China. Quaternary Sciences, 21(4): 294-302. (in Chinese)
|
|
|
| [49] |
Reichstein M, Bahn M, Ciais P, et al. 2013. Climate extremes and the carbon cycle. Nature, 500(7462): 287-295.
|
|
|
| [50] |
Rigden A J, Salvucci G D. 2017. Stomatal response to humidity and CO2 implicated in recent decline in US evaporation. Global Change Biology, 23(3): 1140-1151.
|
|
|
| [51] |
Şahin M, Yıldız B Y, Şenkal O, et al. 2013. Estimation of the vapour pressure deficit using NOAA-AVHRR data. International Journal of Remote Sensing, 34(8): 2714-2729.
|
|
|
| [52] |
Sun H Y, Wang C Y, Niu Z, et al. 1998. Analysis of the vegetation cover change and the relationship between NDVI and environmental factors by using NOAA time series data. National Remote Sensing Bulletin, 2(3): 204-210. (in Chinese)
|
|
|
| [53] |
Tu Y, Jiang L L, Liu R, et al. 2021. Spatiotemporal changes of vegetation NDVI and its driving forces in China during 1982-2015. Transactions of the Chinese Society of Agricultural Engineering, 37(22): 75-84. (in Chinese)
|
|
|
| [54] |
Viña A, Gitelson A A, Nguy-Robertson A L, et al. 2011. Comparison of different vegetation indices for the remote assessment of green leaf area index of crops. Remote Sensing of Environment, 115(12): 3468-3478.
|
|
|
| [55] |
Wang Q, Zhang B, Dai S P, et al. 2012. Analysis of the vegetation cover change and its relationship with factors in the Three-North Shelter Forest Program. China Environmental Science, 32(7): 1302-1308. (in Chinese)
|
|
|
| [56] |
Wang S H, Zhang Y G, Ju W M, et al. 2021. Response to comments on "Recent global decline of CO2 fertilization effects on vegetation photosynthesis". Science, 373(6562): abg7484, doi: 10.1126/science.abg7484.
|
|
|
| [57] |
Wang X H, Piao S L, Ciais P, et al. 2011. Spring temperature change and its implication in the change of vegetation growth in North America from 1982 to 2006. Proceedings of the National Academy of Sciences, 108(4): 1240-1245.
|
|
|
| [58] |
Wang X Q, Ma L Y, Jia Z K, et al. 2005. Research and application advances in leaf area index (LAI). Chinese Journal of Ecology, 24(5): 537-541. (in Chinese)
|
|
|
| [59] |
Wang Y Y, Zhaxiyangzong. 2016. Assessing vegetation response to meteorological drought in Tibet Autonomous Region using vegetation condition index. Journal of Applied Meteorological Science, 27(4): 435-444. (in Chinese)
|
|
|
| [60] |
Willett K M, Sherwood S. 2012. Exceedance of heat index thresholds for 15 regions under a warming climate using the wet-bulb globe temperature. International Journal of Climatology, 32(2): 161-177.
|
|
|
| [61] |
Williams L E, Baeza P. 2007. Relationships among ambient temperature and vapor pressure deficit and leaf and stem water potentials of fully irrigated, field-grown grapevines. American Journal of Enology and Viticulture, 58(2): 173-181.
|
|
|
| [62] |
Xiao Z Q, Liang S L, Jiang B. 2017. Evaluation of four long time-series global leaf area index products. Agricultural and Forest Meteorology, 246: 218-230.
|
|
|
| [63] |
Xie S D, Mo X G, Hu S, et al. 2020. Contributions of climate change, elevated atmospheric CO2 and human activities to ET and GPP trends in the Three-North Region of China. Agricultural and Forest Meteorology, 295: 108183, doi: 10.1016/j.agrformet.2020.108183.
|
|
|
| [64] |
Xu B D, Li J, Park T, et al. 2018. An integrated method for validating long-term leaf area index products using global networks of site-based measurements. Remote Sensing of Environment, 209: 134-151.
|
|
|
| [65] |
Xu R L, Li B F, Lian L S. 2020. Quantitative relationship between the spatiotemporal change of relative humidity and climatic factors in the arid region of Northwest China from 1960 to 2015. Research of Soil and Water Conservation, 27(6): 233-239, 246. (in Chinese)
|
|
|
| [66] |
Xu Y, Ding Y H, Zhao Z C. 2001. Confidence analysis of NCEP/NCAR 50-year global reanalyzed data in climate change research in China. Journal of Applied Meteorological Science, 12(3): 337-347. (in Chinese)
|
|
|
| [67] |
Yu X L, Guo X L, Wu Z C. 2014. Land surface temperature retrieval from Landsat 8 TIRS—comparison between radiative transfer equation-based method, split window algorithm and single channel method. Remote Sensing, 6(10): 9829-9852.
|
|
|
| [68] |
Yuan R R, Huang X L, Hao L. 2021. Spatio-temporal variation of vapor pressure deficit and impact factors in China in the past 40 years. Climatic and Environmental Research, 26(4): 413-424. (in Chinese)
|
|
|
| [69] |
Yuan W P, Zheng Y, Piao S L. et al. 2019. Increased atmospheric vapor pressure deficit reduces global vegetation growth. Science Advances, 5(8): eaax1396, doi: 10.1126/sciadv.aax1396.
|
|
|
| [70] |
Zhang S, Tao F L, Zhang Z. 2017. Spatial and temporal changes in vapor pressure deficit and their impacts on crop yields in China during 1980-2008. Journal of Meteorological Research, 31(4): 800-808.
|
|
|
| [71] |
Zhang Y, Li B F, Chen Y N. 2018. The temporal and spatial variation of water vapor content and its relationship with precipitation in the arid region of Northwest China from 1970 to 2013. Journal of Natural Resources, 33(6): 1043-1055. (in Chinese)
doi: 10.31497/zrzyxb.20170518
|
|
|
|
Viewed |
|
|
|
Full text
|
|
|
|
|
Abstract
|
|
|
|
|
Cited |
|
|
|
|
| |
Shared |
|
|
|
|
| |
Discussed |
|
|
|
|