| Geography, geology and natural resources in Central Asia (Guest Editorial Board Member: Prof. Dr. XIAO Wenjiao) |
|

|
|
|
| Optimal bandwidth selection for retrieving Cu content in rock based on hyperspectral remote sensing |
| MA Xiumei1,2,3,4, ZHOU Kefa1,2,3,4, WANG Jinlin1,2,3,4,*, CUI Shichao1,2,3,4, ZHOU Shuguang1,2,3,4, WANG Shanshan1,2,3,4, ZHANG Guanbin5 |
1State Key Laboratory of Desert and Oasis Ecology, Xinjiang Institute of Ecology and Geography, Chinese Academy of Sciences, Urumqi 830011, China
2Xinjiang Key Laboratory of Mineral Resources and Digital Geology, Xinjiang Institute of Ecology and Geography, Chinese Academy of Sciences, Urumqi 830011, China
3Xinjiang Research Centre for Mineral Resources, Xinjiang Institute of Ecology and Geography, Chinese Academy of Sciences, Urumqi 830011, China
4University of Chinese Academy of Sciences, Beijing 100049, China
5Xinjiang Academy of Science and Technology for Development Strategy, Urumqi 830011, China |
|
|
|
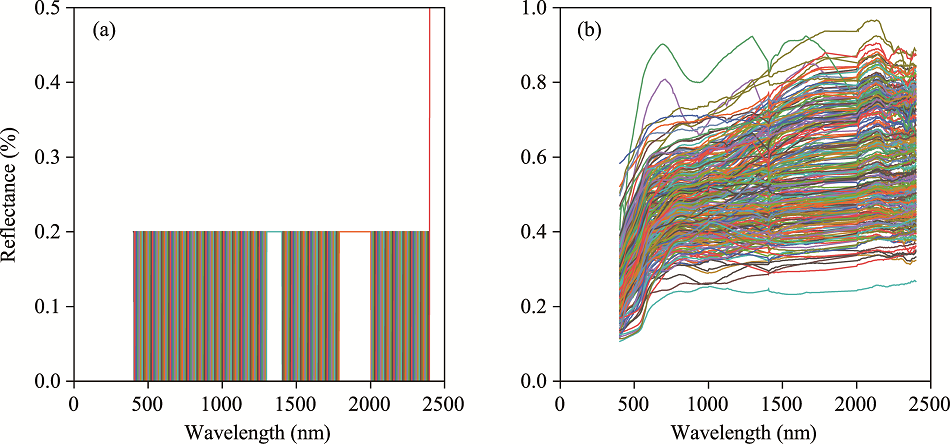
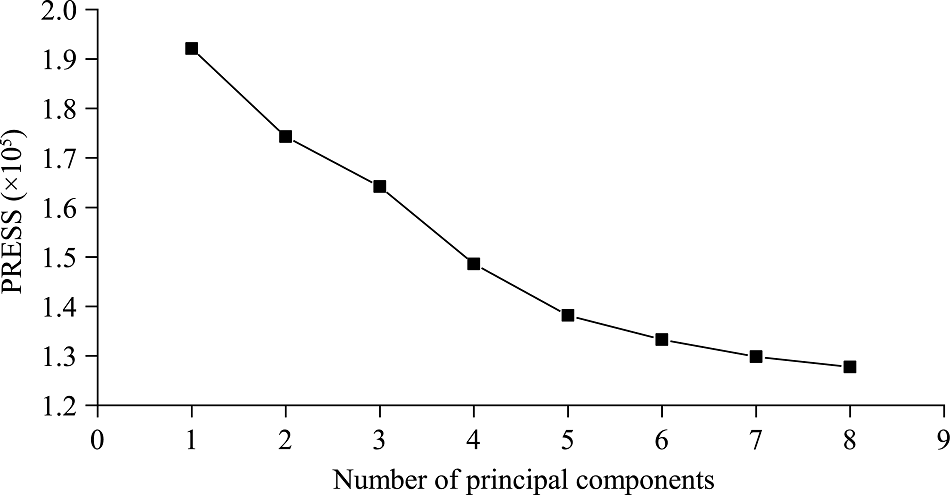
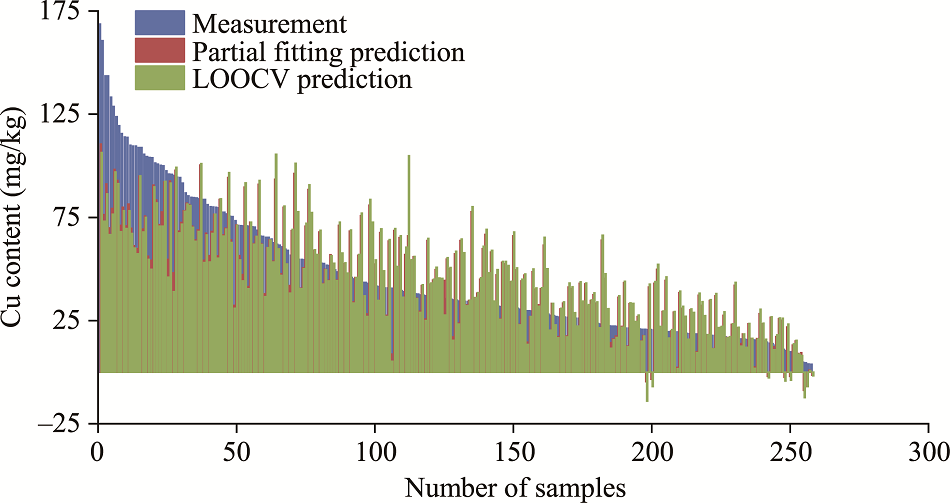
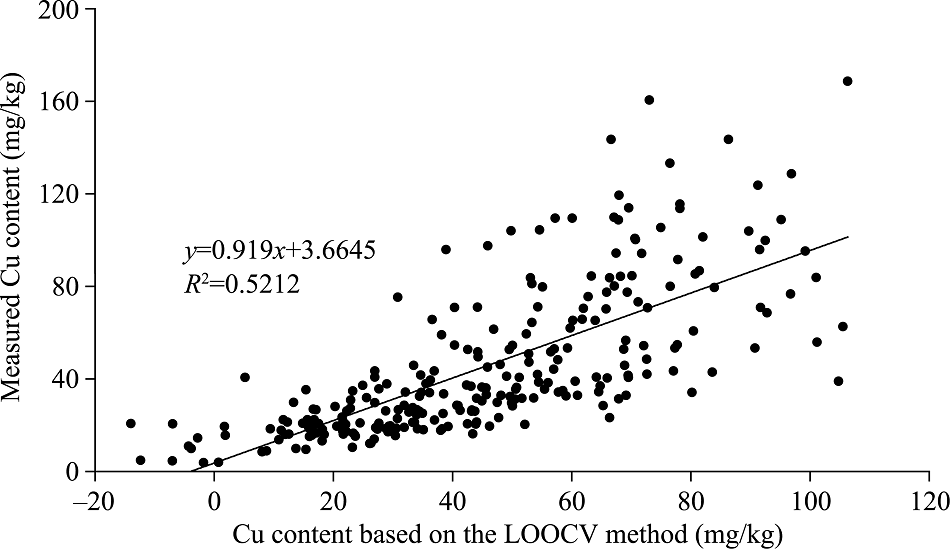
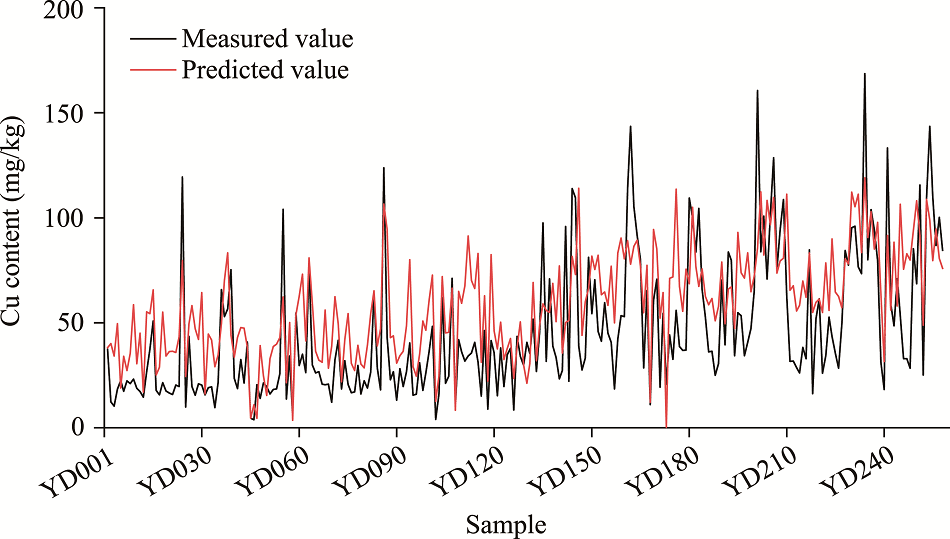
Abstract Hyperspectral remote sensing technology is widely used to detect element contents because of its multiple bands, high resolution, and abundant information. Although researchers have paid considerable attention to selecting the optimal bandwidth for the hyperspectral inversion of metal element contents in rocks, the influence of bandwidth on the inversion accuracy are ignored. In this study, we collected 258 rock samples in and near the Kalatage polymetallic ore concentration area in the southwestern part of Hami City, Xinjiang Uygur Autonomous Region, China and measured the ground spectra of these samples. The original spectra were resampled with different bandwidths. A Partial Least Squares Regression (PLSR) model was used to invert Cu contents of rock samples and then the influence of different bandwidths on Cu content inversion accuracy was explored. According to the results, the PLSR model obtains the highest Cu content inversion accuracy at a bandwidth of 35 nm, with the model determination coefficient (R2) of 0.5907. The PLSR inversion accuracy is relatively unaffected by the bandwidth within 5-80 nm, but the accuracy decreases significantly at 85 nm bandwidth (R2=0.5473), and the accuracy gradually decreased at bandwidths beyond 85 nm. Hence, bandwidth has a certain impact on the inversion accuracy of Cu content in rocks using the PLSR model. This study provides an indicator argument and theoretical basis for the future design of hyperspectral sensors for rock geochemistry.
|
|
Received: 30 October 2020
Published: 31 January 2022
|
|
Corresponding Authors:
* WANG Jinlin (E-mail: wangjinlin@ms.xjb.ac.cn)
|
| About author: First author contact: The third author and the seventh author contributed equally to this work. |
|
|
| [1] |
Ben-Dor E, Banin A. 1994. Visible and near-infrared (0.4-1.1 μm) analysis of arid and semi arid soils. Remote Sensing of Environment, 48(3):261-274.
doi: 10.1016/0034-4257(94)90001-9
|
|
|
| [2] |
Ben-Dor E. 2002. Quantitative remote sensing of soil properties. Advances in Agronomy, 75:173-243.
|
|
|
| [3] |
Cao X Z, Zhang W S, Sun H S. 2009. Progress in the study of deep exploration in China. Geological Science and Technology Information, 28(2):104-109. (in Chinese)
|
|
|
| [4] |
Cheng H, Wan Y, Chen Y Y, et al. 2018. Study on characteristics and mechanisms of visible near infrared reflectance spectra of soil heavy metals. Spectroscopy and Spectral Analysis, 38(3):771-778. (in Chinese)
|
|
|
| [5] |
Cong L J, Cen K, Yu X Z, et al. 2013. Relationship between spectral characteristics and geochemical composition of Zhulazhaga gold deposit. Journal of Central South University (Science and Technology), 44(1):266-274. (in Chinese)
|
|
|
| [6] |
Dian Y Y, Le Y, Fang S H, et al. 2016. Influence of spectral bandwidth and position on chlorophyll content retrieval at leaf and canopy levels. Journal of the Indian Society of Remote Sensing, 44:583-593.
doi: 10.1007/s12524-015-0537-2
|
|
|
| [7] |
Ge J M. 2017. Study on prospecting criteria and prediction methods of concealed ore-deposit. Western Resources, 4:27-28. (in Chinese)
|
|
|
| [8] |
Gitelson A A, Keydan G P, Merzlyak M N. 2006. Three-band model for noninvasive estimation of chlorophyll, carotenoids, and anthocyanin contents in higher plant leaves. Geophysical Research Letters, 33(11):L11402, doi: 10.1029/2006GL026457.
doi: 10.1029/2006GL026457
|
|
|
| [9] |
Gong S Q, Wang X, Shen R P, et al. 2010. Study on heavy metal content in the coastal saline soil by hyperspectral remote sensing. Remote Sensing Technology and Application, 25(2):169-177. (in Chinese)
|
|
|
| [10] |
Hecker C, van Ruitenbeek F J A, van der Werff H M A, et al. 2019. Spectral absorption feature analysis for finding ore: a tutorial on using the method in geological remote sensing. IEEE Geoscience and Remote Sensing Magazine, 7(2):51-71.
doi: 10.1109/MGRS.6245518
|
|
|
| [11] |
Huang C P, Liu B, Zhang X, et al. 2010. Study on band selection and optimal spectral resolution for prediction of Cu contamination in soils. Remote Sensing Technology and Application, 25(3):353-341, 357. (in Chinese)
|
|
|
| [12] |
Hunt G R. 1977. Spectral signatures of particulate minerals in the visible and near infrared. Geophysics, 42(3):501-513.
doi: 10.1190/1.1440721
|
|
|
| [13] |
Islam K, Singh B, McBratney A. 2003. Simultaneous estimation of several soil properties by ultra-violet, visible and near-infrared reflectance spectroscopy. Australian Journal of Soil Research, 41:1101-1114.
|
|
|
| [14] |
Kawamura K, Watanabe N, Sakanoue S, et al. 2010. Testing genetic algorithm as a tool to select relevant wavebands from field hyperspectral data for estimating pasture mass and quality in a mixed sown pasture using partial least squares regression. Grassland Science, 56(4):205-216.
doi: 10.1111/grs.2010.56.issue-4
|
|
|
| [15] |
Kemper T, Sommer S. 2002. Estimate of heavy metal contamination in soils after a mining accident using reflectance spectroscopy. Environmental Science & Technology, 36(12):2742-2747.
doi: 10.1021/es015747j
|
|
|
| [16] |
Liu M, Lin Q Z, Wang Q J, et al. 2010. Study on the geochemical anomaly of copper element based on reflectance spectra. Spectroscopy and Spectral Analysis, 30(5):1320-1323. (in Chinese)
|
|
|
| [17] |
Liu W D. 2002. Study on extraction of soil information and data mining by hyperspectral remote sensing. PhD Dissertation. Beijing: Institute of Remote Sensing Applications Chinese Academy of Sciences. (in Chinese)
|
|
|
| [18] |
Liu Y H, Wang Q Q, Gao X W, et al. 2019. Total phenolic content prediction in Flos Lonicerae using hyperspectral imaging combined with wavelengths selection methods. Journal of Food Process Engineering, 42(6):e13224, doi: 10.1111/jfpe.13224.
doi: 10.1111/jfpe.13224
|
|
|
| [19] |
Long L L, Wang J B, Wang Y W, et al. 2016. Discussion on the age of ore-host volcanic strata in the Kalatage ore concentration area, eastern Tianshan: Evidence of SHRIMP zircon U-Pb dating. Mineral Exploration, 7(1):31-37. (in Chinese)
|
|
|
| [20] |
Mao Q G, Wang J B, Fang T H, et al. 2017. Discovery of the Middle Devonian yudai porphyric Cu (Au) deposit in the Kalatage area of eastern Tianshan Mountain, Xinjiang and its geological prospecting significance. Geology and Exploration, 53(1):1-11. (in Chinese)
|
|
|
| [21] |
Peng Y, Gitelson A A, Keydan G, et al. 2011. Remote estimation of gross primary production in maize and support for a new paradigm based on total crop chlorophyll content. Remote Sensing of Environment, 115(4):978-989.
doi: 10.1016/j.rse.2010.12.001
|
|
|
| [22] |
Wang H W, Wu Z B, Meng J. 2006. Partial Least-Squares Regression—Liner and Nonliner Methods. Beijing: National Defense Industry Press, 97-98. (in Chinese)
|
|
|
| [23] |
Wang L, Lin Q Z, Jia D, et al. 2007. Study on the prediction of soil heavy metal elements content based on reflectance spectra. Journal of Remote Sensing, 11(6):906-913. (in Chinese)
|
|
|
| [24] |
Wang W, Peng Y K, Ma W, et al. 2010. Prediction of chlorophyll content of winter wheat using leaf level hyperspectral data. Transactions of the Chinese Society of Agricultural Machinery, 41(5):172-177. (in Chinese)
|
|
|
| [25] |
Wellburn A R. 1994. The spectral determination of chlorophylls a and b, as well as total carotenoids, using various solvents with spectrophotometers of different resolution. Journal of Plant Physiology, 144(3):307-313.
doi: 10.1016/S0176-1617(11)81192-2
|
|
|
| [26] |
Wold S, Albano C, Dunn III W J, et al. 1984. Multivariate data analysis in chemistry. In: Kowalski B R. Chemometrics. NATO ASI Series (Series C: Mathematical and Physical Sciences). Dordrecht: Springer, 17-95.
|
|
|
| [27] |
Wu Y Z, Chen J, Ji J F, et al. 2007. A mechanism study of reflectance spectroscopy for investigating heavy metals in soils. Soil Science Society of America Journal, 71(3):918-926.
doi: 10.2136/sssaj2006.0285
|
|
|
| [28] |
Xu Y J, Wang L. 2011. The importance of mineral resources. Science & Technology Communication, (19):62-83. (in Chinese)
|
|
|
| [29] |
Yang C B, Liu N, Zhou Z C, et al. 2017. Research on the relationship between main rock metal element content, physical parameters and spectral features in Tahe Area. Spectroscopy and Spectral Analysis, 37(8):2569-2574. (in Chinese)
|
|
|
| [30] |
Yu M J, Wang J B, Mao Q G, et al. 2016. Pyroelectricitical characteristics of pyrite form the No. M1 orebody in Meiling copper-gold deposit and its geological significance in the Kalatage area, eastern Tianshan. Mineral Exploration, 7(1):149-156. (in Chinese)
|
|
|
| [31] |
Zarco-Tejada P J, Miller J R, Noland T L, et al. 2001. Scaling-up and model inversion methods with narrowband optical indices for chlorophyll content estimation in closed forest canopies with hyperspectral data. IEEE Transactions on Geoscience and Remote Sensing, 39(7):1491-1507.
doi: 10.1109/36.934080
|
|
|
| [32] |
Zhao D H, Huang L M, Li J L, et al. 2007. A comparative analysis of broadband and narrowband derived vegetation indices in predicting LAI and CCD of a cotton canopy. ISPRS Journal of Photogrammetry and Remote Sensing, 62(1):25-33.
doi: 10.1016/j.isprsjprs.2007.01.003
|
|
|
| [33] |
Zhou S G, Liao S B, Zhou K F, et al. 2018. Application of portable X-ray fluorescence spectrometer in the analysis of rock samples. Rock and Mineral Analysis, 37(1):56-63. (in Chinese)
|
|
|
|
Viewed |
|
|
|
Full text
|
|
|
|
|
Abstract
|
|
|
|
|
Cited |
|
|
|
|
| |
Shared |
|
|
|
|
| |
Discussed |
|
|
|
|