| Research article |
|


|
|
|
| Integrated water risk early warning framework of the semi-arid transitional zone based on the water environmental carrying capacity (WECC) |
XIE Yuxi1, ZENG Weihua1,2,*( ), QIU Jie3,*() ), QIU Jie3,*() |
1School of Environment, Beijing Normal University, Beijing 100875, China
2Northwest Institute of Plateau Biology, Chinese Academy of Sciences, Qinghai 810008, China
3Nanjing Institute of Environmental Sciences, Ministry of Ecology and Environment, Nanjing 210042, China |
|
|
|
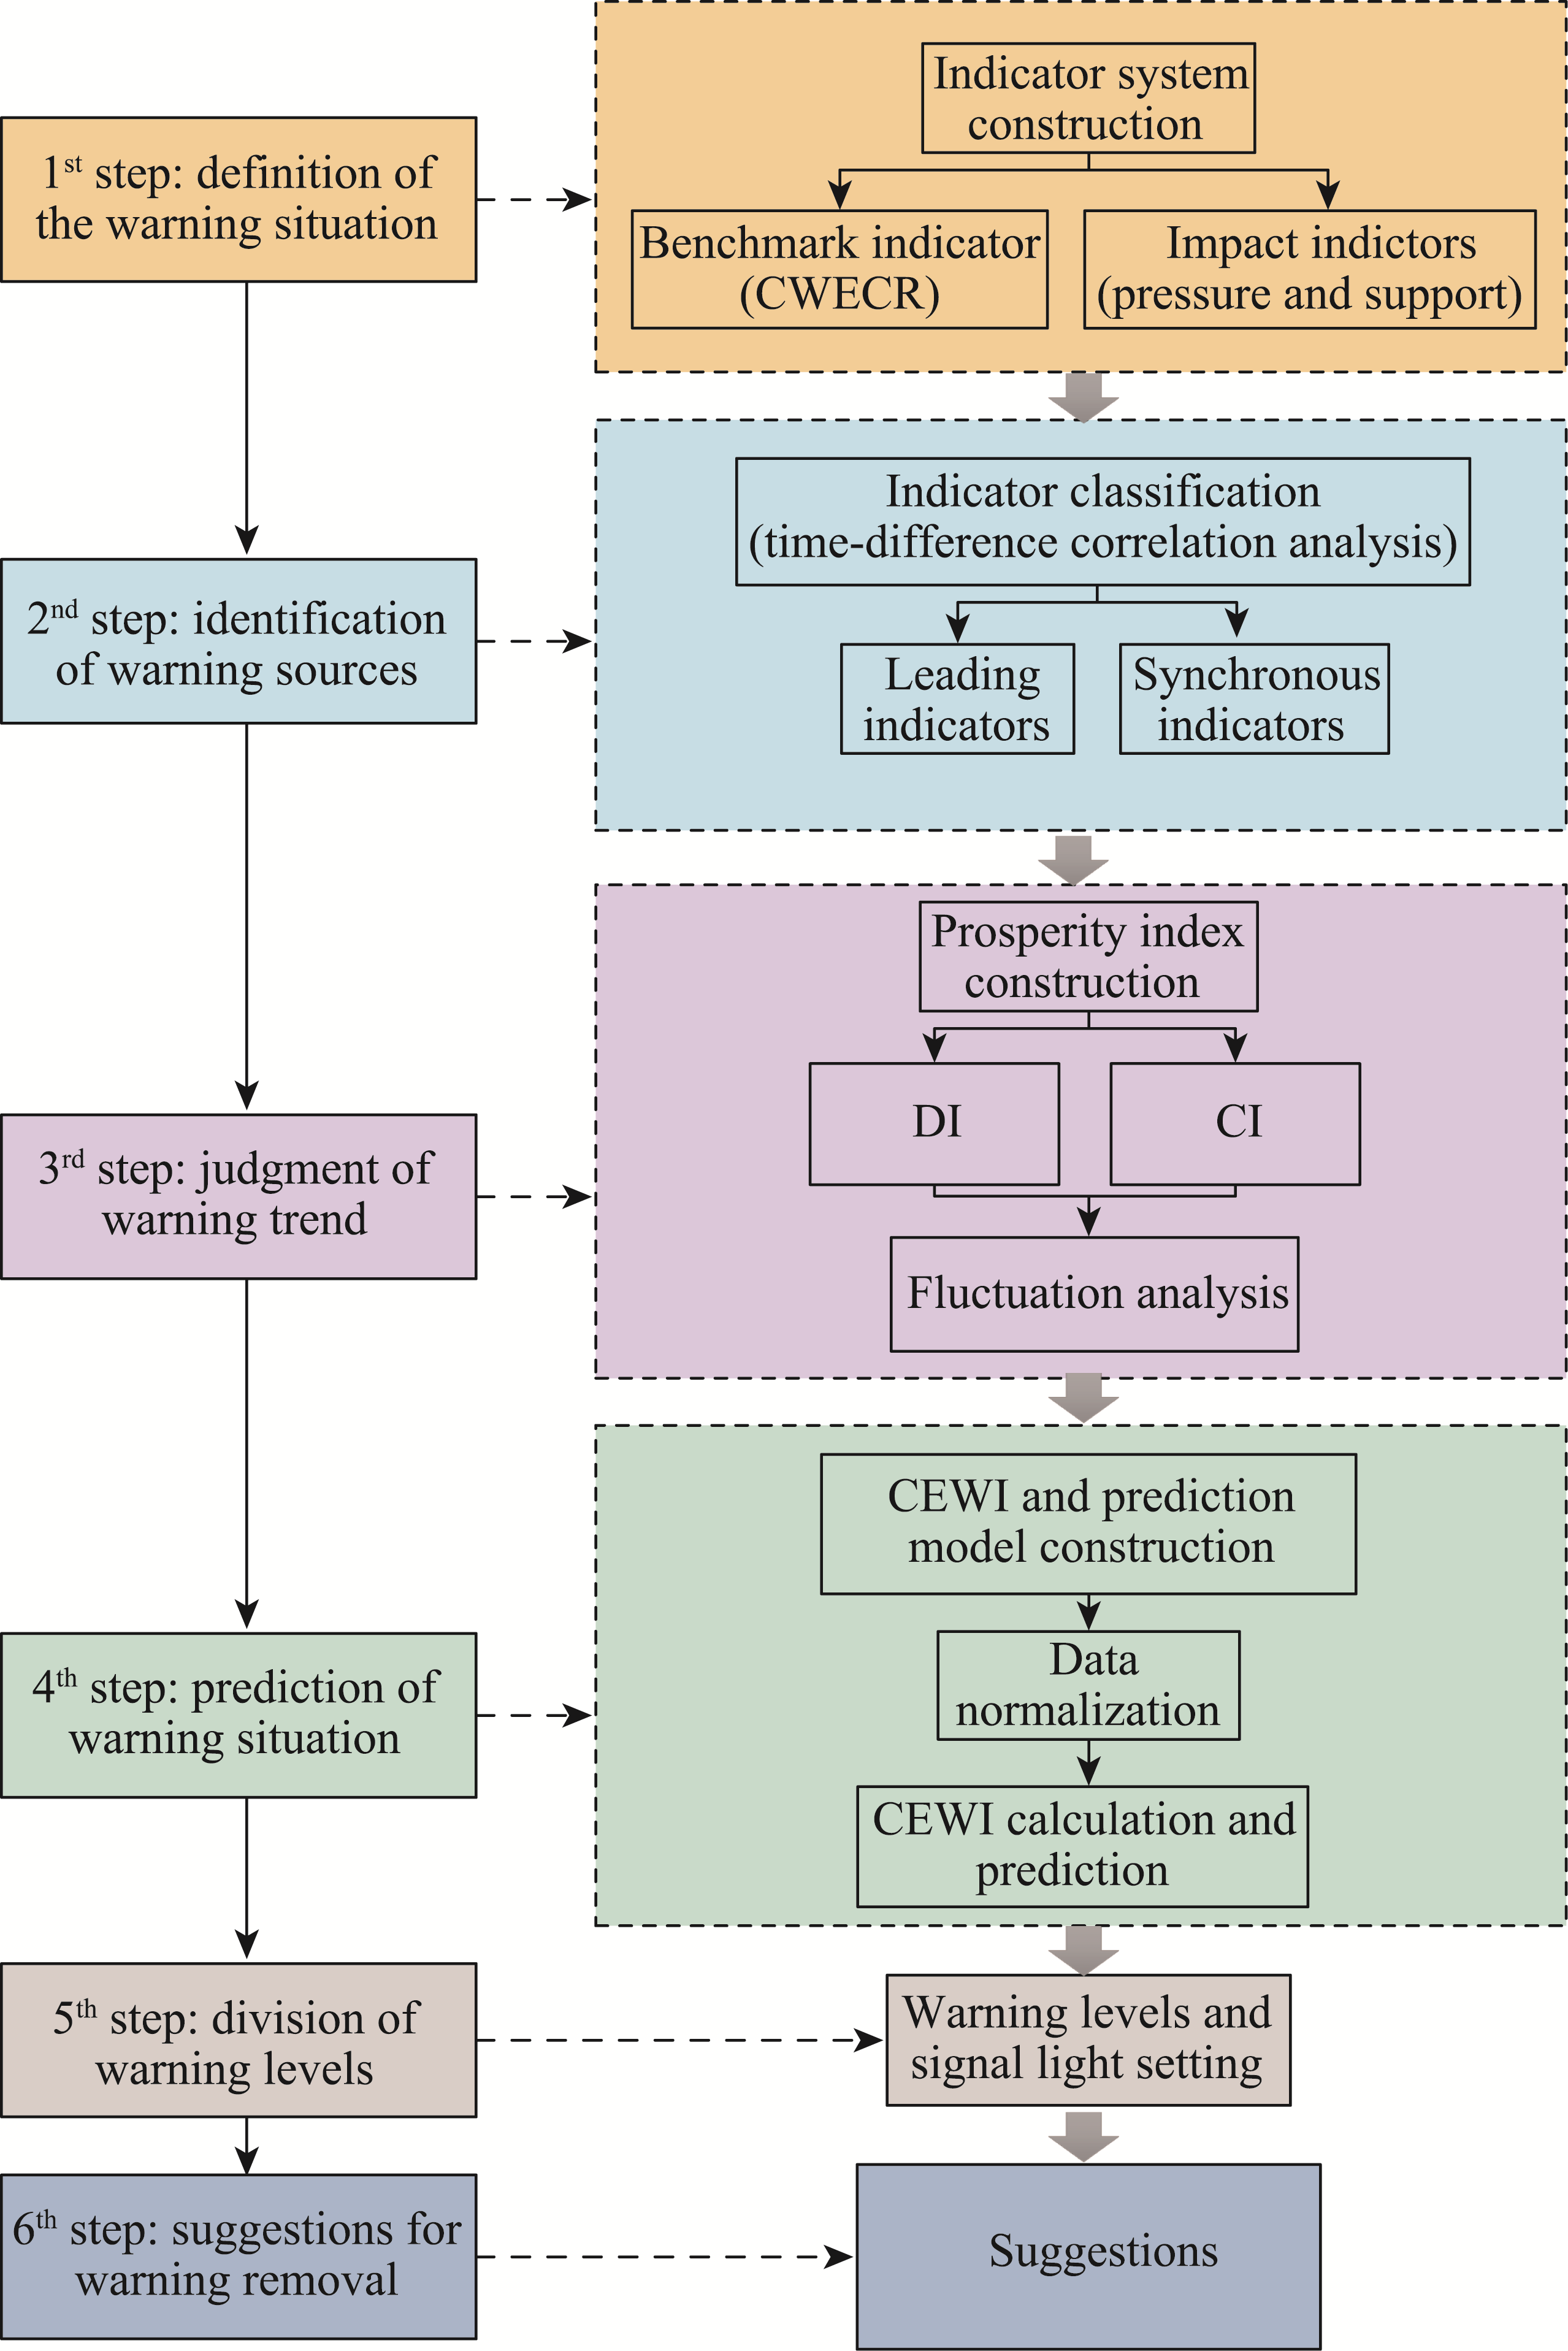
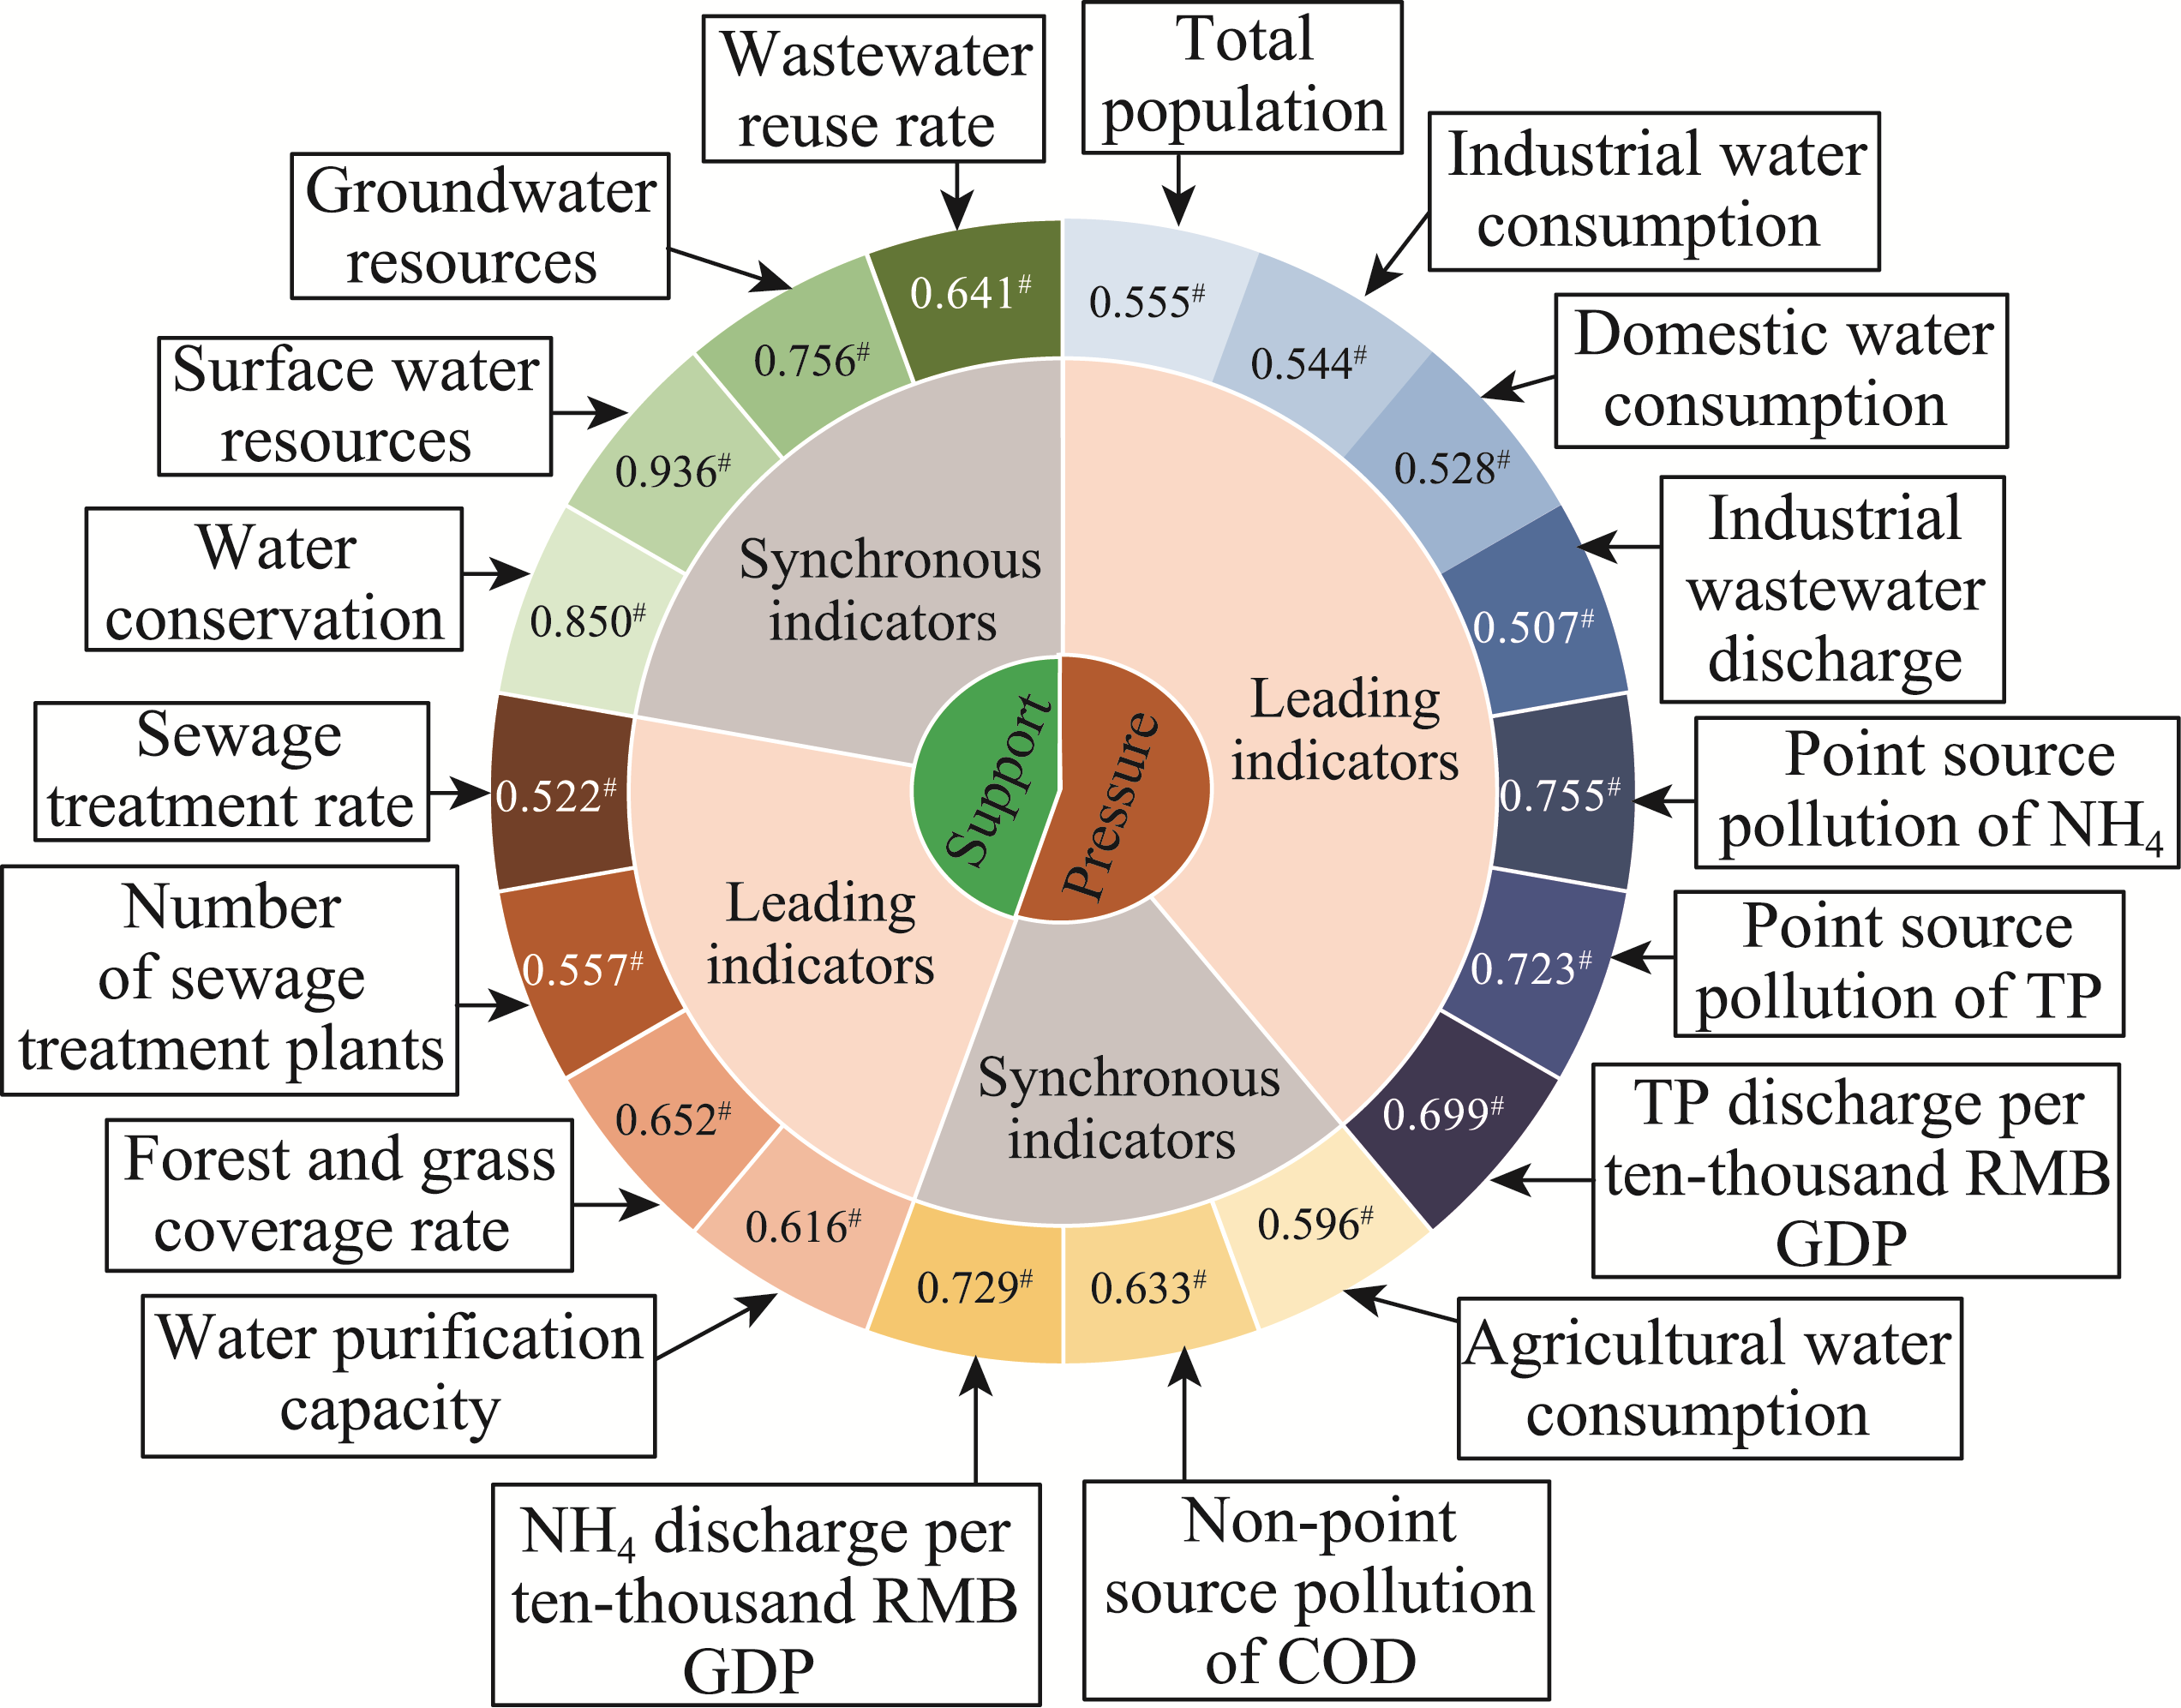
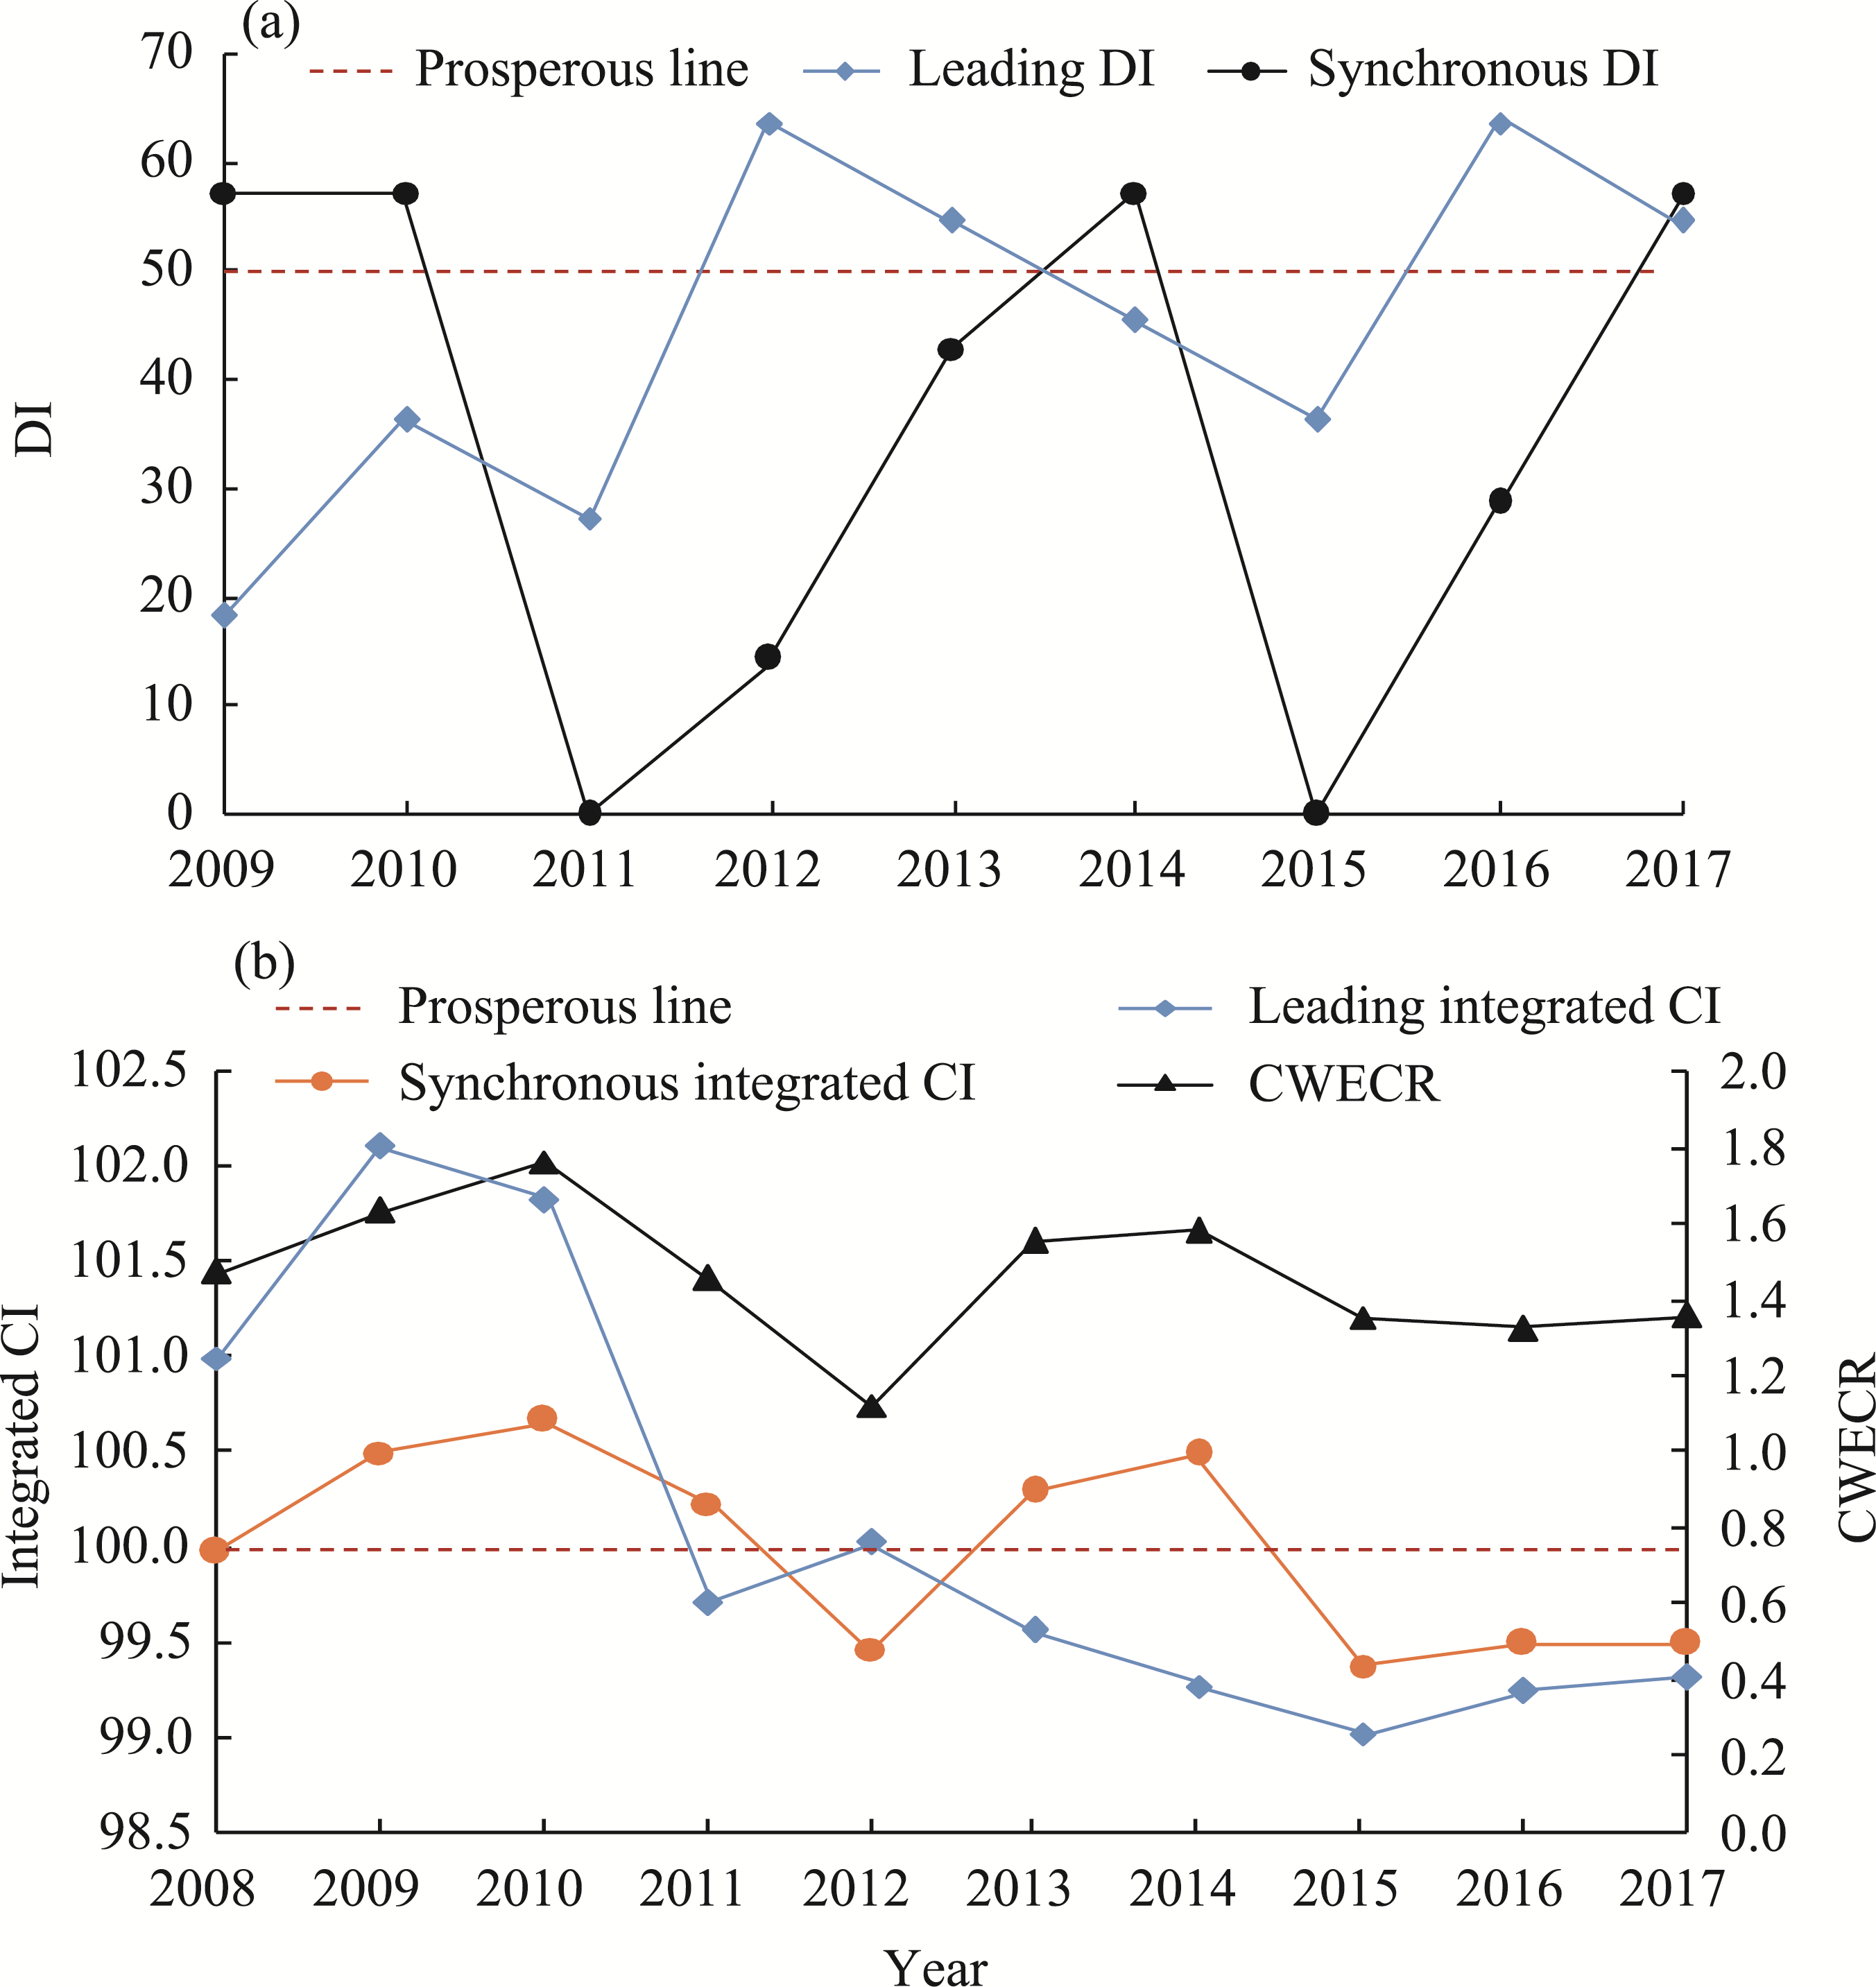
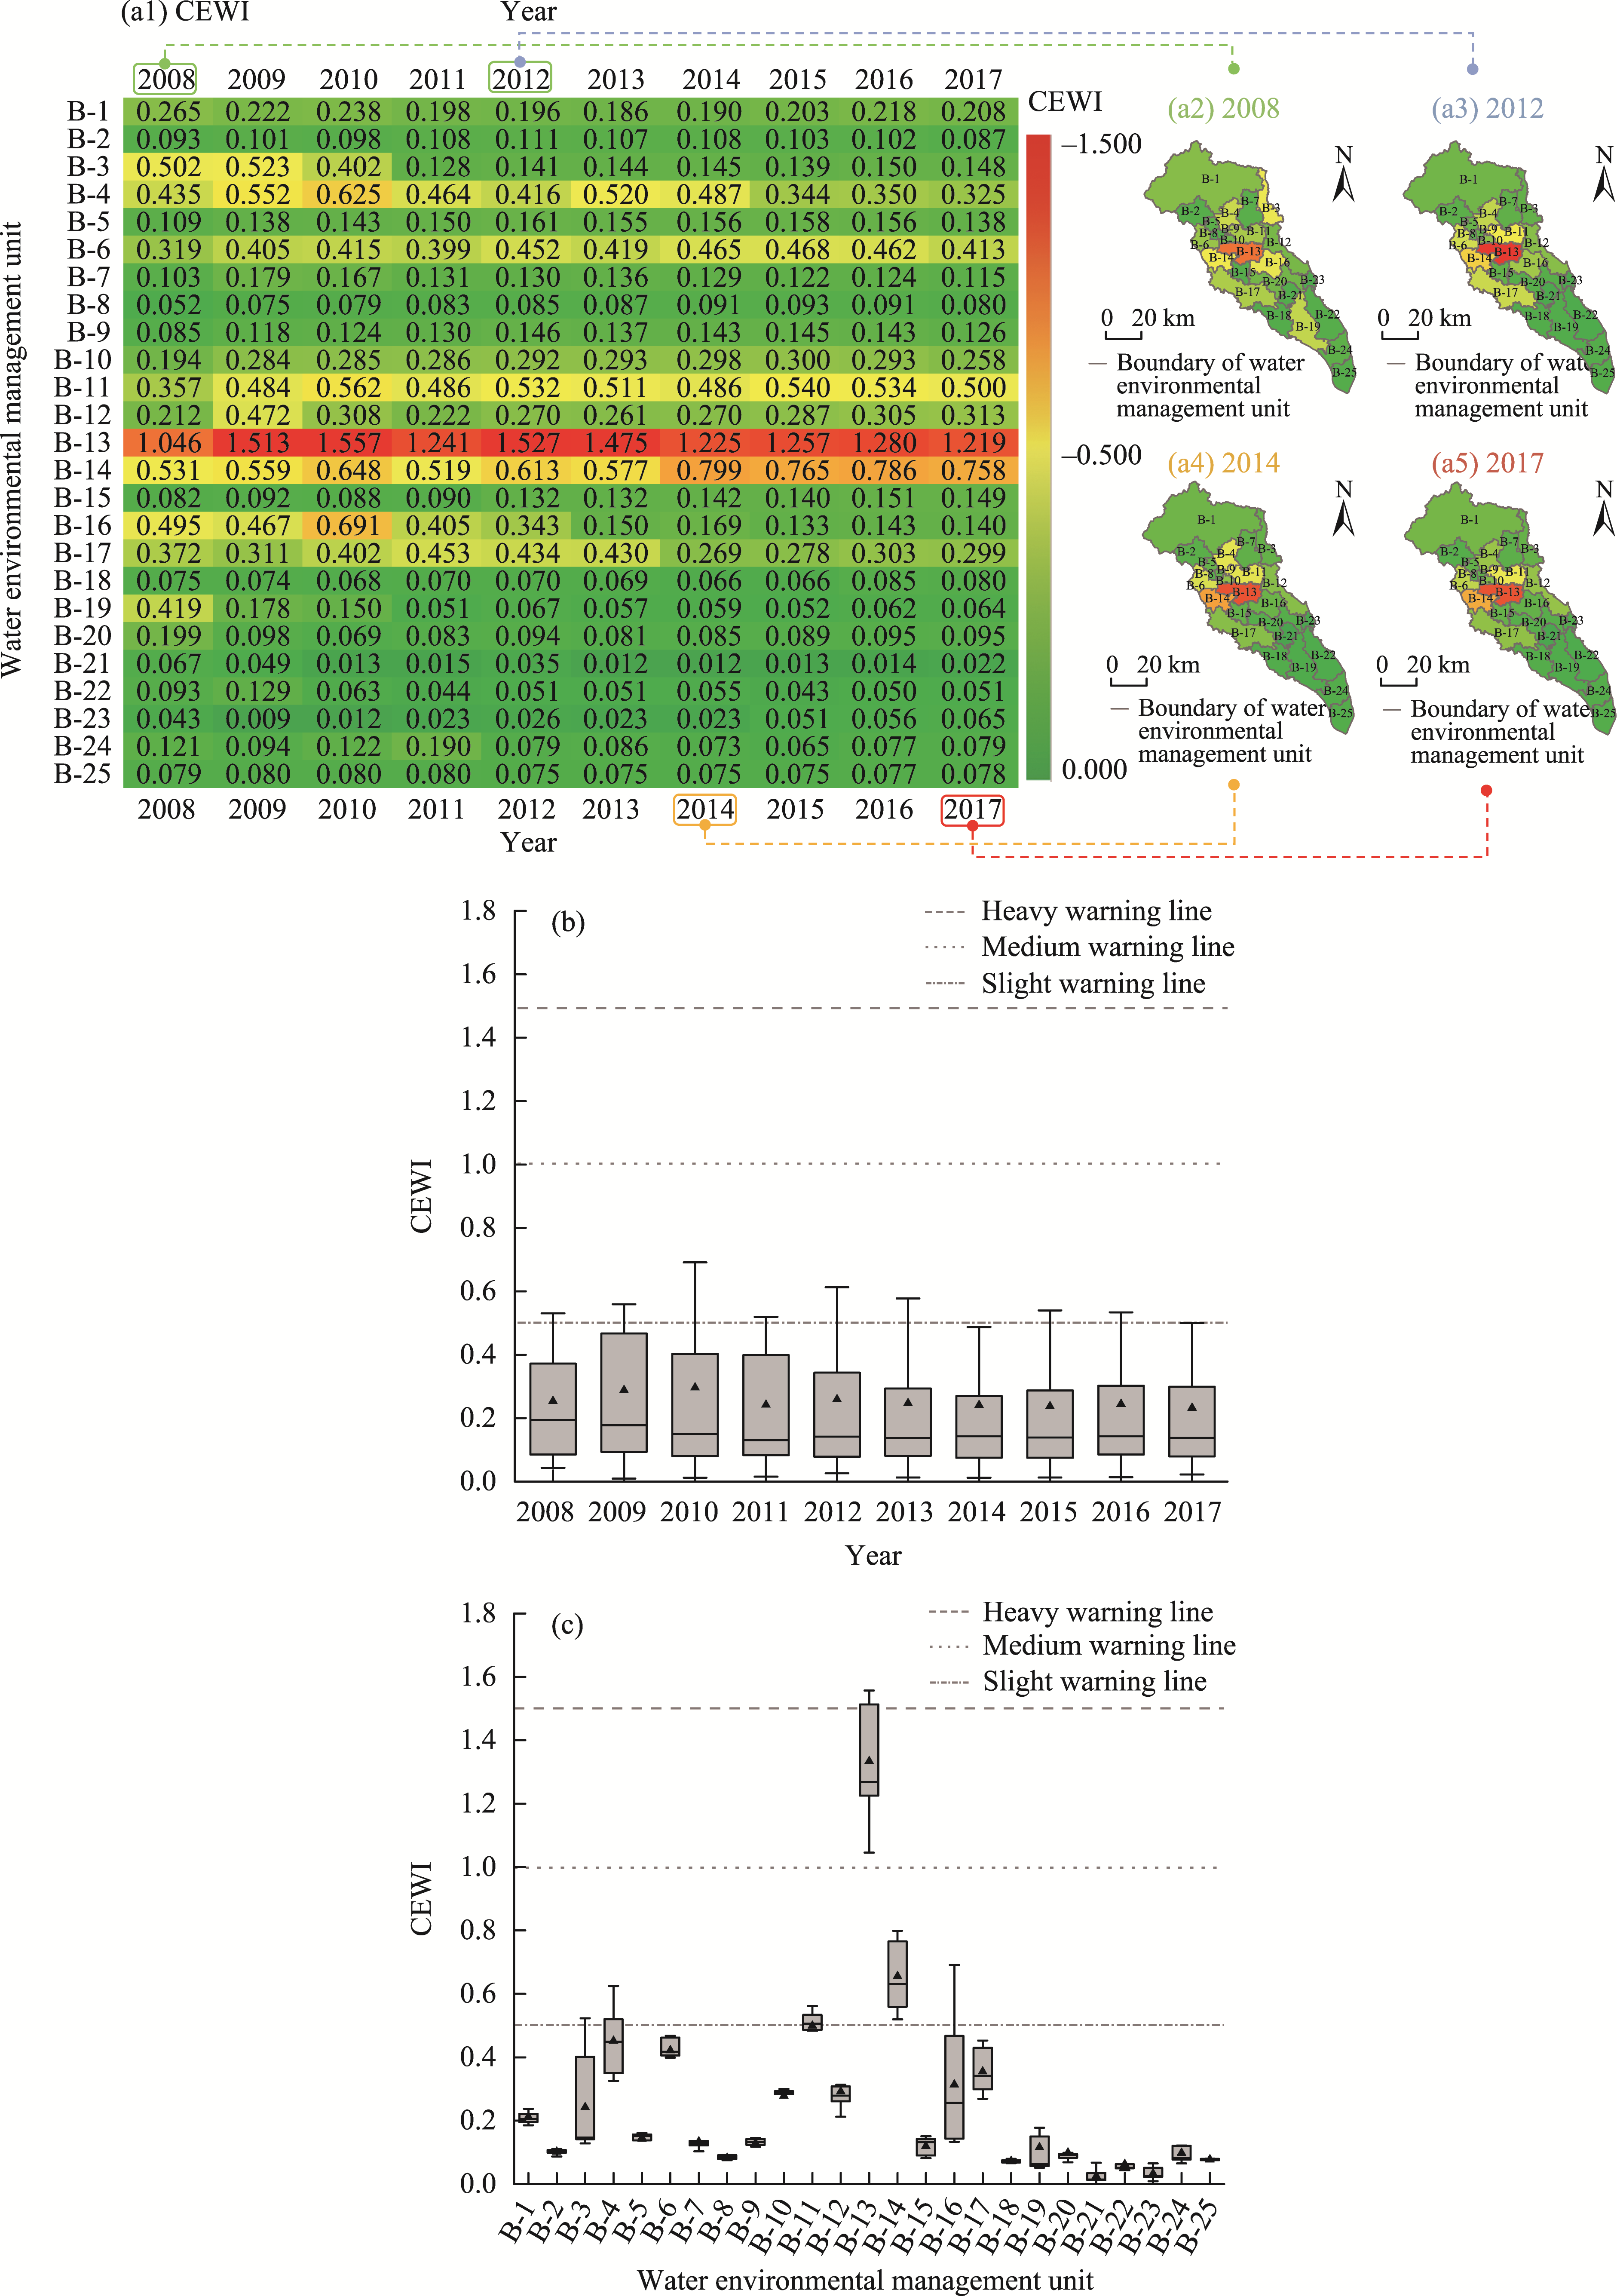
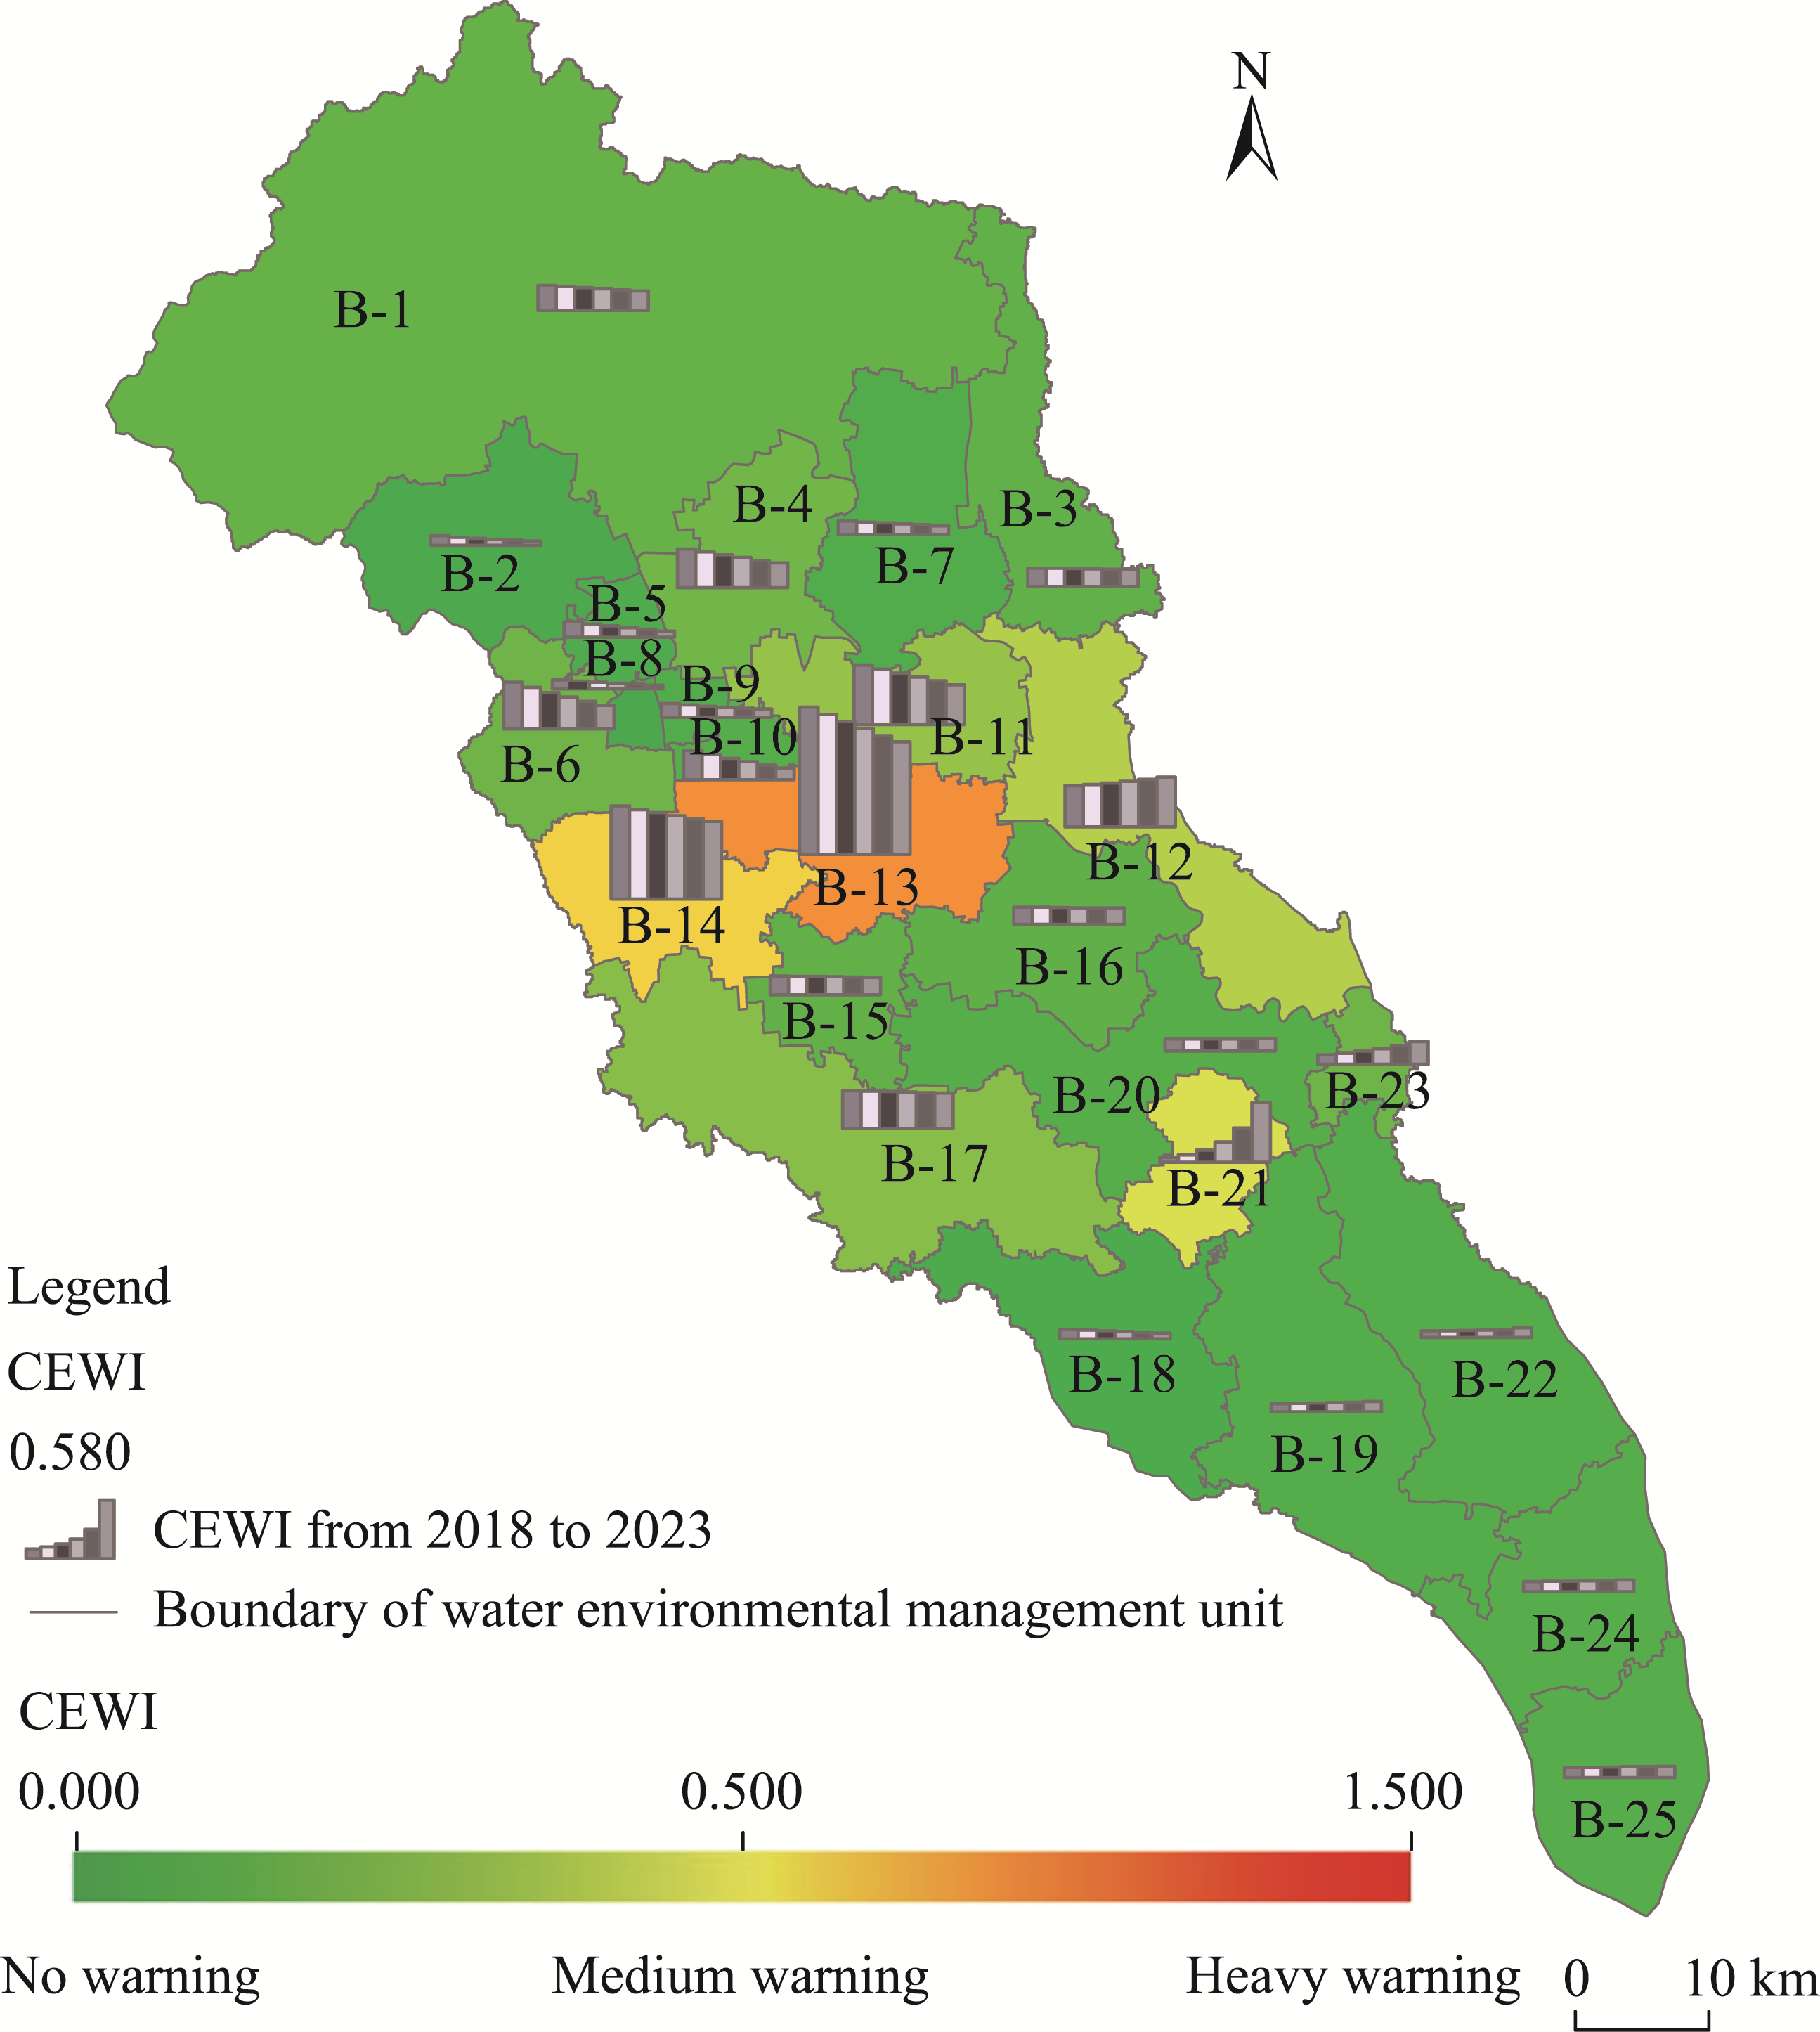
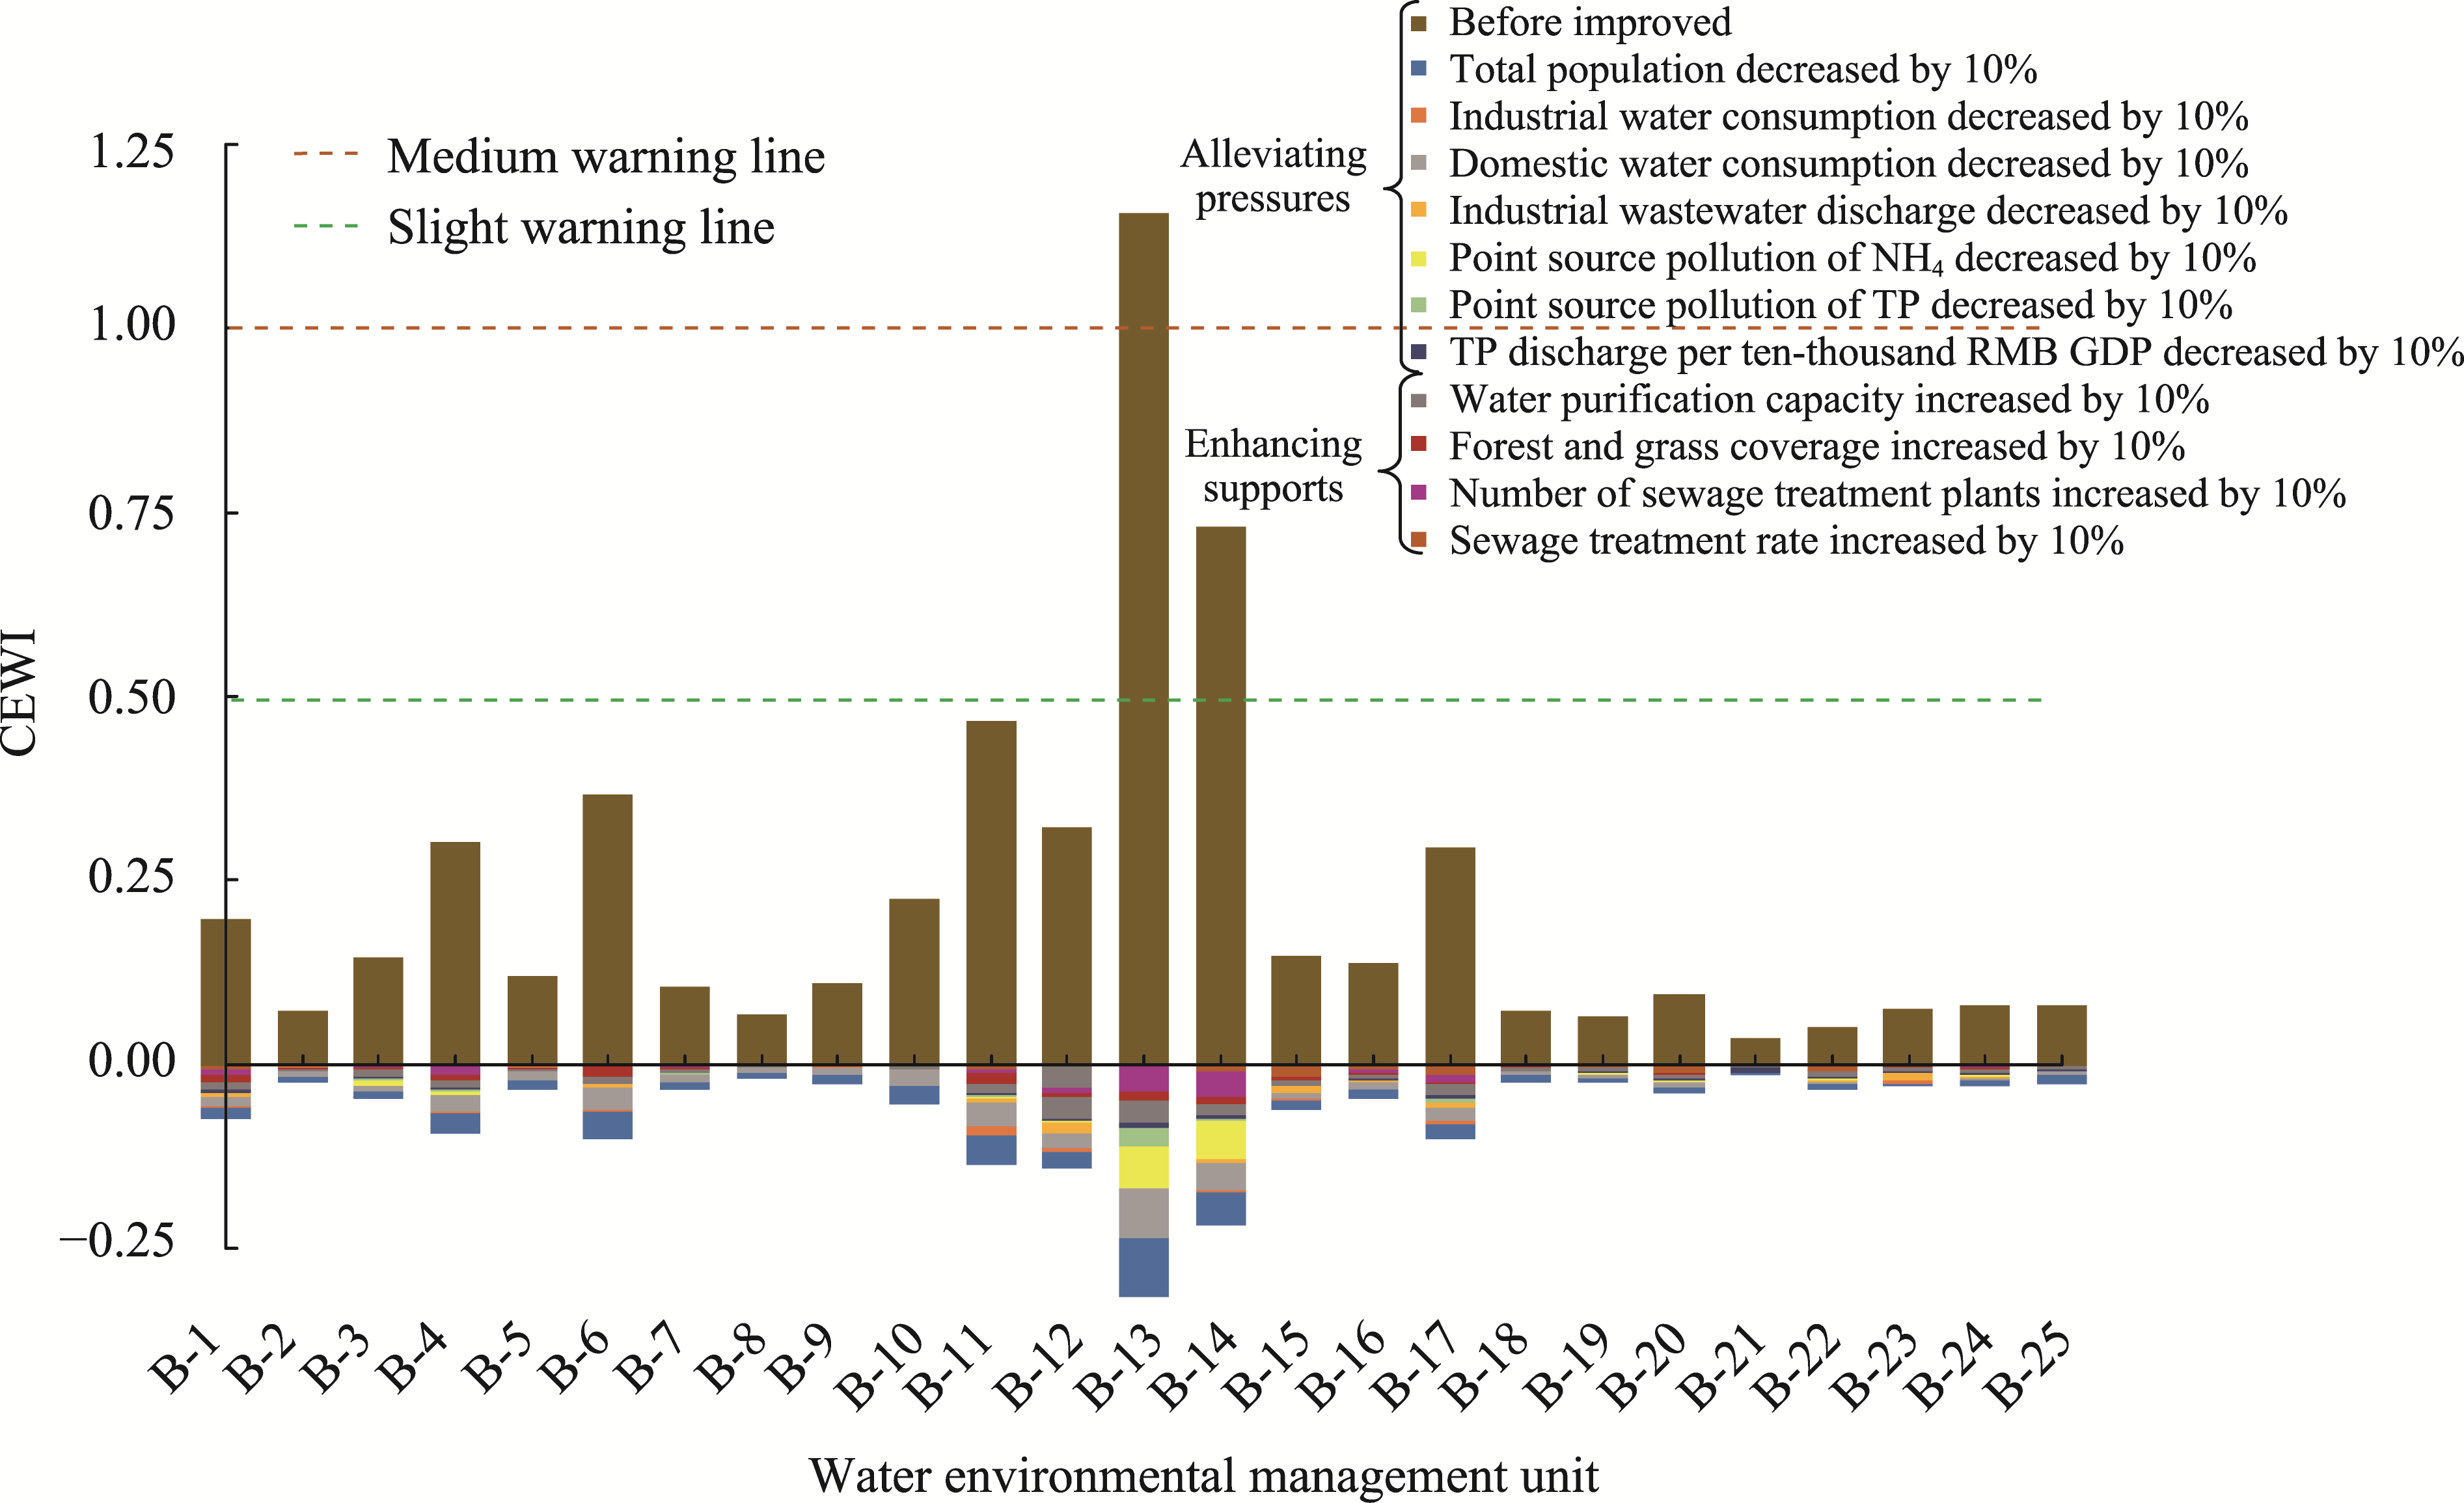
Abstract Water risk early warning systems based on the water environmental carrying capacity (WECC) are powerful and effective tools to guarantee the sustainability of rivers. Existing work on the early warning of WECC has mainly concerned the comprehensive evaluation of the status quo and lacked a quantitative prejudgement and warning of future overload. In addition, existing quantitative methods for short-term early warning have rarely focused on the integrated change trends of the early warning indicators. Given the periodicity of the socioeconomic system, however, the water environmental system also follows a trend of cyclical fluctuations. Thus, it is meaningful to monitor and use this periodicity for the early warning of the WECC. In this study, we first adopted and improved the prosperity index method to develop an integrated water risk early warning framework. We also constructed a forecast model to qualitatively and quantitatively prejudge and warn about the development trends of the water environmental system. We selected the North Canal Basin (an essential connection among the Beijing- Tianjin-Hebei region) in China as a case study and predicted the WECC in 25 water environmental management units of the basin in 2018-2023. We found that the analysis of the prosperity index was helpful in predicting the WECC, to some extent. The result demonstrated that the early warning system provided reliable prediction (root mean square error of 0.0651 and mean absolute error of 0.1418), and the calculation results of the comprehensive early warning index (CEWI) conformed to the actual situation and related research in the river basin. From 2008 to 2023, the WECC of most water environmental management units in the basin had improved but with some spatial differences: the CEWI was generally poor in areas with many human disturbances, while it was relatively good in the upstream regions with higher forest and grass covers as well as in the downstream areas with larger water volume. Finally, through a sensitivity analysis of the indicators, we proposed specific management measures for the sustainability of the water environmental system in the North Canal Basin. Overall, the integrated water risk early warning framework could provide an appropriate method for the water environmental administration department to predict the WECC of the basin in the future. This framework could also assist in implementing corresponding management measures in advance, especially for the performance evaluation and the arrangement of key short-term tasks in the River Chief System in China.
|
|
Received: 25 July 2022
Published: 28 February 2023
|
|
Corresponding Authors:
*ZENG Weihua (E-mail: zengwh@bnu.edu.cn);QIU Jie (E-mail: qiujie@nies.org)
|
|
|
| [1] |
Bafarasat A Z. 2021. Is our urban water system still sustainable? A simple statistical test with complexity science insight. Journal of Environmental Management, 280: 111748, doi: 10.1016/j.jenvman.2020.111748.
doi: 10.1016/j.jenvman.2020.111748
|
|
|
| [2] |
Bai W R, Gu H, Ji L N, et al. 2018. Experimental study on joint regulation of water quality and quantity in the lower reaches of the North canal. Beijing Water, (6): 20-24. (in Chinese)
|
|
|
| [3] |
Beijing Municipal Bureau Statistics. 2009-2018. Beijing Regional Statistical Yearbook. Beijing: China Statistics Press. (in Chinese)
|
|
|
| [4] |
Beijing Municipal Bureau Statistics. 2021. Beijing Regional Statistical Yearbook. Beijing: China Statistics Press. (in Chinese)
|
|
|
| [5] |
Beijing Municipal Ecology and Environment Bureau. 2017-2019. Beijing Ecological and Environment Statement (2017-2019). [2021-03-02]. http://sthjj.beijing.gov.cn/. (in Chinese)
|
|
|
| [6] |
Beijing Municipal Ecology and Environment Bureau. 2020. Beijing Ecological and Environment Statement (2020). [2022-02-16]. http://sthjj.beijing.gov.cn/. (in Chinese)
|
|
|
| [7] |
Beijing Water Authority. 2008-2017. Beijing Water Resources Bulletin (2008-2017). [2021-03-02]. http://swj.beijing.gov.cn/zwgk/szygb/. (in Chinese)
|
|
|
| [8] |
Beijing Water Authority. 2020. Beijing Water Resources Bulletin (2020). [2022-02-16]. http://swj.beijing.gov.cn/zwgk/szygb/. (in Chinese)
|
|
|
| [9] |
Cao R X, Zhang K X, Zeng W H, et al. 2021. Research on the early-warning method of water environment carrying capacity based on BP neural network: A case study of Beiyunhe River Basin. Acta Scientiae Circumstantiae, 41(5): 2005-2017. (in Chinese)
|
|
|
| [10] |
Chen L Y, Li C F, Li S Y. 2011. Measurement and prospect of China's price boom-based on the analysis of constructing the price boom diffusion index. Price: Theory and Practice, (5): 53-54. (in Chinese)
|
|
|
| [11] |
Chen W T, Xia Q, Su J, et al. 2022. Evaluation and early warning of water environmental carrying capacity in Baiyangdian basin based on time-difference correlation analysis and fuzzy neural network. Environmental Engineering, 40(6): 261-271. (in Chinese)
|
|
|
| [12] |
Dai D, Sun M D, Lv X B, et al. 2022. Comprehensive assessment of the water environment carrying capacity based on the spatial system dynamics model, a case study of Yongding River Basin in North China. Journal of Cleaner Production, 344: 131137, doi: 10.1016/j.jclepro.2022.131137.
doi: 10.1016/j.jclepro.2022.131137
|
|
|
| [13] |
Department of Water Resources of Hebei Province. 2008-2017. Hebei Water Resources Bulletin (2008-2017). [2021-03-02]. http://slt.hebei.gov.cn/. (in Chinese)
|
|
|
| [14] |
Ding X W, Zhang J J, Jiang G H, et al. 2017. Early warning and forecasting system of water quality safety for drinking water source areas in three gorges reservoir area, China. Water, 9(7): 465, doi: 10.3390/w9070465.
doi: 10.3390/w9070465
|
|
|
| [15] |
Hebei Provincial Bureau of Statistics. 2008-2017. Hebei Rural Statistical Yearbook. Beijing: China Statistics Press. (in Chinese)
|
|
|
| [16] |
Hebei Provincial Bureau of Statistics. 2009-2018. Hebei Statistical Yearbook. Beijing: China Statistics Press. (in Chinese)
|
|
|
| [17] |
Hebei Provincial Bureau of Statistics. 2021. Hebei Statistical Yearbook. Beijing: China Statistics Press. (in Chinese)
|
|
|
| [18] |
Imani M, Hasan M M, Bittencourt L F, et al. 2021. A novel machine learning application: water quality resilience prediction model. Science of The Total Environment, 768: 144459, doi: 10.1016/j.scitotenv.2020.144459.
doi: 10.1016/j.scitotenv.2020.144459
|
|
|
| [19] |
Ji L N, Liu Z J. 2021. The practice process of aquatic ecological environment protection and restoration of North Canal. Beijing Water, (3): 17-21. (in Chinese)
|
|
|
| [20] |
Jin T, Cai S B, Jiang D X, et al. 2019. A data-driven model for real-time water quality prediction and early warning by an integration method. Environmental Science and Pollution Research, 26: 30374-30385.
doi: 10.1007/s11356-019-06049-2
|
|
|
| [21] |
Kang P, Xu L Y. 2012. Water environmental carrying capacity assessment of an industrial park. Procedia Environmental Sciences, 13: 879-890.
doi: 10.1016/j.proenv.2012.01.082
|
|
|
| [22] |
Karunasingha D S K. 2022. Root mean square error or mean absolute error? Use their ratio as well. Information Sciences, 585: 609-629.
doi: 10.1016/j.ins.2021.11.036
|
|
|
| [23] |
Knedlik T. 2014. The impact of preferences on early warning systems—The case of the European Commission's Scoreboard. European Journal of Political Economy, 34: 157-166.
doi: 10.1016/j.ejpoleco.2014.01.008
|
|
|
| [24] |
Langfang Municipal Bureau Statistics. 2009-2018. Langfang Economic Statistical Yearbook. Beijing: China Statistics Press. (in Chinese)
|
|
|
| [25] |
Li Y J, Liu C Y. 2016. Principle and Application of Multivariate Analysis. Beijing: Economic Science Press, 94-107. (in Chinese)
|
|
|
| [26] |
Liao R K, Hu J Y, Li Y K, et al. 2020. Phosphorus transport in riverbed sediments and related adsorption and desorption characteristics in the Beiyun River, China. Environmental Pollution, 266: 115153, doi: 10.1016/j.envpol.2020.115153.
doi: 10.1016/j.envpol.2020.115153
|
|
|
| [27] |
Liu D, Wang X, Zeng W H, et al. 2019. Research on overload warning of water environment carrying capacity based on ARMA model. Water Resources Protection, 35(1): 52-55, 69. (in Chinese)
|
|
|
| [28] |
Liu J, Shen Z Y, Chen L. 2018. Assessing how spatial variations of land use pattern affect water quality across a typical urbanized watershed in Beijing, China. Landscape and Urban Planning, 176: 51-63.
doi: 10.1016/j.landurbplan.2018.04.006
|
|
|
| [29] |
Liu J, Yan T Z, Shen Z Y. 2021. Sources, transformations of suspended particulate organic matter and their linkage with landscape patterns in the urbanized Beiyun river watershed of Beijing, China. Science of The Total Environment, 791: 148309, doi: 10.1016/j.scitotenv.2021.148309.
doi: 10.1016/j.scitotenv.2021.148309
|
|
|
| [30] |
Liu X J, Pan Y, Zhang W H, et al. 2019. Achieve sustainable development of rivers with water resource management - economic model of river chief system in China. Science of The Total Environment, 708: 134657, doi: 10.1016/j.scitotenv.2019.134657.
doi: 10.1016/j.scitotenv.2019.134657
|
|
|
| [31] |
Local Chronicles Office of Beichen District. 2015- 2017. Yearbook of Tianjin Beichen. Changchun: Jilin People's Publishing House. (in Chinese)
|
|
|
| [32] |
Local Chronicles Office of Wuqing District.2015- 2017. Yearbook of Wuqing. Tianjin: Local Chronicles Editing Committee Office of Wuqing District of Tianjin. (in Chinese)
|
|
|
| [33] |
Lu J H, Tang D S. 2019. Study on water resources bearing capacity early warning based on PSR and matter-element extension model. Water Resources and Hydropower Engineering, 50(1): 58-64. (in Chinese)
|
|
|
| [34] |
Lu Y, Xu H W, Wang Y X, et al. 2017. Evaluation of water environmental carrying capacity of city in Huaihe River Basin based on the AHP method: A case in Huai'an City. Water Resources and Industry, 18: 71-77.
doi: 10.1016/j.wri.2017.10.001
|
|
|
| [35] |
Maier H R, Jain A, Dandy G C, et al. 2010. Methods used for the development of neural networks for the prediction of water resource variables in river systems: Current status and future directions. Environmental Modelling & Software, 25(8): 891-909.
|
|
|
| [36] |
Meng Y, Miao C C, Li L, et al. 2016. Investigation and evaluation of outlet of North Canal main inflow river. Water & Wastewater Engineering, 52(s1): 17-19. (in Chinese)
|
|
|
| [37] |
Ministry of Ecology and Environment of the People's Republic of China. 2002. National Environmental Quality Standards for Surface Water of China (GB3838-2002). [2022-02-16]. https://www.mee.gov.cn/ywgz/fgbz/bz/bzwb/shjbh/shjzlbz/. (in Chinese)
|
|
|
| [38] |
Mitchell W C, Burns A F. 1947. Measuring Business Cycles. Cambridge, MA: National Bureau of Economic Research, 3-22.
|
|
|
| [39] |
Moore G H. 1950. Statistical Indicators of Cyclical Revivals and Recessions. Cambridge, MA: National Bureau of Economic Research, 3-31.
|
|
|
| [40] |
Plate E J. 2008. Early warning and flood forecasting for large rivers with the lower Mekong as example. Journal of Hydro-environment Research, 1(2): 80-94.
doi: 10.1016/j.jher.2007.10.002
|
|
|
| [41] |
Ren Y T, Lu J, Fu Q. 2017. Sanjiang plain water safety warning research system based on evaluation index. Yellow River, 39(3): 75-80. (in Chinese)
|
|
|
| [42] |
Shi C Y, Zhang Z. 2021. A prediction method of regional water resources carrying capacity based on artificial neural network. Earth Sciences Research Journal, 25(2): 169-177.
doi: 10.15446/esrj.v25n2.81615
|
|
|
| [43] |
Shiskin J, Moore G H. 1968. Composite Indexes of Leading, Coinciding, and Lagging Indicators. Cambridge, MA: National Bureau of Economic Research, 316-356.
|
|
|
| [44] |
Song L L, Wang Z S, Wu J N, et al. 2022. Performance evaluation for implementation of National Water Pollution Control and Management Technology Major Project in Beijing-Tianjin-Hebei region—A case study of Beiyun River Basin. Environmental Protection Science, 48(4): 46-51. (in Chinese)
|
|
|
| [45] |
Su S, Gong Z N, Zhang W J, et al. 2022. Change of vegetation coverage and assessment of ecological environment quality in Beiyun River Basin. Acta Scientiae Circumstantiae, 42(1): 19-27. (in Chinese)
|
|
|
| [46] |
Sun S Y, Meng Y, Li L, et al. 2022. Temporal and spatial distribution characteristic and evaluation analysis of surface water quality in Beiyun River. Beijing Water, (1): 29-34. (in Chinese)
|
|
|
| [47] |
Tan Q, Huang G H, Cai Y P. 2013. Multi-source multi-sector sustainable water supply under multiple uncertainties: an inexact fuzzy-stochastic quadratic programming approach. Water Resources Management, 27(2): 451-473.
doi: 10.1007/s11269-012-0196-9
|
|
|
| [48] |
Taylor J R. 2015. An Introduction to Error Analysis:The Study of Uncertainties in Physical Measurements. Wang Z Y (translation). Beijing: Higher Education Press, 89-105. (in Chinese)
|
|
|
| [49] |
Tianjin Municipal Bureau of Statistics. 2009-2018. Tianjin Statistical Yearbook. Beijing: China Statistics Press. (in Chinese)
|
|
|
| [50] |
Tianjin Municipal Bureau of Statistics. 2021. Tianjin Statistical Yearbook. Beijing: China Statistics Press. (in Chinese)
|
|
|
| [51] |
Tianjin Water Authority. 2008-2017. Tianjin Water Resources Bulletin (2008-2017). [2021-03-02]. http://swj.tj.gov.cn/. (in Chinese)
|
|
|
| [52] |
Tu X J, Wang M Z, Sun K, et al. 2016. China Internet industry state analysis and prosperity indexes. China Communications (English version), 13(10): 245-252.
|
|
|
| [53] |
Usama A M, Choong W W, Low S T, et al. 2015. Investigating the environmental Kuznets curve (EKC) hypothesis by utilizing the ecological footprint as an indicator of environmental degradation. Ecological Indicators, 48: 315-323.
doi: 10.1016/j.ecolind.2014.08.029
|
|
|
| [54] |
Wang G, Xiao C L, Qi Z W, et al. 2021. Water resource carrying capacity based on water demand prediction in Chang-Ji economic circle. Water, 13(1): 16, doi: 10.3390/w13010016.
doi: 10.3390/w13010016
|
|
|
| [55] |
Wang T X, Xu S G. 2015. Dynamic successive assessment method of water environment carrying capacity and its application. Ecological Indicators, 52: 134-146.
doi: 10.1016/j.ecolind.2014.12.002
|
|
|
| [56] |
Xie Y X, Wu H, Cui D, et al. 2019. Chinese early warning of environmental carrying capacity based on the climate index method. China Environmental Science, 39(1): 440-448. (in Chinese)
|
|
|
| [57] |
Yu C X, Li Z Y, Yang Z F, et al. 2020. A feedforward neural network based on normalization and error correction for predicting water resources carrying capacity of a city. Ecological Indicators, 118: 106724, doi: 10.1016/j.ecolind.2020.106724.
doi: 10.1016/j.ecolind.2020.106724
|
|
|
| [58] |
Yu Y, Wu J, Wang X Y, et al. 2012. Degradation of inorganic nitrogen in Beiyun River of Beijing, China. Procedia Environmental Sciences, 13: 1069-1075.
doi: 10.1016/j.proenv.2012.01.100
|
|
|
| [59] |
Yuan J C. 1987. Research status and development trend of environmental management information system. Environmental Science, 8(5): 75-79.. (in Chinese)
doi: 10.1021/es60086a013
|
|
|
| [60] |
Zhang L, You Y, Gao C D, et al. 2020. Dissolved organic nitrogen structural and component changes in overlying water along urban river at molecular and material levels-Beiyun basin case study. Journal of Cleaner Production, 287: 125570, doi: 10.1016/j.jclepro.2020.125570.
doi: 10.1016/j.jclepro.2020.125570
|
|
|
| [61] |
Zhang Y J. 2007. Research on Econometric Analysis Method and Application of Economic Prosperity. Beijing: Economic Press China, 49-111. (in Chinese)
|
|
|
| [62] |
Zhang Y J, Yue Q, Wang T, et al. 2021. Evaluation and early warning of water environment carrying capacity in Liaoning province based on control unit: a case study in Zhaosutai river Tieling city control unit. Ecological Indicators, 124: 107392, doi: 10.1016/j.ecolind.2021.107392.
doi: 10.1016/j.ecolind.2021.107392
|
|
|
| [63] |
Zhou X Y, Zheng B H, Khu S T. 2019. Validation of the hypothesis on carrying capacity limits using the water environment carrying capacity. Science of The Total Environment, 665: 774-784.
doi: 10.1016/j.scitotenv.2019.02.146
|
|
|
|
Viewed |
|
|
|
Full text
|
|
|
|
|
Abstract
|
|
|
|
|
Cited |
|
|
|
|
| |
Shared |
|
|
|
|
| |
Discussed |
|
|
|
|