| Research article |
|


|
|
|
| Dew amount and its long-term variation in the Kunes River Valley, Northwest China |
FENG Ting1,2,3,4, HUANG Farong1,2,4,5, ZHU Shuzhen1,2,3,4, BU Lingjie1,2,3,4, QI Zhiming6, LI Lanhai1,2,3,4,5,*( ) ) |
1State Key Laboratory of Desert and Oasis Ecology, Xinjiang Institute of Ecology and Geography, Chinese Academy of Sciences, Urumqi 830011, China
2Tianshan Station for Snowcover and Avalanche Research, Chinese Academy of Sciences, Xinyuan 835800, China
3University of Chinese Academy of Sciences, Beijing 100049, China
4Xinjiang Key Laboratory of Water Cycle and Utilization in Arid Zone, Urumqi 830011, China
5Research Center for Ecology and Environment of Central Asia, Chinese Academy of Sciences, Urumqi 830011, China
6Department of Bioresource Engineering, McGill University, Montreal H3A0G4, Canada |
|
|
|
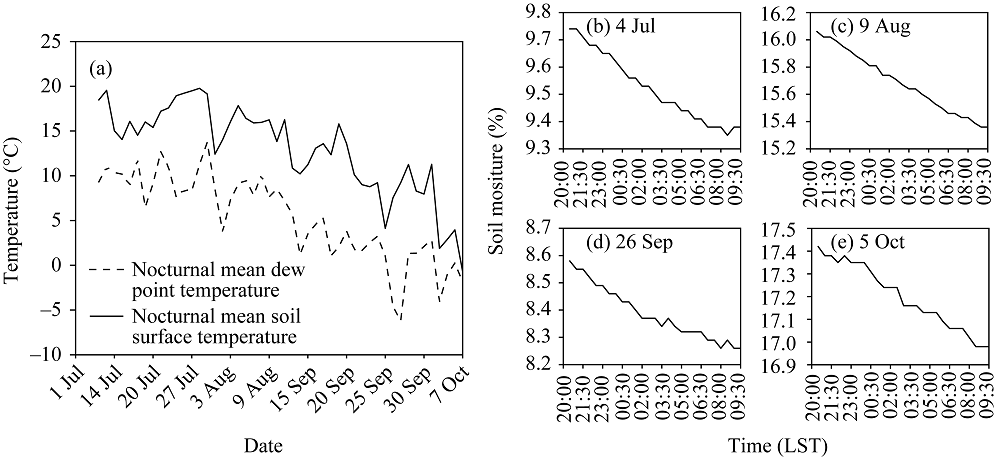
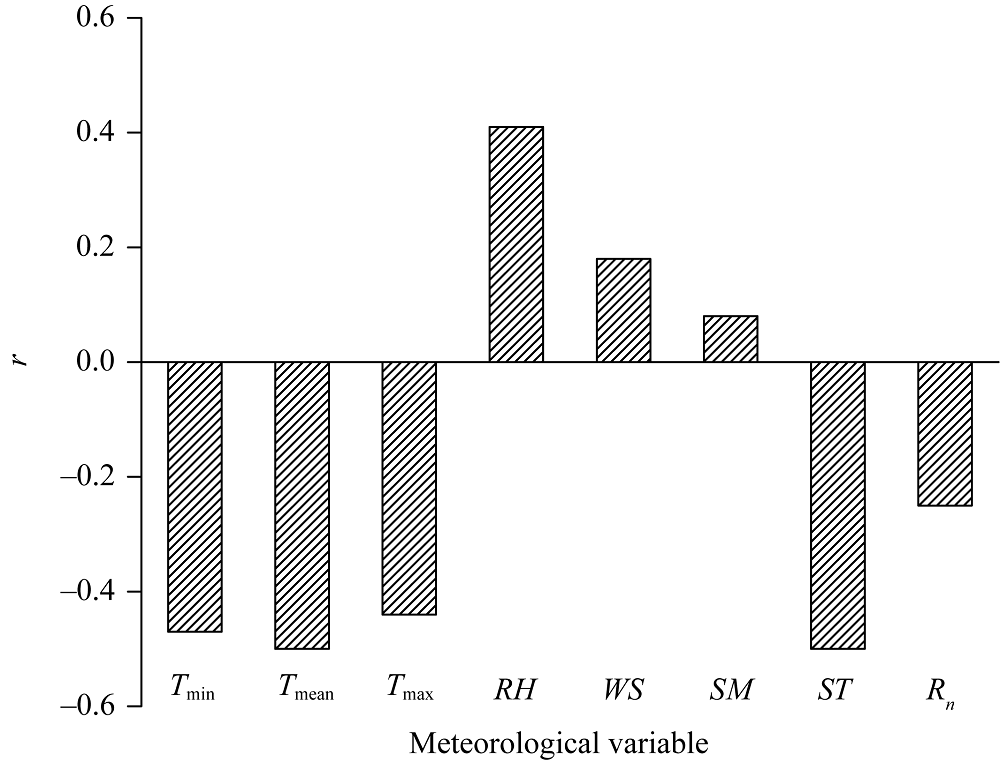
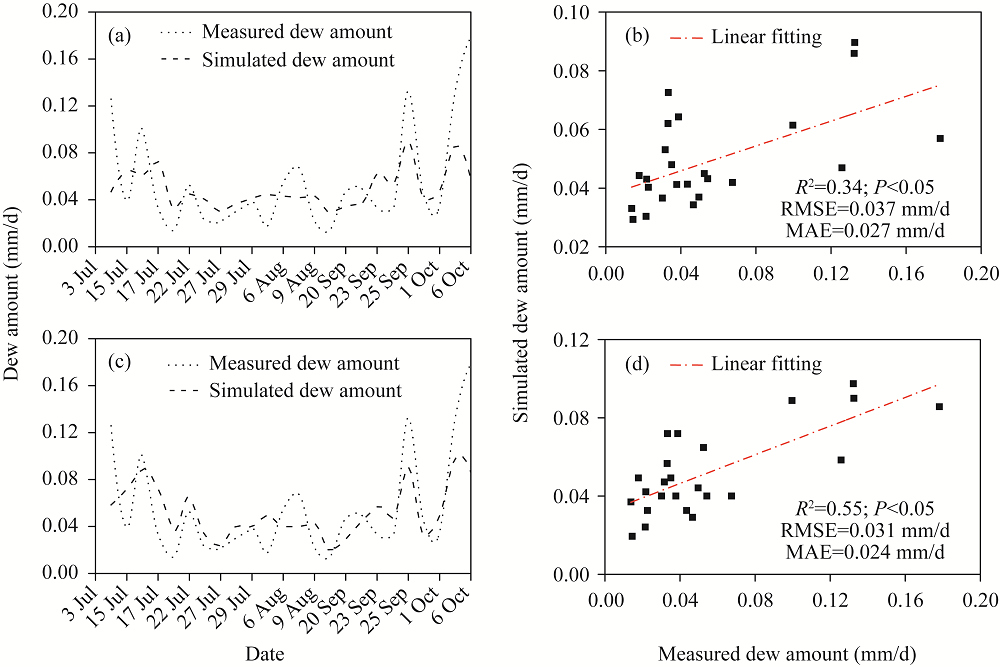
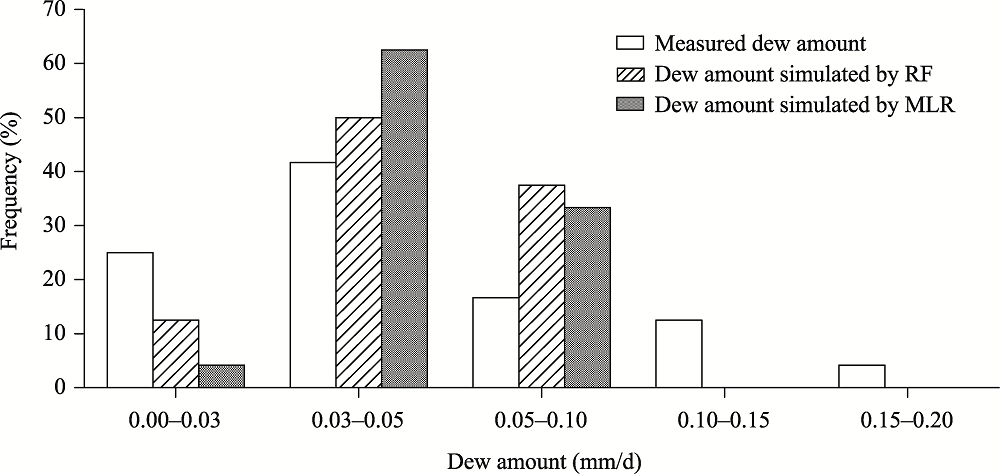
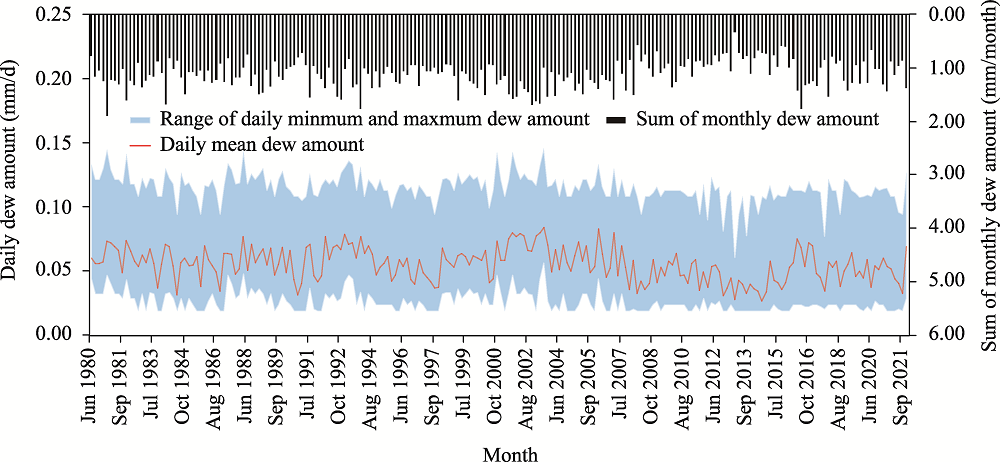
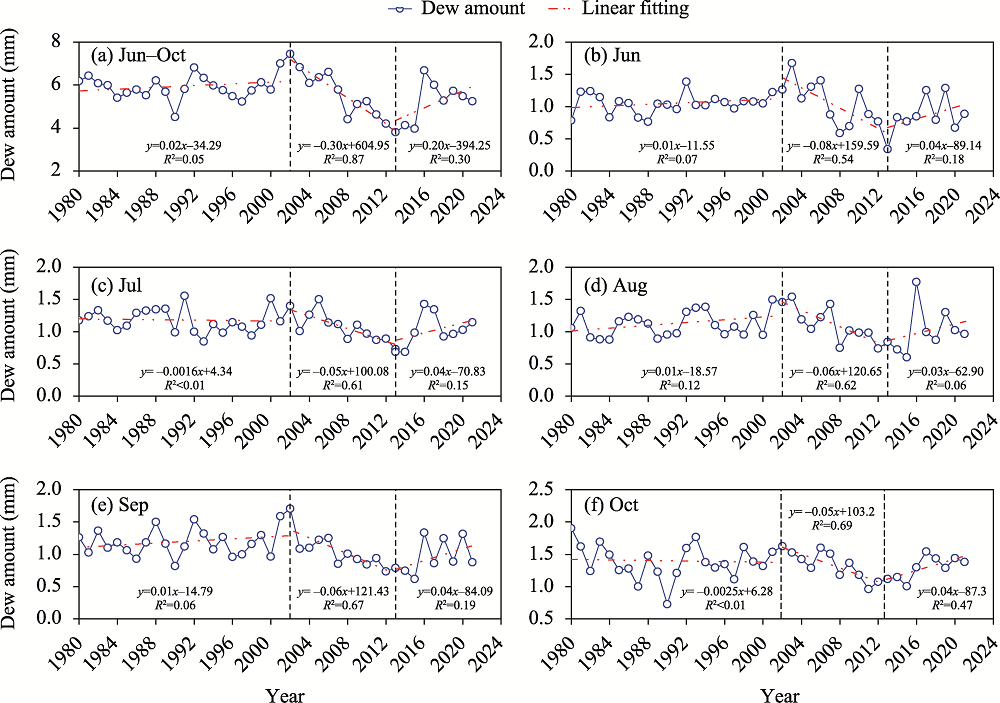
Abstract Dew is an essential water resource for the survival and reproduction of organisms in arid and semi-arid regions. Yet estimating the dew amount and quantifying its long-term variation are challenging. In this study, we elucidate the dew amount and its long-term variation in the Kunes River Valley, Northwest China, based on the measured daily dew amount and reconstructed values (using meteorological data from 1980 to 2021), respectively. Four key results were found: (1) the daily mean dew amount was 0.05 mm during the observation period (4 July-12 August and 13 September-7 October of 2021). In 35 d of the observation period (i.e., 73% of the observation period), the daily dew amount exceeded the threshold (>0.03 mm/d) for microorganisms; (2) air temperature, relative humidity, and wind speed had significant impacts on the daily dew amount based on the relationships between the measured dew amount and meteorological variables; (3) for estimating the daily dew amount, random forest (RF) model outperformed multiple linear regression (MLR) model given its larger R2 and lower MAE and RMSE; and (4) the dew amount during June-October and in each month did not vary significantly from 1980 to the beginning of the 21st century. It then significantly decreased for about a decade, after it increased slightly from 2013 to 2021. For the whole meteorological period of 1980-2021, the dew amount decreased significantly during June-October and in July and September, and there was no significant variation in June, August, and October. Variation in the dew amount in the Kunes River Valley was mainly driven by relative humidity. This study illustrates that RF model can be used to reconstruct long-term variation in the dew amount, which provides valuable information for us to better understand the dew amount and its relationship with climate change.
|
|
Received: 27 April 2022
Published: 31 July 2022
|
|
Corresponding Authors:
* LI Lanhai (E-mail: lilh@ms.xjb.ac.cn)
|
|
|
| [1] |
Allen R G, Pereira L S, Raes D, et al. 1998. Crop evapotranspiration: guidelines for computing crop water requirements. Fao Irrigation and Drainage Paper 56. Rome: Food and Agriculture Organization of the United Nations.
|
|
|
| [2] |
Beysens D. 1995. The formation of dew. Atmospheric Research, 39(1-3): 215-237.
|
|
|
| [3] |
Boucher J F, Munson A D, Bernier P Y. 1995. Foliar absorption of dew influences shoot water potential and root growth in Pinus strobus seedlings. Tree Physiology, 15(12): 819-823.
doi: 10.1093/treephys/15.12.819
|
|
|
| [4] |
Broza M. 1979. Dew, fog and hygroscopic food as a source of water for desert arthropods. Journal of Arid Environments, 2(1): 43-49.
doi: 10.1016/S0140-1963(18)31703-8
|
|
|
| [5] |
Fu T L, Li X R, Jia R L, et al. 2021. A novel integrated method based on a machine learning model for estimating evapotranspiration in dryland. Journal of Hydrology, 603: 126881, doi: 10.1016/j.jhydrol.2021.126881.
doi: 10.1016/j.jhydrol.2021.126881
|
|
|
| [6] |
Gerlein-Safdi C, Koohafkan M C, Chung M, et al. 2018. Dew deposition suppresses transpiration and carbon uptake in leaves. Agricultural and Forest Meteorology, 259: 305-316.
doi: 10.1016/j.agrformet.2018.05.015
|
|
|
| [7] |
Guo X N, Wang Y F, Yan H M, et al. 2022. Dew/hoar frost on the canopies and underlying surfaces of two typical desert shrubs in Northwest China and their relevance to drought. Journal of Hydrology, 609: 127880, doi: 10.1016/j.jhydrol.2022.127880.
doi: 10.1016/j.jhydrol.2022.127880
|
|
|
| [8] |
Hamilton W J, Seely M K. 1976. Fog basking by the Namib Desert beetle, Onymacris unguicularis. Nature, 262(5566): 284-285.
doi: 10.1038/262284a0
|
|
|
| [9] |
Hao X M, Li C, Guo B, et al. 2012. Dew formation and its long-term trend in a desert riparian forest ecosystem on the eastern edge of the Taklimakan Desert in China. Journal of Hydrology, 472: 90-98.
|
|
|
| [10] |
He S Y, Richards K. 2015. The role of dew in the monsoon season assessed via stable isotopes in an alpine meadow in Northern Tibet. Atmospheric Research, 151: 101-109.
doi: 10.1016/j.atmosres.2014.02.014
|
|
|
| [11] |
Hill A J, Lincoln N K, Rachmilevitch S, et al. 2020. Modified hiltner dew balance to re-estimate dewfall accumulation as a reliable water source in the Negev Desert. Water, 12(10): 2952, doi: 10.3390/w12102952.
doi: 10.3390/w12102952
|
|
|
| [12] |
Huang F R, Feng T, Guo Z K, et al. 2021. Impact of winter snowfall on vegetation greenness in Central Asia. Remote Sensing, 13(21): 4205, doi: 10.3390/rs13214205.
doi: 10.3390/rs13214205
|
|
|
| [13] |
Jacobs A F G, Heusinkveld B G, Berkowicz S M. 1999. Dew deposition and drying in a desert system: a simple simulation model. Journal of Arid Environments, 42(3): 211-222.
doi: 10.1006/jare.1999.0523
|
|
|
| [14] |
Jacobs A F G, Heusinkveld B G, Berkowicz S M. 2002. A simple model for potential dewfall in an arid region. Atmospheric Research, 64(1-4): 285-295.
doi: 10.1016/S0169-8095(02)00099-6
|
|
|
| [15] |
Jacobs A F G, Heusinkveld B G, Kruit R J W, et al. 2006. Contribution of dew to the water budget of a grassland area in the Netherlands. Water Resources Research, 42(3): W03415, doi: 10.1029/2005wr004055.
doi: 10.1029/2005wr004055
|
|
|
| [16] |
Jacobs A F G, Heusinkveld B G, Berkowicz S M. 2008. Passive dew collection in a grassland area, The Netherlands. Atmospheric Research, 87(3-4): 377-385.
doi: 10.1016/j.atmosres.2007.06.007
|
|
|
| [17] |
Jia Z F, Ma Y D, Liu P, et al. 2019. Relationship between sand dew and plant leaf dew and its significance in irrigation water supplementation in Guanzhong Basin, China. Environmental Earth Sciences, 78(12): 354, doi: 10.1007/s12665-019-8345-6.
doi: 10.1007/s12665-019-8345-6
|
|
|
| [18] |
Kalthoff N, Fiebig-Wittmaack M, Meißner C, et al. 2006. The energy balance, evapo-transpiration and nocturnal dew deposition of an arid valley in the Andes. Journal of Arid Environments, 65(3): 420-443.
doi: 10.1016/j.jaridenv.2005.08.013
|
|
|
| [19] |
Kendall M G. 1975. Rank Correlation Methods. London: Charles Griffin.
|
|
|
| [20] |
Kidron G J. 1998. A simple weighing method for dew and fog measurements. Weather, 53(12): 428-433.
doi: 10.1002/j.1477-8696.1998.tb06362.x
|
|
|
| [21] |
Kidron G J. 1999. Differential water distribution over dune slopes as affected by slope position and microbiotic crust, Negev Desert, Israel. Hydrological Processes, 13(11): 1665-1682.
doi: 10.1002/(SICI)1099-1085(19990815)13:11<1665::AID-HYP836>3.0.CO;2-R
|
|
|
| [22] |
Kidron G J. 2005. Angle and aspect dependent dew and fog precipitation in the Negev desert. Journal of Hydrology, 301(1-4): 66-74.
doi: 10.1016/j.jhydrol.2004.06.029
|
|
|
| [23] |
Lekouch I, Muselli M, Kabbachi B, et al. 2011. Dew, fog, and rain as supplementary sources of water in south-western Morocco. Energy, 36(4): 2257-2265.
doi: 10.1016/j.energy.2010.03.017
|
|
|
| [24] |
Lekouch I, Lekouch K, Muselli M, et al. 2012. Rooftop dew, fog and rain collection in southwest Morocco and predictive dew modeling using neural networks. Journal of Hydrology, 448: 60-72.
|
|
|
| [25] |
Liu X, Ma J, Ma Z W, et al. 2017a. Soil nutrient contents and stoichiometry as affected by land-use in an agro-pastoral region of northwest China. CATENA, 150: 146-153.
doi: 10.1016/j.catena.2016.11.020
|
|
|
| [26] |
Liu X, Li L H, Qi Z M, et al. 2017b. Land-use impacts on profile distribution of labile and recalcitrant carbon in the Ili River Valley, northwest China. Science of the Total Environment, 586: 1038-1045.
doi: 10.1016/j.scitotenv.2017.02.087
|
|
|
| [27] |
Liu X, Chen D T, Yang T, et al. 2020. Changes in soil labile and recalcitrant carbon pools after land-use change in a semi-arid agro-pastoral ecotone in Central Asia. Ecological Indicators, 110: 105925, doi: 10.1016/j.ecolind.2019.105925.
doi: 10.1016/j.ecolind.2019.105925
|
|
|
| [28] |
Lujan-Moreno G A, Howard P R, Rojas O G, et al. 2018. Design of experiments and response surface methodology to tune machine learning hyperparameters, with a random forest case-study. Expert Systems with Applications, 109: 195-205.
doi: 10.1016/j.eswa.2018.05.024
|
|
|
| [29] |
Madeira A C, Kim K S, Taylor S E, et al. 2002. A simple cloud-based energy balance model to estimate dew. Agricultural and Forest Meteorology, 111(1): 55-63.
doi: 10.1016/S0168-1923(02)00004-7
|
|
|
| [30] |
Mann H B. 1945. Nonparametric tests against trend. Econometrica, 13(3): 245-259.
doi: 10.2307/1907187
|
|
|
| [31] |
Meissner R, Seeger J, Rupp H, et al. 2007. Measurement of dew, fog, and rime with a high-precision gravitation lysimeter. Journal of Plant Nutrition and Soil Science, 170(3): 335-344.
doi: 10.1002/jpln.200625002
|
|
|
| [32] |
Meissner R, Rupp H, Weller U, et al. 2010. Lysimeter research in Europe-technological developments and research strategies. In:19th World Congress of Soil Science: Soil Solutions for a Changing World. Brisbane, Australia.
|
|
|
| [33] |
Monteith J L. 1957. Dew. Quarterly Journal of the Royal Meteorological Society, 83(357): 322-341.
|
|
|
| [34] |
Moro M J, Were A, Villagarcía L, et al. 2007. Dew measurement by Eddy covariance and wetness sensor in a semiarid ecosystem of SE Spain. Journal of Hydrology, 335(3-4): 295-302.
doi: 10.1016/j.jhydrol.2006.11.019
|
|
|
| [35] |
Munné-Bosch S, Alegre L. 1999. Role of dew on the recovery of water-stressed Melissa officinalis L. plants. Journal of Plant Physiology, 154(5-6): 759-766.
doi: 10.1016/S0176-1617(99)80255-7
|
|
|
| [36] |
Munné-Bosch S, Nogues S, Alegre L. 1999. Diurnal variations of photosynthesis and dew absorption by leaves in two evergreen shrub communities in Mediterranean field conditions. New Phytologist, 144(1): 109-119.
doi: 10.1046/j.1469-8137.1999.00490.x
|
|
|
| [37] |
Nikolayev V S, Beysens D, Gioda A, et al. 1996. Water recovery from dew. Journal of hydrology, 182(1-4): 19-35.
doi: 10.1016/0022-1694(95)02939-7
|
|
|
| [38] |
Nilsson T. 1996. Initial experiments on dew collection in Sweden and Tanzania. Solar Energy Materials and Solar Cells, 40(1): 23-32.
doi: 10.1016/0927-0248(95)00076-3
|
|
|
| [39] |
Richards K. 2004. Observation and simulation of dew in rural and urban environments. Progress in Physical Geography: Earth and Environment, 28(1): 76-94.
doi: 10.1191/0309133304pp402ra
|
|
|
| [40] |
Sen P K. 1968. Estimates of the regression coefficient based on Kendall's Tau. Journal of the American Statistical Association, 63: 1379-1389.
doi: 10.1080/01621459.1968.10480934
|
|
|
| [41] |
Steinberger Y, Loboda I, Garner W. 1989. The influence of autumn dewfall on spatial and temporal distribution of nematodes in the desert ecosystem. Journal of Arid Environments, 16(2): 177-183.
doi: 10.1016/S0140-1963(18)31024-3
|
|
|
| [42] |
Theil H. 1950. A rank invariant method of linear and polynomial regression analysis: Part III. Proceedings of the Royal Netherlands Academy of Sciences, 53: 1397-1412.
|
|
|
| [43] |
Tuure J, Korpela A, Hautala M, et al. 2019. Comparison of surface foil materials and dew collectors location in an arid area: a one-year field experiment in Kenya. Agricultural and Forest Meteorology, 276-277: 107613, doi: 10.1016/j.agrformet.2019.06.012.
doi: 10.1016/j.agrformet.2019.06.012
|
|
|
| [44] |
Uclés O, Villagarcía L, Moro M J, et al. 2013. Role of dewfall in the water balance of a semiarid coastal steppe ecosystem. Hydrological Processes, 28(4): 2271-2280.
doi: 10.1002/hyp.9780
|
|
|
| [45] |
Vaadia Y, Waisel Y. 1963. Water absorption by the aerial organs of plants. Physiologia Plantarum, 16(1): 44-51.
doi: 10.1111/j.1399-3054.1963.tb08287.x
|
|
|
| [46] |
Xiao H, Meissner R, Seeger J, et al. 2009. Effect of vegetation type and growth stage on dewfall, determined with high precision weighing lysimeters at a site in northern Germany. Journal of Hydrology, 377(1-2): 43-49.
doi: 10.1016/j.jhydrol.2009.08.006
|
|
|
| [47] |
Xu T R, Guo Z X, Liu S M, et al. 2018. Evaluating different machine learning methods for upscaling evapotranspiration from flux towers to the regional scale. Journal of Geophysical Research: Atmospheres, 123(16): 8674-8690.
doi: 10.1029/2018JD028447
|
|
|
| [48] |
Xu Y J, Chen Y, Li W, et al. 2011. Distribution pattern of plant species diversity in the mountainous Region of Ili River Valley, Xinjiang. Environmental Monitoring and Assessment, 177(1): 681-694.
doi: 10.1007/s10661-010-1665-3
|
|
|
| [49] |
Zangvil A. 1996. Six years of dew observations in the Negev Desert, Israel. Journal of Arid Environments, 32(4): 361-371.
doi: 10.1006/jare.1996.0030
|
|
|
| [50] |
Zhang C, Luo G P, Hellwich O, et al. 2021. A framework for estimating actual evapotranspiration at weather stations without flux observations by combining data from MODIS and flux towers through a machine learning approach. Journal of Hydrology, 603: 127047, doi: 10.1016/j.jhydrol.2021.127047.
doi: 10.1016/j.jhydrol.2021.127047
|
|
|
| [51] |
Zhang J, Zhang Y M, Downing A, et al. 2009. The influence of biological soil crusts on dew deposition in Gurbantunggut Desert, Northwestern China. Journal of Hydrology, 379(3-4): 220-228.
doi: 10.1016/j.jhydrol.2009.09.053
|
|
|
| [52] |
Zheng X J, Li S, Li Y. 2011. Leaf water uptake strategy of desert plants in the Junggar Basin, China. Chinese Journal of Plant Ecology, 35(9): 893-905. (in Chinese)
doi: 10.3724/SP.J.1258.2011.00893
|
|
|
| [53] |
Zhuang Y L, Ratcliffe S. 2012. Relationship between dew presence and Bassia dasyphylla plant growth. Journal of Arid Land, 4(1): 11-18.
doi: 10.3724/SP.J.1227.2012.00011
|
|
|
| [54] |
Zhuang Y L, Zhao W Z. 2013. Dew variability in three habitats of a sand dune transect in a desert oasis ecotone, Northwestern China. Hydrological Processes, 28(3): 1399-1408.
doi: 10.1002/hyp.9675
|
|
|
| [55] |
Zhuang Y L, Zhao W Z. 2017. Dew formation and its variation in Haloxylon ammodendron plantations at the edge of a desert oasis, northwestern China. Agricultural and Forest Meteorology, 247: 541-550.
doi: 10.1016/j.agrformet.2017.08.032
|
|
|
| [56] |
Zhuang Y L, Zhao W Z, Luo L H, et al. 2021. Dew formation characteristics in the gravel desert ecosystem and its ecological roles on Reaumuria soongorica. Journal of Hydrology, 603: 126932, doi: 10.1016/j.jhydrol.2021.126932.
doi: 10.1016/j.jhydrol.2021.126932
|
|
|
|
Viewed |
|
|
|
Full text
|
|
|
|
|
Abstract
|
|
|
|
|
Cited |
|
|
|
|
| |
Shared |
|
|
|
|
| |
Discussed |
|
|
|
|