| Research article |
|

|
|
|
| Evaluating the soil evaporation loss rate in a gravel-sand mulching environment based on stable isotopes data |
YANG Ye1,2, ZHANG Mingjun1,2,*( ), ZHANG Yu1,2, WANG Shengjie1,2, WANG Jiaxin1,2 ), ZHANG Yu1,2, WANG Shengjie1,2, WANG Jiaxin1,2 |
1College of Geography and Environmental Science, Northwest Normal University, Lanzhou 730070, China
2Key Laboratory of Resource Environment and Sustainable Development of Oasis, Lanzhou 730070, China |
|
|
|
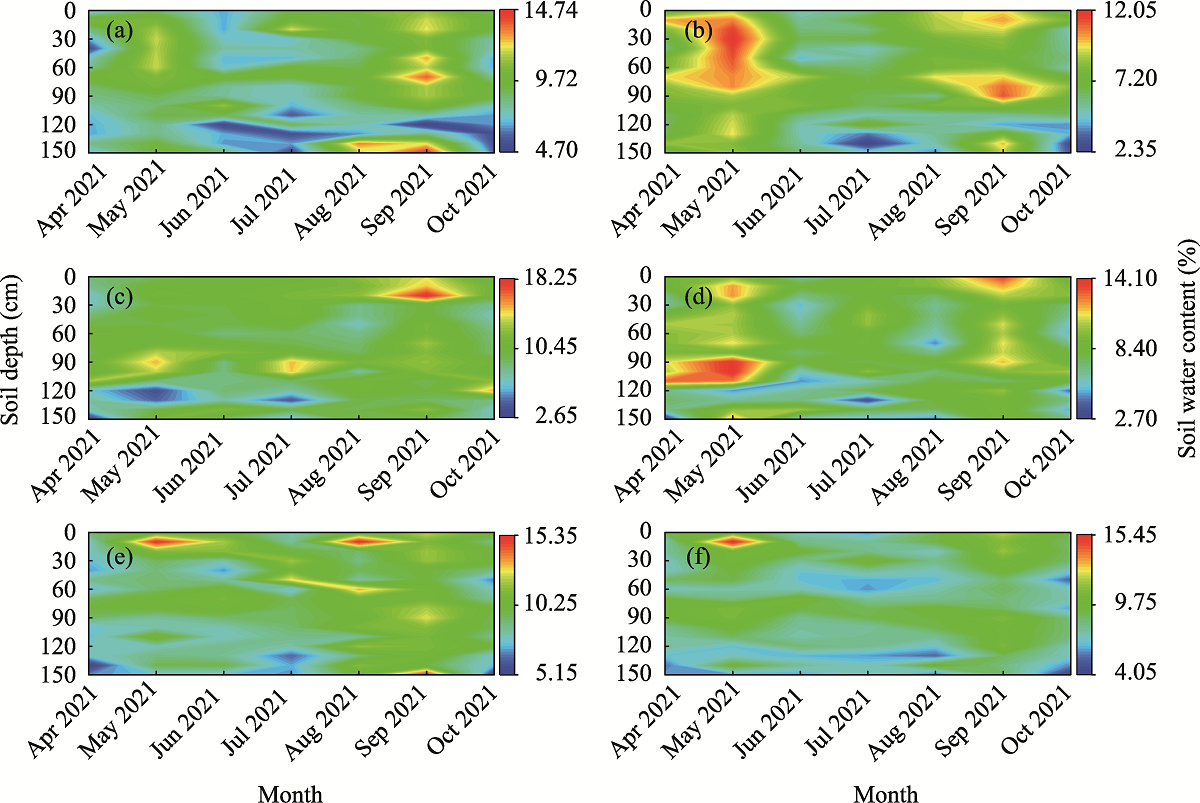
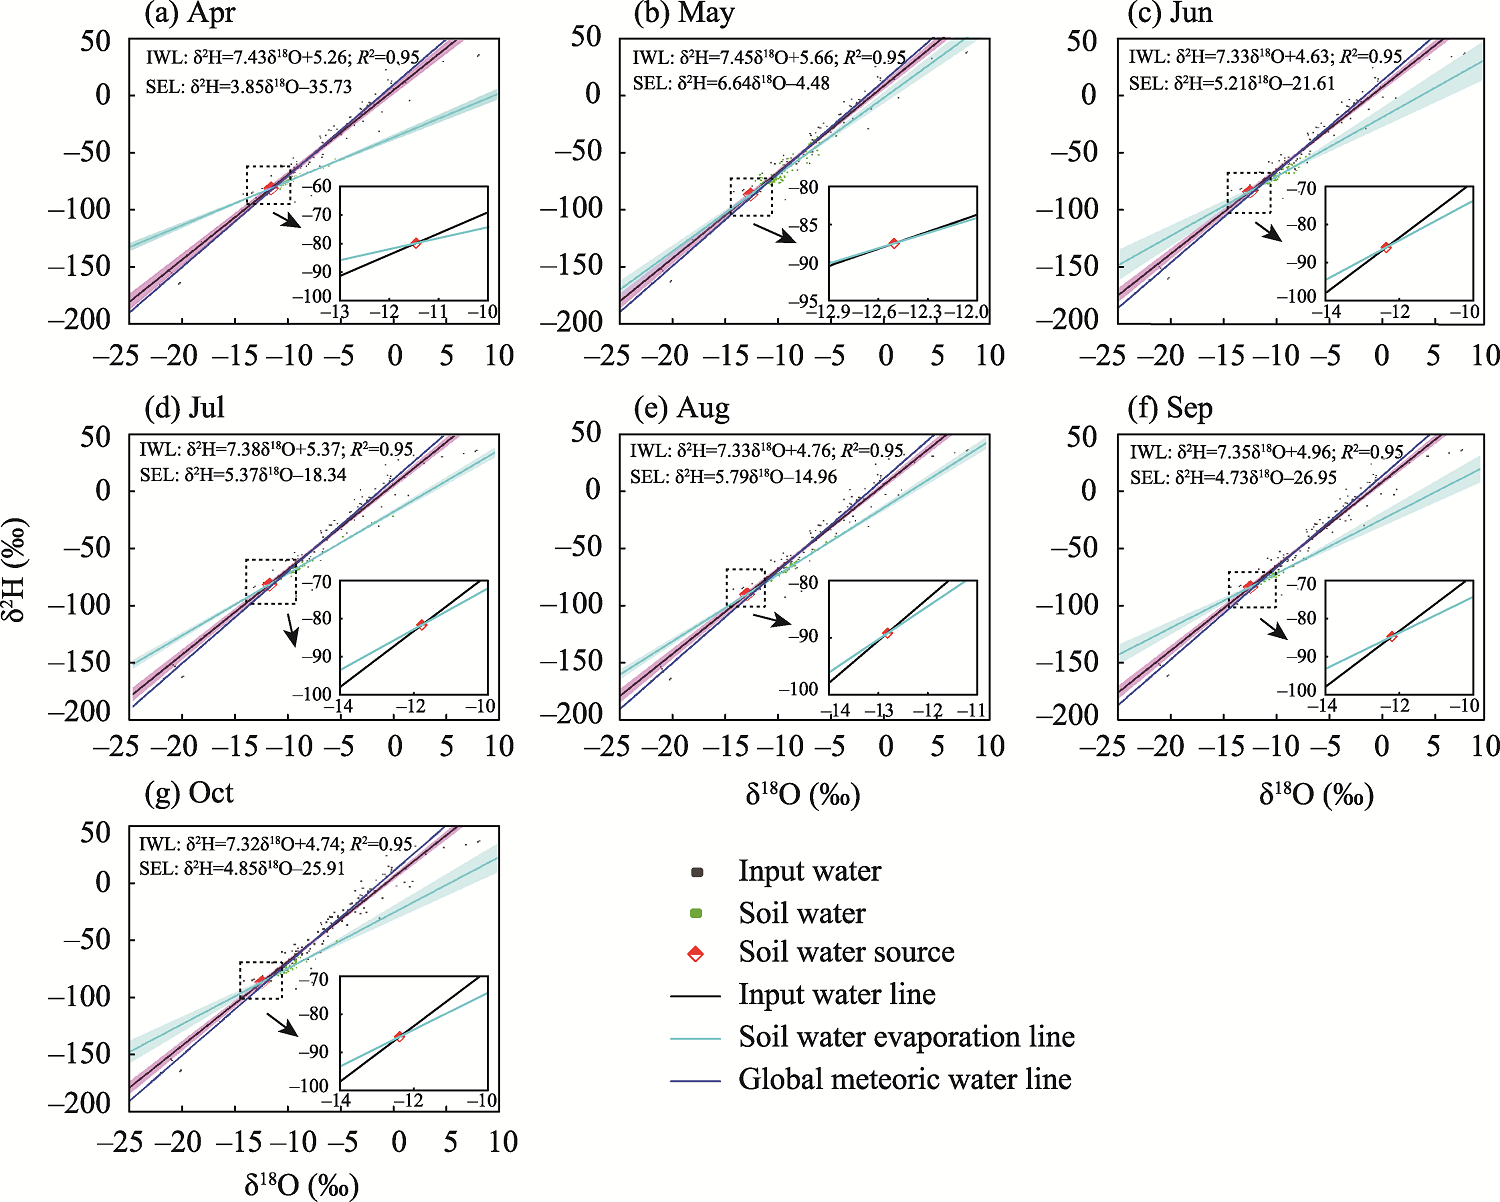
Abstract In order to cope with drought and water shortages, the working people in the arid areas of Northwest China have developed a drought-resistant planting method, namely, gravel-sand mulching, after long-term agricultural practices. To understand the effects of gravel-sand mulching on soil water evaporation, we selected Baifeng peach (Amygdalus persica L.) orchards in Northwest China as the experimental field in 2021. Based on continuously collected soil water stable isotopes data, we evaluated the soil evaporation loss rate in a gravel-sand mulching environment using the line-conditioned excess (lc-excess) coupled Rayleigh fractionation model and Craig-Gordon model. The results show that the average soil water content in the plots with gravel-sand mulching is 1.86% higher than that without gravel-sand mulching. The monthly variation of the soil water content is smaller in the plots with gravel-sand mulching than that without gravel-sand mulching. Moreover, the average lc-excess value in the plots without gravel-sand mulching is smaller. In addition, the soil evaporation loss rate in the plots with gravel-sand mulching is lower than that in the plots without gravel-sand mulching. The lc-excess value was negative for both the plots with and without gravel-sand mulching, and it has good correlation with relative humidity, average temperature, input water content, and soil water content. The effect of gravel-sand mulching on soil evaporation is most prominent in August. Compared with the evaporation data of similar environments in the literature, the lc-excess coupled Rayleigh fractionation model is better. Stable isotopes evidence shows that gravel-sand mulching can effectively reduce soil water evaporation, which provides a theoretical basis for agricultural water management and optimization of water-saving methods in arid areas.
|
|
Received: 24 May 2022
Published: 30 August 2022
|
|
Corresponding Authors:
* ZHANG Mingjun (E-mail: mjzhang2004@163.com)
|
|
|
| [1] |
Allison G B, Barnes C J. 1983. Estimation of evaporation from non-vegetated surfaces using natural deuterium. Nature, 301(5896): 143-145.
doi: 10.1038/301143a0
|
|
|
| [2] |
Al-Oqaili F, Good S P, Peters R T, et al. 2020. Using stable water isotopes to assess the influence of irrigation structural configurations on evaporation losses in semiarid agricultural systems. Agricultural and Forest Meteorology, 291: 108083, doi: 10.1016/j.agrformet.2020.108083.
doi: 10.1016/j.agrformet.2020.108083
|
|
|
| [3] |
Barnes C J, Allison G B. 1984. The distribution of deuterium and 18O in dry soils: 3. Theory for non-isothermal water movement. Journal of Hydrology, 74(1-2): 119-135.
doi: 10.1016/0022-1694(84)90144-6
|
|
|
| [4] |
Benettin P, Volkmann T H, Freyberg J V, et al. 2018. Effects of climatic seasonality on the isotopic composition of evaporating soil waters. Hydrology and Earth System Sciences, 22(5): 2881-2890.
doi: 10.5194/hess-22-2881-2018
|
|
|
| [5] |
Che C W, Zhang M J, Wang S J, et al. 2020. Studying spatio-temporal variation and influencing factors of soil evaporation in southern and northern mountains of Lanzhou city based on stable hydrogen and oxygen isotopes. Geographical Research, 39(11): 2537-2551. (in Chinese)
|
|
|
| [6] |
Chen F L, Zhang M J, Ma Q, et al. 2013. Characteristics of δ18O in precipitation and water vapor sources in Lanzhou City and its surrounding area. Environmental Science, 34(10): 3755-3763. (in Chinese)
|
|
|
| [7] |
Chen J, Xie X, Zheng X, et al. 2019. Effect of straw mulch on soil evaporation during freeze-thaw periods. Water, 11(8): 1689, doi: 10.3390/w11081689.
doi: 10.3390/w11081689
|
|
|
| [8] |
Clark I D, Fritz P. 2013. Environmental Isotopes in Hydrogeology. Boca Raton: CRC Press.
|
|
|
| [9] |
Craig H, Gordon L I. 1965. Deuterium and oxygen-18 variations in the ocean and the marine atmosphere. In:Proceedings of a Conference on Stable Isotopes in Oceanographic Studies and Palaeo Temperatures. Pisa, Italy.
|
|
|
| [10] |
Dang Y. 2004. The environmental degeneration has influence on the climate of Lanzhou area. Journal of Northwest University (Natural Science Edition), 34(3): 355-358. (in Chinese)
|
|
|
| [11] |
Dubbert M, Caldeira M C, Dubbert D, et al. 2019. A pool-weighted perspective on the two-water-worlds hypothesis. New Phytologist, 222(3): 1271-1283.
doi: 10.1111/nph.15670
pmid: 30604465
|
|
|
| [12] |
Fu Q, Li T N, Li T X, et al. 2015. Influence of straw mulching on soil moisture characteristics during seasonal freeza-thaw period. Transactions of the Chinese Society for Agricultural Machinery, 46(6): 141-146. (in Chinese)
|
|
|
| [13] |
Gibson J J, Birks S J, Edwards T W D. 2008. Global prediction of δA and δ2H-δ18O evaporation slopes for lakes and soil water accounting for seasonality. Global Biogeochemical Cycles, 22(2): GB2031, doi: 10.1029/2007GB002997.
doi: 10.1029/2007GB002997
|
|
|
| [14] |
Gibson J J, Reid R. 2014. Water balance along a chain of tundra lakes: A 20-year isotopic perspective. Journal of Hydrology, 519: 2148-2164.
doi: 10.1016/j.jhydrol.2014.10.011
|
|
|
| [15] |
Gibson J J, Birks S J, Yi Y. 2016. Stable isotope mass balance of lakes: a contemporary perspective. Quaternary Science Reviews, 131: 316-328.
doi: 10.1016/j.quascirev.2015.04.013
|
|
|
| [16] |
Gonfiantini R. 1986. Environmental isotopes in lake studies. The Terrestrial Environment, B, 2: 113-168.
|
|
|
| [17] |
Hasselquist N J, Benegas L, Roupsard O, et al. 2018. Canopy cover effects on local soil water dynamics in a tropical agroforestry system: Evaporation drives soil water isotopic enrichment. Hydrological Processes, 32(8): 994-1004.
doi: 10.1002/hyp.11482
|
|
|
| [18] |
Horita J, Wesolowski D J. 1994. Liquid-vapor fractionation of oxygen and hydrogen isotopes of water from the freezing to the critical temperature. Geochimica et Cosmochimica Acta, 58(16): 3425-3437.
doi: 10.1016/0016-7037(94)90096-5
|
|
|
| [19] |
Horita J, Rozanski K, Cohen S. 2008. Isotope effects in the evaporation of water: a status report of the Craig-Gordon model. Isotopes in Environmental and Health Studies, Isotopes in Environmental and Health Studies, 44(1): 23-49.
|
|
|
| [20] |
Hsieh J C, Chadwick O A, Kelly E F, et al. 1998. Oxygen isotopic composition of soil water: quantifying evaporation and transpiration. Geoderma, 82(1-3): 269-293.
doi: 10.1016/S0016-7061(97)00105-5
|
|
|
| [21] |
Hu Y, Liu Z, Zhao M, et al. 2018. Using deuterium excess, precipitation and runoff data to determine evaporation and transpiration: A case study from the Shawan Test Site, Puding, Guizhou, China. Geochimica et Cosmochimica Acta, 242: 21-33.
doi: 10.1016/j.gca.2018.08.049
|
|
|
| [22] |
Javaux M, Rothfuss Y, Vanderborght J, et al. 2016. Isotopic composition of plant water sources. Nature, 536(7617): E1-E3.
|
|
|
| [23] |
Kang S Z. 2019. National water conservation initiative for promoting water-adapted and green agriculture and highly-efficient water use. China Water Resources, (13): 1-6. (in Chinese)
|
|
|
| [24] |
Kool D, Agam N, Lazarovitch N, et al. 2014. A review of approaches for evapotranspiration partitioning. Agricultural and Forest Meteorology, 184: 56-70.
doi: 10.1016/j.agrformet.2013.09.003
|
|
|
| [25] |
Landwehr J M, Coplen T B. 2006. Line-conditioned excess:a new method for characterizing stable hydrogen and oxygen isotope ratios in hydrologic systems. In: International Conference on Isotopes in Environmental Studies. Vienna, Austria.
|
|
|
| [26] |
Lu X, Li R, Shi H, et al. 2019. Successive simulations of soil water-heat-salt transport in one whole year of agriculture after different mulching treatments and autumn irrigation. Geoderma, 344: 99-107.
doi: 10.1016/j.geoderma.2019.03.006
|
|
|
| [27] |
Mahindawansha A, Külls C, Kraft P, et al. 2020. Investigating unproductive water losses from irrigated agricultural crops in the humid tropics through analyses of stable isotopes of water. Hydrology and Earth System Sciences, 24(7): 3627-3642.
doi: 10.5194/hess-24-3627-2020
|
|
|
| [28] |
Merlivat L. 1978. The dependence of bulk evaporation coefficients on air-water interfacial conditions as determined by the isotopic method. Journal of Geophysical Research: Oceans, 83(C6): 2977-2980.
|
|
|
| [29] |
Or D, Lehmann P, Shahraeeni E, et al. 2013. Advances in soil evaporation physics-A review. Vadose Zone Journal, 12(4): 1-16.
|
|
|
| [30] |
Piri J, Malik A, Kisi O. 2020. Assessment and simulation of evaporation front depth and intensity from different soil surface conditions regarding diverse static levels. Water Productivity Journal, 1(1): 1-20.
|
|
|
| [31] |
Poesen J, Van Wesemael B, Govers G, et al. 1997. Patterns of rock fragment cover generated by tillage erosion. Geomorphology, 18(3-4): 183-197.
doi: 10.1016/S0169-555X(96)00025-6
|
|
|
| [32] |
Schlesinger W H, Jasechko S. 2014. Transpiration in the global water cycle. Agricultural and Forest Meteorology, 189: 115-117.
|
|
|
| [33] |
Sprenger M, Leistert H, Gimbel K, et al. 2016. Illuminating hydrological processes at the soil-vegetation-atmosphere interface with water stable isotopes. Reviews of Geophysics, 54(3): 674-704.
doi: 10.1002/2015RG000515
|
|
|
| [34] |
Sprenger M, Tetzlaff D, Soulsby C. 2017. Soil water stable isotopes reveal evaporation dynamics at the soil-plant-atmosphere interface of the critical zone. Hydrology and Earth System Sciences, 21(7): 3839-3858.
doi: 10.5194/hess-21-3839-2017
|
|
|
| [35] |
Tan J L, Wang X N, Tian J C, et al. 2017. Water retention characteristics of gravel-sand stratum on the gravel-sand mulched field. Chinese Journal of Soil Science, 48(2): 319-325. (in Chinese)
doi: 10.1111/j.1365-2389.1997.tb00552.x
|
|
|
| [36] |
Xiang W, Si B C, Li M, et al. 2021. Stable isotopes of deep soil water retain long-term evaporation loss on China's Loess Plateau. Science of the Total Environment, 784: 147153, doi: 10.1016/j.scitotenv.2021.147153.
doi: 10.1016/j.scitotenv.2021.147153
|
|
|
| [37] |
Yuan C F, Feng S Y, Huo Z L, et al. 2019. Effects of deficit irrigation with saline water on soil water-salt distribution and water use efficiency of maize for seed production in arid Northwest China. Agricultural Water management, 212: 424-432.
doi: 10.1016/j.agwat.2018.09.019
|
|
|
| [38] |
Zhao W J, Yu P, Ma X Y, et al. 2017. Numerical simulation of soil evaporation with sand mulching and inclusion. Water, 9(4): 294, doi: 10.3390/w9040294.
doi: 10.3390/w9040294
|
|
|
| [39] |
Zimmermann U, Münnich K O, Roether W, et al. 1966. Tracers determine movement of soil moisture and evapotranspiration. Science, 152(3720): 346-347.
pmid: 17775158
|
|
|
|
Viewed |
|
|
|
Full text
|
|
|
|
|
Abstract
|
|
|
|
|
Cited |
|
|
|
|
| |
Shared |
|
|
|
|
| |
Discussed |
|
|
|
|