| Research article |
|

|
|
|
| Exploration of playa surface crusts in Qehan Lake, China through field investigation and wind tunnel experiments |
LIU Dongwei1, HAN Lijing2,*( ), KOU Zihan1, GAO Xinyu1, WANG Jingjing1 ), KOU Zihan1, GAO Xinyu1, WANG Jingjing1 |
1School of Ecology and Environment, Inner Mongolia University, Hohhot 010021, China
2College of Geography and Remote Sensing Sciences, Xinjiang University, Urumqi 830017, China |
|
|
|
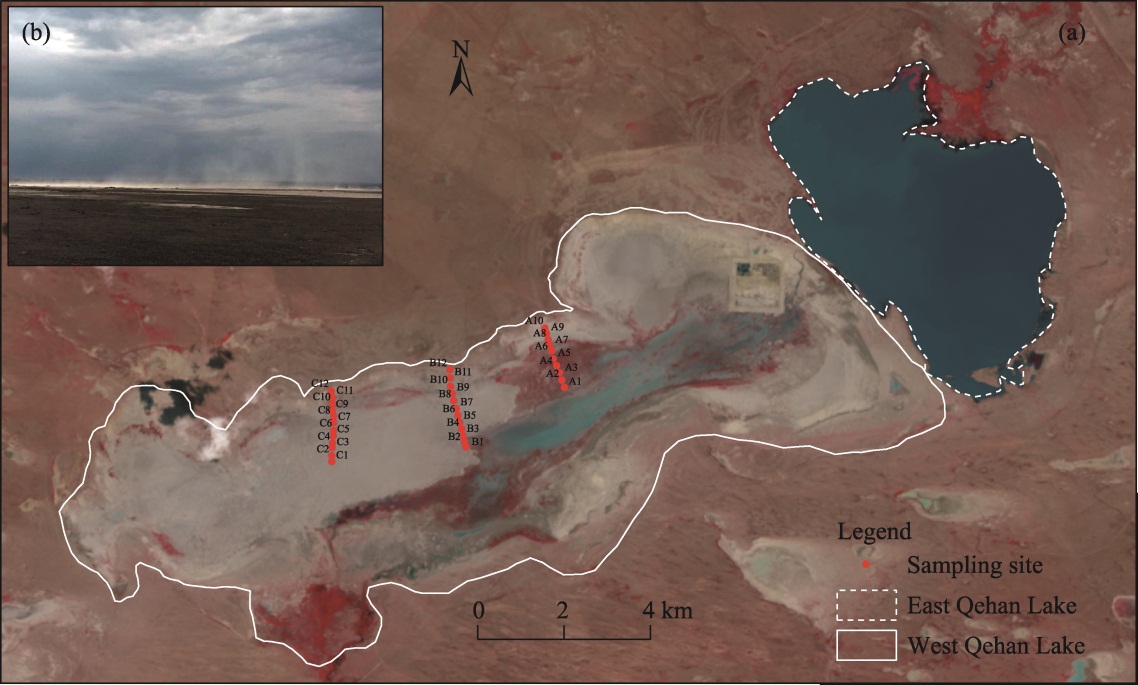
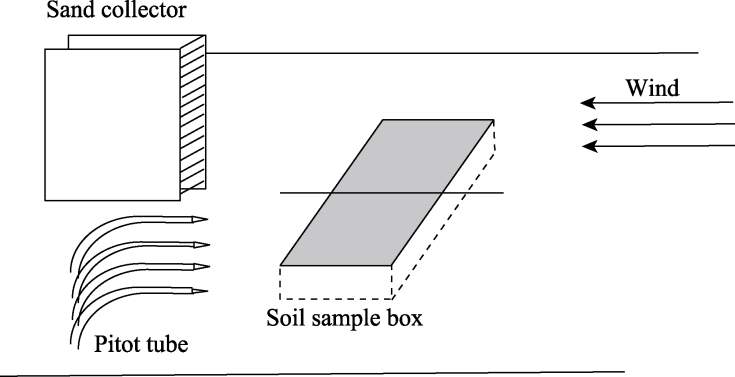
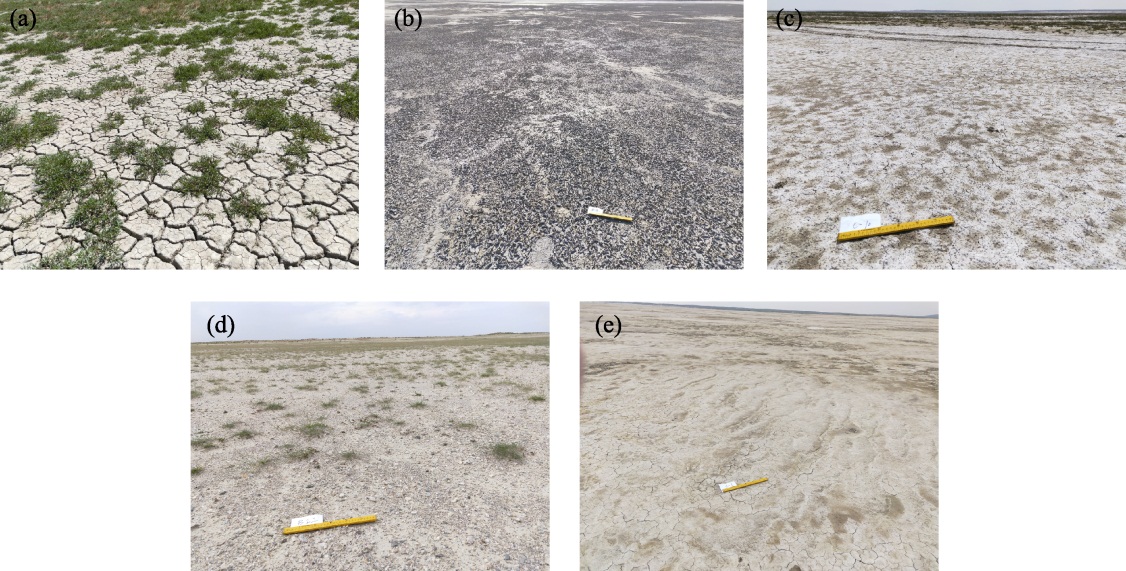
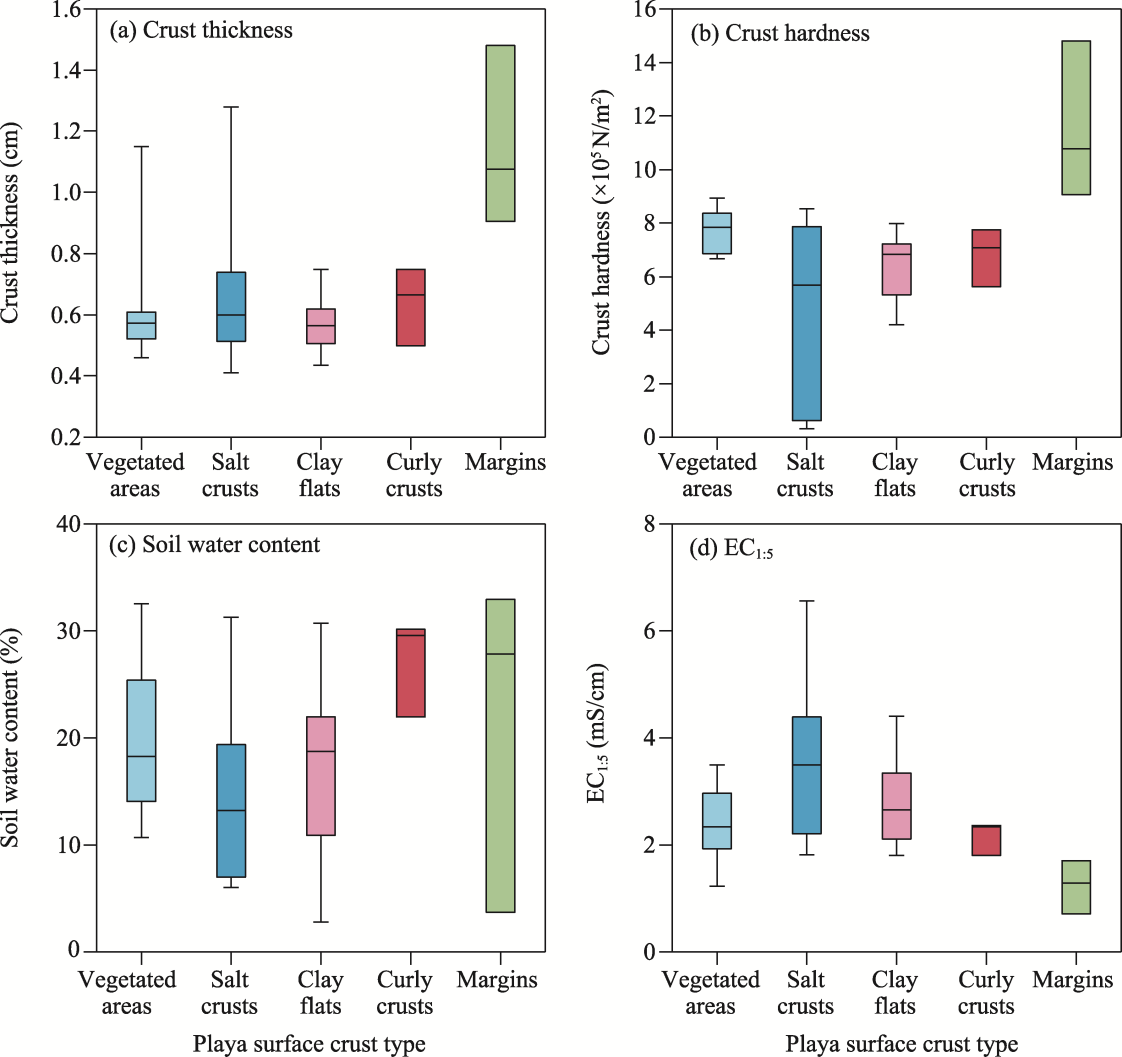
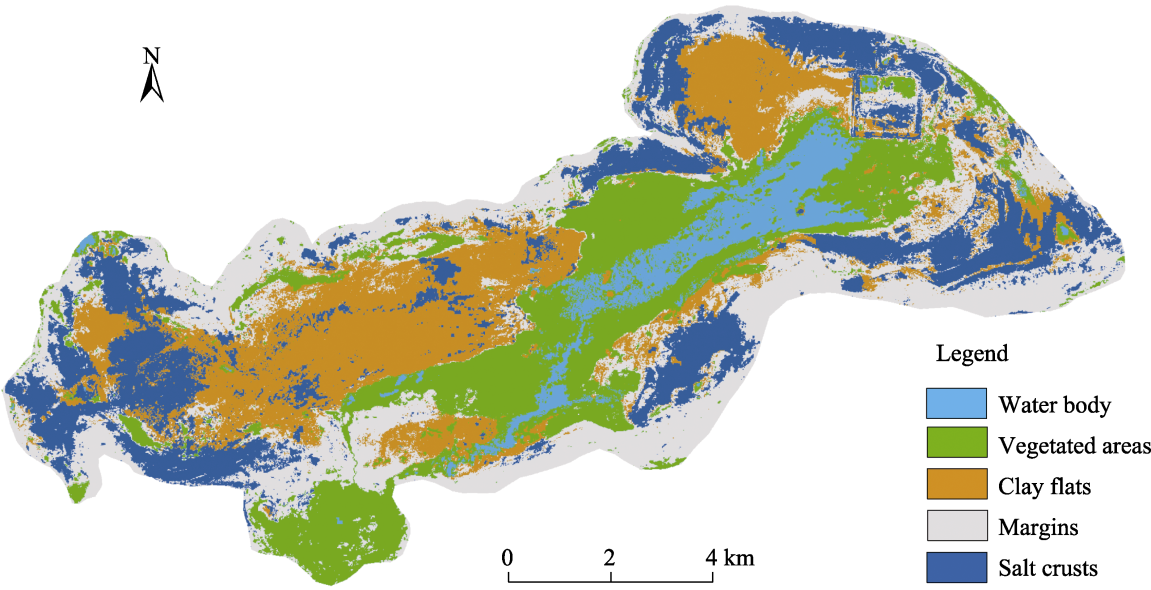
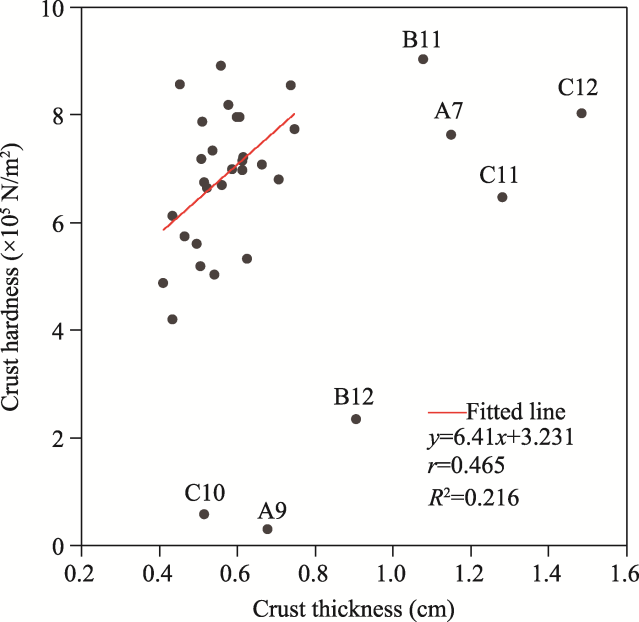
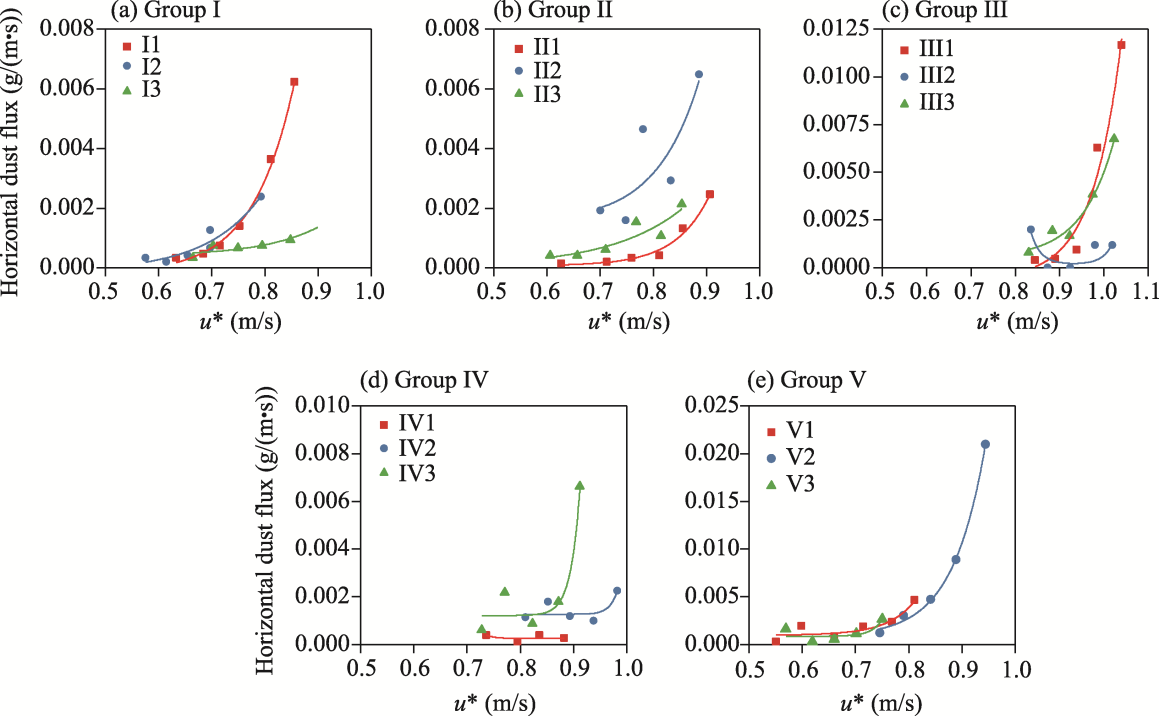
Abstract Globally, many lakes are drying up, leaving exposed lakebeds where wind erosion releases dust and sand rich in salt and harmful heavy metals into the atmosphere. Therefore, understanding the characteristics and spatial distribution of playa surface crusts is important to recognize the manifestation of salt dust storms. The objective of this study was to explore the playa surface crust types as well as their spatial distribution and evolution of Qehan Lake in Inner Mongolia Autonomous Region, China to understand the salt dust release potential of different types of playa surface crusts. Various crust characteristics were investigated by field sampling in Qehan Lake, and playa surface crusts were further divided into five types: vegetated areas, salt crusts, clay flats, curly crusts, and margins. It should be noted that curly crusts were distributed in clay flats and covered only a small area in Qehan Lake. The spatial distribution characteristics of playa surface crust types were obtained by supervised classification of remote sensing images, and the salt dust release potential of crusts was explored by the wind tunnel experiments. The field investigation of Qehan Lake revealed that playa surface crust types had a circum-lake band distribution from the inside to the outside of this lake, which were successively vegetated areas, clay flats, salt crusts, and margins. The spatial distribution patterns of playa surface crust types were mainly controlled by the hydrodynamics of the playa, soil texture, and groundwater. There was a significant negative correlation between crust thickness and electrical conductivity. The results of the wind tunnel experiments showed that the initial threshold of friction wind velocity for the salt dust release was higher in clay flats (0.7-0.8 m/s) than in salt crusts (0.5-0.6 m/s). Moreover, the particle leap impact processes occurring under natural conditions may reduce this threshold value. Salinity was the main factor controlling the difference in the initial threshold of friction wind velocity for the salt dust release of clay flats and salt crusts. This study provides a scientific reference for understanding how salt dust is released from a lakebed, which may be used for ecological restoration of dry salt lakes.
|
|
Received: 13 August 2022
Published: 31 May 2023
|
|
Corresponding Authors:
*HAN Lijing (E-mail: 107556519106@stu.xju.edu.cn)
|
|
|
| [1] |
Alkhayer M, Eghbal M K, Hamzehpour N. 2019. Geomorphic surfaces of eastern Lake Urmia playa and their influence on dust storms. Journal of Applied Sciences & Environmental Management, 23(8): 1511-1520.
|
|
|
| [2] |
Blank R R, Young J A, Allen F L. 1999. Aeolian dust in a saline playa environment, Nevada, U.S.A. Journal of Arid Environments, 41(4): 365-381.
doi: 10.1006/jare.1998.0491
|
|
|
| [3] |
Borlina C S, Rennó N O. 2017. The impact of a severe drought on dust lifting in California's Owens Lake area. Scientific Reports, 7(1): 1-4.
doi: 10.1038/s41598-016-0028-x
|
|
|
| [4] |
Briere P R. 2000. Playa, playa lake, sabkha: Proposed definitions for old terms. Journal of Arid Environments, 45(1): 1-7.
doi: 10.1006/jare.2000.0633
|
|
|
| [5] |
Buck B J, King J, Etyemezian V. 2011. Effects of salt mineralogy on dust emissions, Salton Sea, California. Soil Science Society of America Journal, 75(5): 1971-1985.
doi: 10.2136/sssaj2011.0049
|
|
|
| [6] |
Bullard J E, Harrison S P, Baddock M C, et al. 2020. Preferential dust sources: A geomorphological classification designed for use in global dust-cycle models. Journal of Geophysical Research-Earth Surface, 116: F04034, doi: 10.1029/2011JF002061.
doi: 10.1029/2011JF002061
|
|
|
| [7] |
Cahill T A, Gill T E, Reid J S. 1996. Saltating particles, playa crusts and dust aerosols at Owens (dry) lake, California. Earth Surface Processes & Landforms, 21(1): 621-639.
|
|
|
| [8] |
Chico R J. 1968. Encyclopedia of Earth Science. Berlin: Springer Heidelberg, 865-871.
|
|
|
| [9] |
Chun X, Su R, Liu J Y, et al. 2017. Climatic implications on variations of Qehan Lake in the arid regions of Inner Mongolia during the recent five decades. Environmental Monitoring and Assessment, 189(1): 1-11.
doi: 10.1007/s10661-016-5706-4
|
|
|
| [10] |
Dun H C. 2019. Modeling and simulation of dust emission process in arid and semi-arid regions. MSc Thesis. Lanzhou: Lanzhou University. (in Chinese)
|
|
|
| [11] |
Gill T E. 1996. Eolian sediments generated by anthropogenic disturbance of playas: human impacts on the geomorphic system and geomorphic impacts on the human system. Geomorphology, 17(1-3): 207-228.
doi: 10.1016/0169-555X(95)00104-D
|
|
|
| [12] |
Gillett D A. 1979. Environmental Factors Affecting Dust Emission by Wind Erosion. New York: John Wiley & Sons, 71-91.
|
|
|
| [13] |
Goehring L, Conroy R, Akhter A, et al. 2010. Evolution of mud-crack patterns during repeated drying cycles. Soft Matter, 6(15): 3562-3567.
doi: 10.1039/b922206e
|
|
|
| [14] |
Goehring L. 2013. Evolving fracture patterns: columnar joints, mud cracks and polygonal terrain. Philosophical Transactions of the Royal Society A: Mathematical, Physical and Engineering Sciences, 371(2004): 20120353, doi: 10.1098/rsta.2012.0353.
doi: 10.1098/rsta.2012.0353
|
|
|
| [15] |
Goldstein H L, Breit G N, Reynolds R L. 2017. Controls on the chemical composition of saline surface crusts and emitted dust from a wet playa in the Mojave Desert (USA). Journal of Arid Environments, 140: 50-66.
doi: 10.1016/j.jaridenv.2017.01.010
|
|
|
| [16] |
Gomes L, Bergametti G, Coudé-Gaussen G, et al. 1990. Submicron desert dusts: A sandblasting process. Journal of Geophysical Research: Atmospheres, 95(D9): 13927-13935.
doi: 10.1029/JD095iD09p13927
|
|
|
| [17] |
Gutiérrez-Elorza M, Desir G, Gutiérrez-Santolalla F, et al. 2005. Origin and evolution of playas and blowouts in the semiarid zone of Tierra de Pinares (Duero Basin, Spain). Geomorphology, 72(1-4): 177-192.
doi: 10.1016/j.geomorph.2005.05.009
|
|
|
| [18] |
Hahnenberger M, Perry K D. 2015. Chemical comparison of dust and soil from the Sevier Dry Lake, UT, USA. Atmospheric Environment, 113: 90-97.
doi: 10.1016/j.atmosenv.2015.04.054
|
|
|
| [19] |
Hassani A, Azapagic A, Shokri N. 2021. Global predictions of primary soil salinization under changing climate in the 21st century. Nature communications, 12(1): 6663, doi: 10.1038/s41467-021-26907-3.
doi: 10.1038/s41467-021-26907-3
pmid: 34795219
|
|
|
| [20] |
Houser C A, Nickling W G. 2001. The factors influencing the abrasion efficiency of saltating grains on a clay-crusted playa. Earth Surface Processes & Landforms, 26(5): 491-505.
|
|
|
| [21] |
Huang N, Gu Y D. 2009. Research and development of dust release and sedimentation machine. Advances in Earth Science, 24(11): 1175-1184. (in Chinese)
|
|
|
| [22] |
Krinsley D B. 1970. A Geomorphological and Palaeoclimatological Study of the Playas of Iran: Part I. Prepared for Air Force Cambridge Research Laboratories. Washington, D.C.: Geological Survey, United State Department of the Interior, 277-289.
|
|
|
| [23] |
Krinsley D H, Doornkamp J C. 1973. Atlas of Quartz Sand Surface Textures. In: Cambridge Earth Science Series Cambridge: Cambridge University Press, 91.
|
|
|
| [24] |
Liu D W, Abuduwaili J, Lei J Q, et al. 2011a. Deposition rate and chemical composition of the aeolian dust from a bare saline playa, Ebinur Lake, Xinjiang, China. Water Air & Soil Pollution, 218(1): 175-184.
|
|
|
| [25] |
Liu D W, Abuduwaili J, Lei J Q, et al. 2011b. Wind erosion of saline playa sediments and its ecological effects in Ebinur Lake, Xinjiang, China. Environmental Earth Sciences, 63(2): 241-250.
doi: 10.1007/s12665-010-0690-4
|
|
|
| [26] |
Luo H R, Smith L M, Haukos D A, et al. 1999. Sources of recently deposited sediments in playa wetlands. Wetlands, 19(1): 176-181.
doi: 10.1007/BF03161747
|
|
|
| [27] |
Mardi A H, Khaghani A, MacDonald A B, et al. 2018. The Lake Urmia environmental disaster in Iran: A look at aerosol pollution. Science of The Total Environment, 633: 42-49.
doi: 10.1016/j.scitotenv.2018.03.148
|
|
|
| [28] |
Micklin P. 2016. The future Aral Sea: hope and despair. Environmental Earth Sciences, 75(9): 1-15.
doi: 10.1007/s12665-015-4873-x
|
|
|
| [29] |
Motaghi F A, Hamzehpour H, Mola Ali Abasiyan S, et al. 2020. The wind erodibility in the newly emerged surfaces of Urmia Playa Lake and adjacent agricultural lands and its determining factors. CATENA, 194: 104675, doi: 10.1016/j.catena.2020.104675.
doi: 10.1016/j.catena.2020.104675
|
|
|
| [30] |
Nield J M, Bryant R G, Wiggs G F S, et al. 2015. The dynamism of salt crust patterns on playas. Geology, 43(1): 31-34.
doi: 10.1130/G36175.1
|
|
|
| [31] |
Nield J M, Neuman C M K, O'Brien P, et al. 2016a. Evaporative sodium salt crust development and its wind tunnel derived transport dynamics under variable climatic conditions. Aeolian Research, 23: 51-62.
doi: 10.1016/j.aeolia.2016.09.003
|
|
|
| [32] |
Nield J M, Wiggs G, King J, et al. 2016b. Climate-surface-pore-water interactions on a salt crusted playa: implications for crust pattern and surface roughness development measured using terrestrial laser scanning. Earth Surface Processes & Landforms, 41(6): 738-753.
|
|
|
| [33] |
Pagliai M, Stoops G. 2010. Physical and biological surface crusts and seals. In: Interpretation of Micromorphological Features of Soils and Regoliths (2nd ed.). Amsterdam: Elsevier, 419-440.
|
|
|
| [34] |
Peterson F F. 1980. Holocene desert soil formation under sodium salt influence in a playa-margin environment. Quaternary Research, 13(2): 172-186.
doi: 10.1016/0033-5894(80)90027-7
|
|
|
| [35] |
Prandtl L. 1935. Aerodynamic Theory. Berlin: Springer Berlin Heidelberg, 34-208.
|
|
|
| [36] |
Reynolds R L, Yount J C, Reheis M, et al. 2007. Dust emission from wet and dry playas in the Mojave Desert, USA. Earth Surface Processes & Landforms, 32(12): 1811-1827.
|
|
|
| [37] |
Schoeneberger P J, Wysocki D A, Benham E C, et al. 2012. Field Book for Describing and Sampling Soils (Version 3.0). Natural Resources Conservation Service, National Soil Survey Center, Lincoln, 75-76.
|
|
|
| [38] |
Stout J E. 2003. Seasonal variations of saltation activity on a high plains saline playa: Yellow Lake, Texas. Physical Geography, 24(1): 61-76.
|
|
|
| [39] |
Stout J E. 2007. Simultaneous observations of the critical aeolian threshold of two surfaces. Geomorphology, 85(1-2): 3-16.
doi: 10.1016/j.geomorph.2006.03.034
|
|
|
| [40] |
Sweeney M R, McDonald E V, Etyemezian V. 2011. Quantifying dust emissions from desert landforms, eastern Mojave Desert, USA. Geomorphology, 135(1-2): 21-34.
doi: 10.1016/j.geomorph.2011.07.022
|
|
|
| [41] |
Sweeney M R, Zlotnik V A, Joeckel R M, et al. 2016. Geomorphic and hydrologic controls of dust emissions during drought from Yellow Lake playa, West Texas, USA. Journal of Arid Environments, 133: 37-46.
doi: 10.1016/j.jaridenv.2016.05.007
|
|
|
| [42] |
Tang C, Shi B, Liu C, et al. 2008. Influencing factors of geometrical structure of surface shrinkage cracks in clayey soils. Engineering Geology, 101(3-4): 204-217.
doi: 10.1016/j.enggeo.2008.05.005
|
|
|
| [43] |
Tao S L, Fang J Y, Zhao X, et al. 2015. Rapid loss of lakes on the Mongolian Plateau. Proceedings of the National Academy of Sciences, 112(7): 2281-2286.
|
|
|
| [44] |
Tran K M, Bui H H, Kodikara J, et al. 2019. Soil curling process and its influencing factors. Canadian Geotechnical Journal, 57(3): 408-422.
doi: 10.1139/cgj-2018-0489
|
|
|
| [45] |
Valentin C, Bresson L M. 1992. Morphology, genesis and classification of surface crusts in loamy and sandy soils. Geoderma, 55(3-4): 225-245.
doi: 10.1016/0016-7061(92)90085-L
|
|
|
| [46] |
White W H, Hyslop N P, Trzepla K, et al. 2015. Regional transport of a chemically distinctive dust: Gypsum from White Sands, New Mexico (USA). Aeolian Research, 16: 1-10.
doi: 10.1016/j.aeolia.2014.10.001
|
|
|
| [47] |
Wurtsbaugh W A, Miller C, Null S E, et al. 2017. Decline of the world's saline lakes. Nature Geoscience, 10(11): 816-821.
doi: 10.1038/ngeo3052
|
|
|
| [48] |
Xisarula. 2011. Analysis of chagannoor saline-alkaline soil chemical composition and that’s effect on biological characteristic of Salsa. MSc Thesis. Huhhot: Inner Mongolia Normal University, 12-13. (in Chinese)
|
|
|
| [49] |
Yechieli Y, Wood W W. 2002. Hydrogeologic processes in saline systems: playas, sabkhas, and saline lakes. Earth-Science Reviews, 58(3-4): 343-365.
doi: 10.1016/S0012-8252(02)00067-3
|
|
|
| [50] |
Zhang G Q, Yao T D, Chen W F, et al. 2019. Regional differences of lake evolution across China during 1960s-2015 and its natural and anthropogenic causes. Remote Sensing Environment, 221: 386-404.
doi: 10.1016/j.rse.2018.11.038
|
|
|
| [51] |
Zhang J, Shao Y P, Huang N. 2014. Measurements of dust deposition velocity in a wind-tunnel experiment. Atmospheric Chemistry & Physics, 14(17): 8869-8882.
|
|
|
| [52] |
Zhang J, Teng Z J, Huang N, et al. 2016. Surface renewal as a significant mechanism for dust emission. Atmospheric Chemistry & Physics, 16: 15517-15528.
|
|
|
| [53] |
Zhao F, Liu H, Yin Y, et al. 2011. Vegetation succession prevents dry lake beds from becoming dust sources in the semi-arid steppe region of China. Earth Surface Processes & Landforms, 36(7): 864-871.
|
|
|
| [54] |
Zlotnik V A, Ong J B, Lenters J D, et al. 2012. Quantification of salt dust pathways from a groundwater-fed lake: Implications for solute budgets and dust emission rates. Journal of Geophysical Research: Earth Surface, 117: F02014, doi: 10.1029/2011JF002107.
doi: 10.1029/2011JF002107
|
|
|
|
Viewed |
|
|
|
Full text
|
|
|
|
|
Abstract
|
|
|
|
|
Cited |
|
|
|
|
| |
Shared |
|
|
|
|
| |
Discussed |
|
|
|
|