| Research article |
|

|
|
|
| Temporal and spatial responses of ecological resilience to climate change and human activities in the economic belt on the northern slope of the Tianshan Mountains, China |
ZHANG Shubao1,2, LEI Jun1,2,*( ), TONG Yanjun1,2, ZHANG Xiaolei2,3, LU Danni1,2, FAN Liqin1,2, DUAN Zuliang1 ), TONG Yanjun1,2, ZHANG Xiaolei2,3, LU Danni1,2, FAN Liqin1,2, DUAN Zuliang1 |
1State Key Laboratory of Desert and Oasis Ecology/Key Laboratory of Ecological Safety and Sustainable Development in Arid Lands, Xinjiang Institute of Ecology and Geography, Chinese Academy of Sciences, Urumqi 830011, China
2University of Chinese Academy of Sciences, Beijing 100049, China
3Institute of Geology and Geophysics, Chinese Academy of Sciences, Beijing 100029, China |
|
|
|
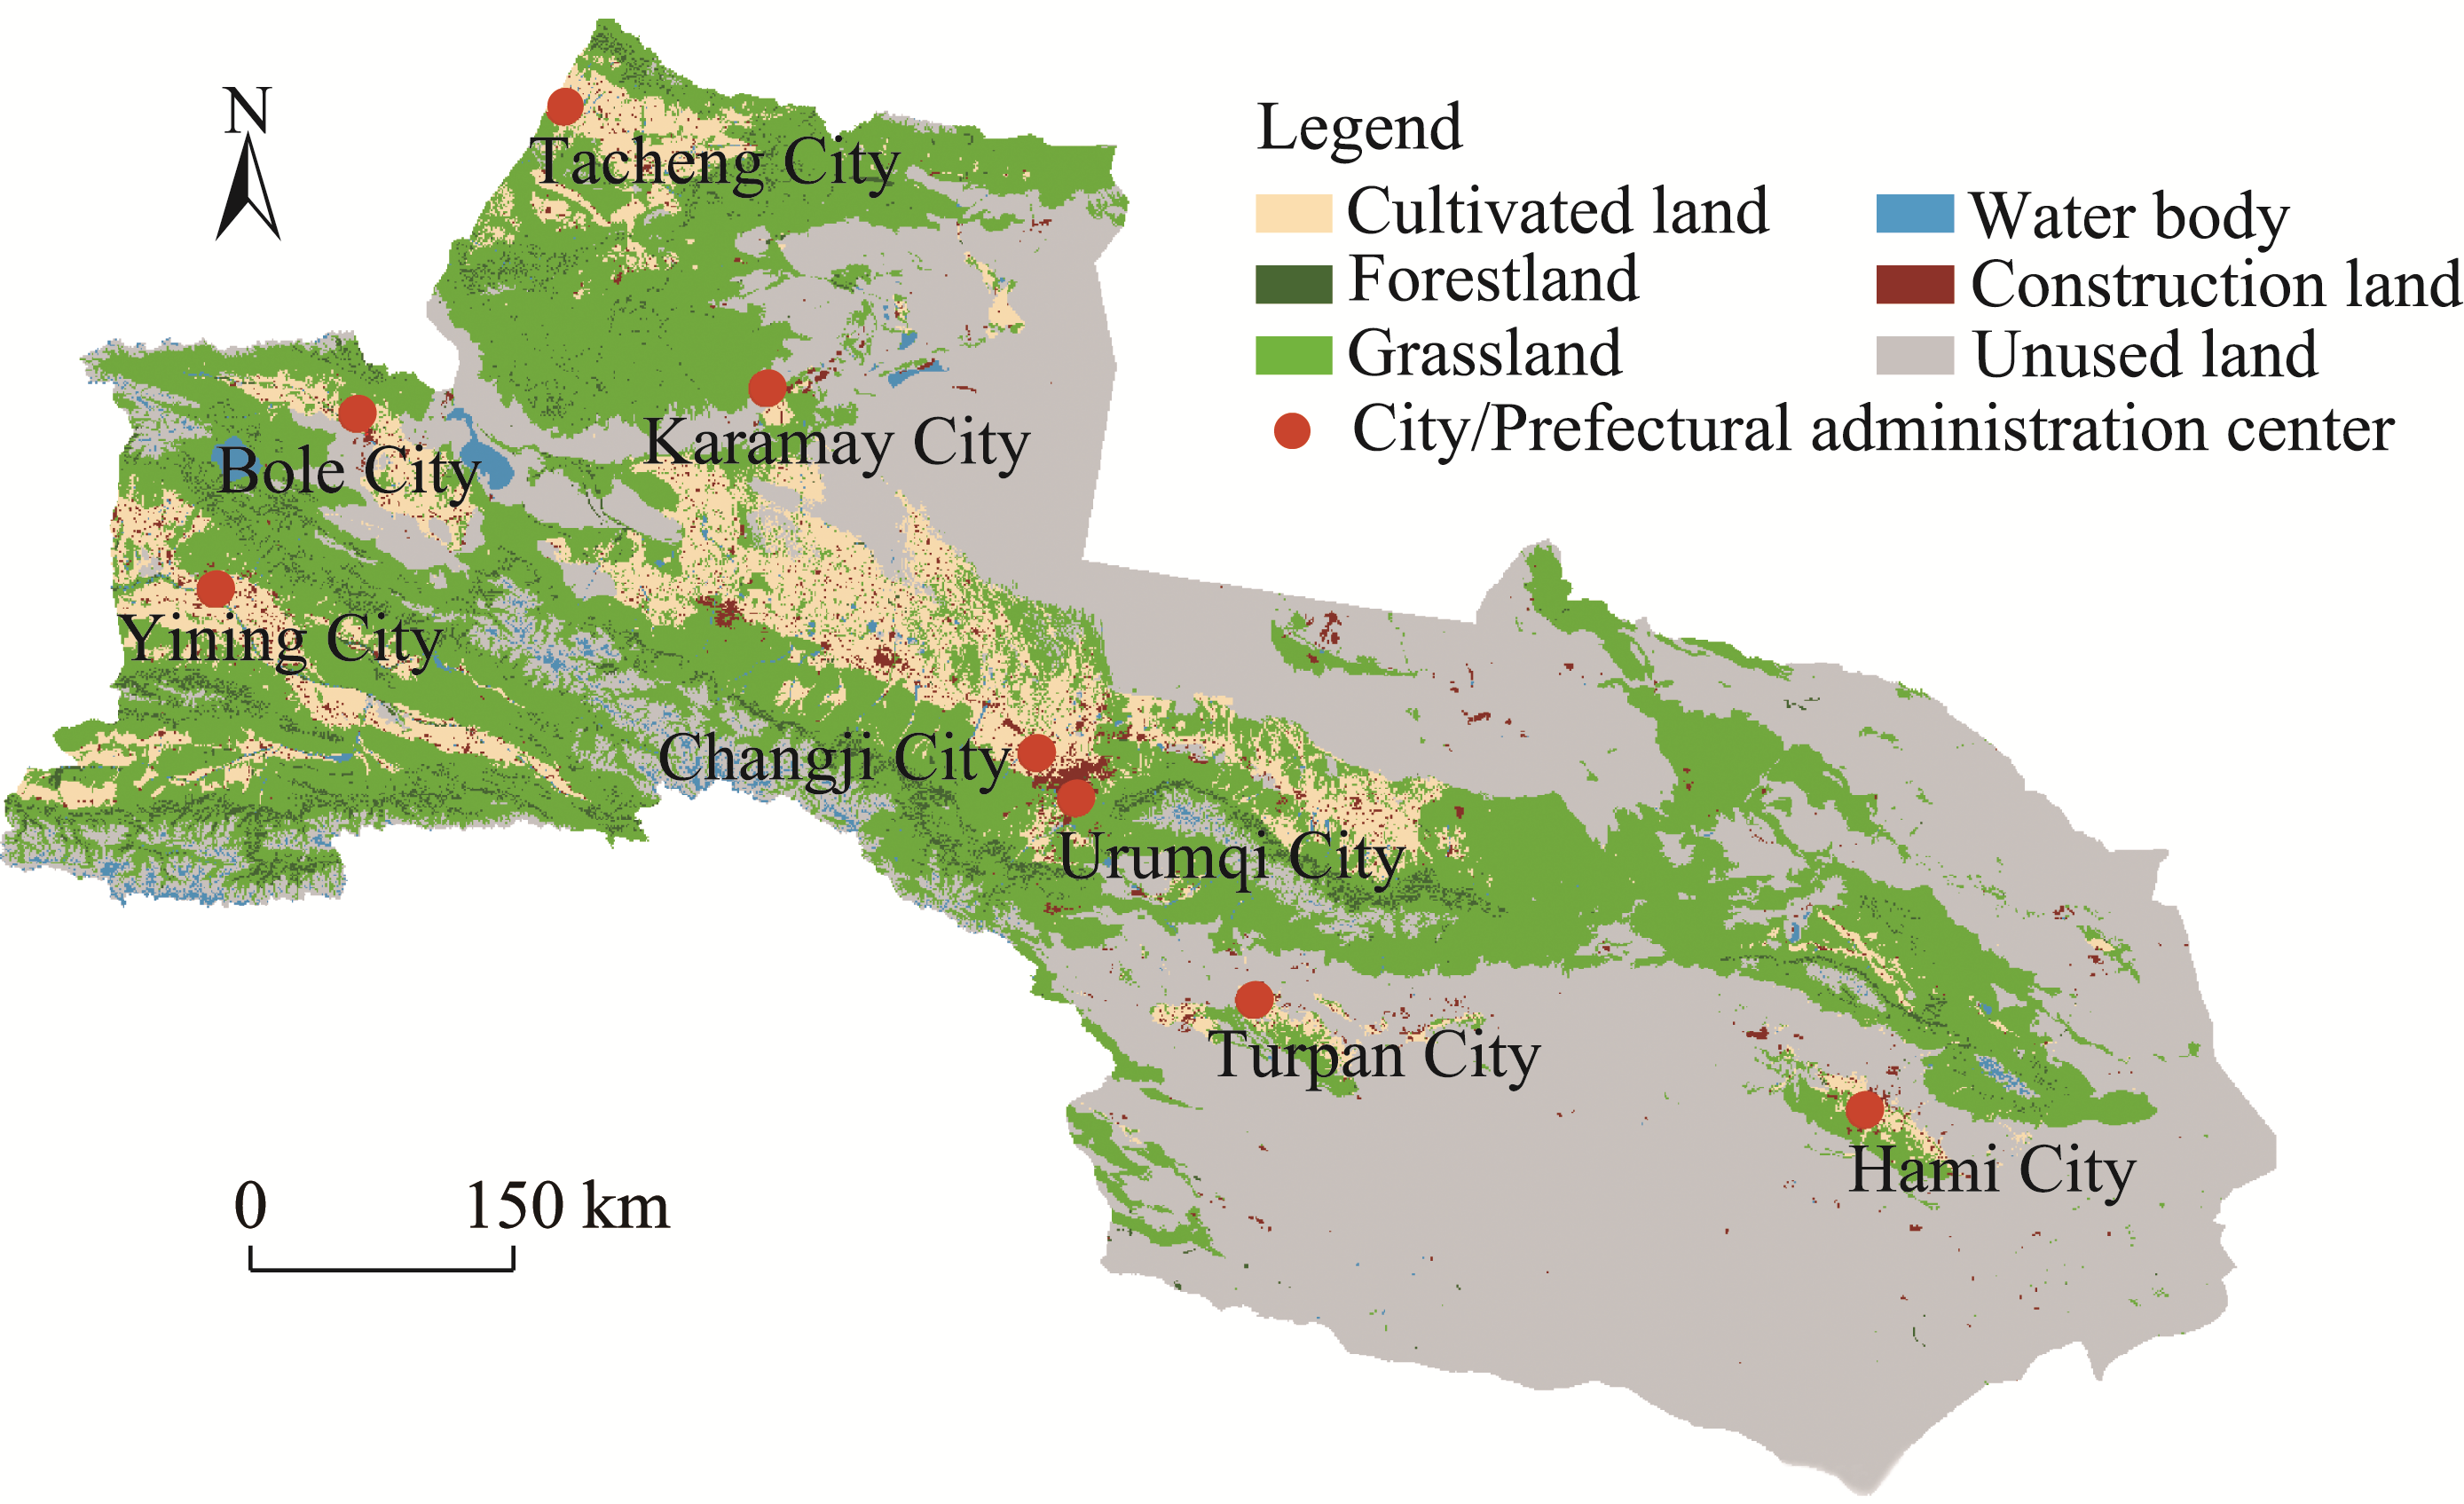
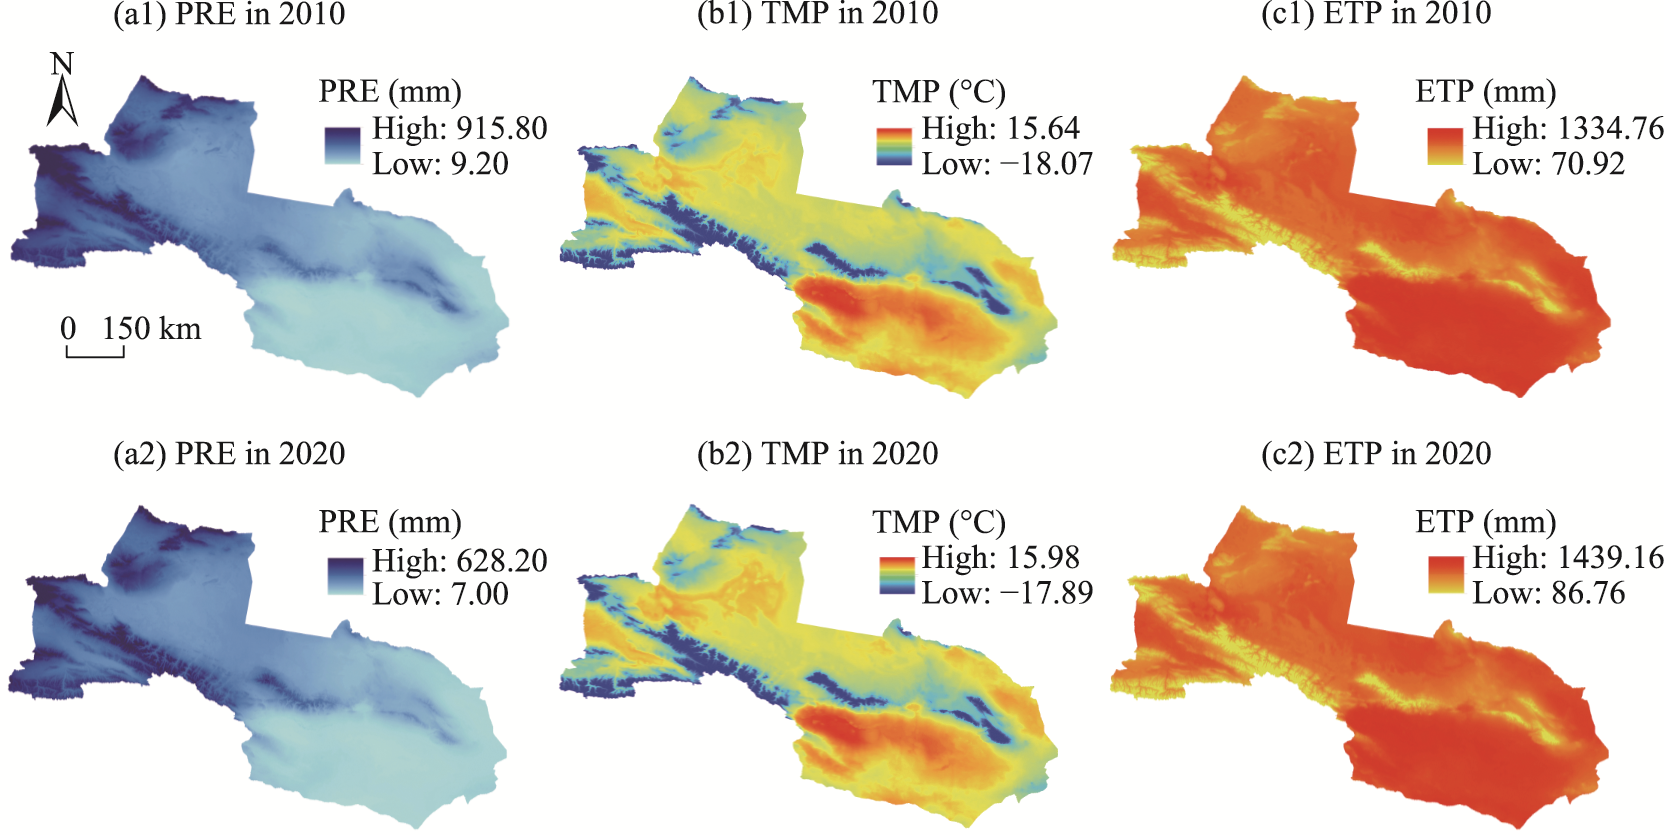
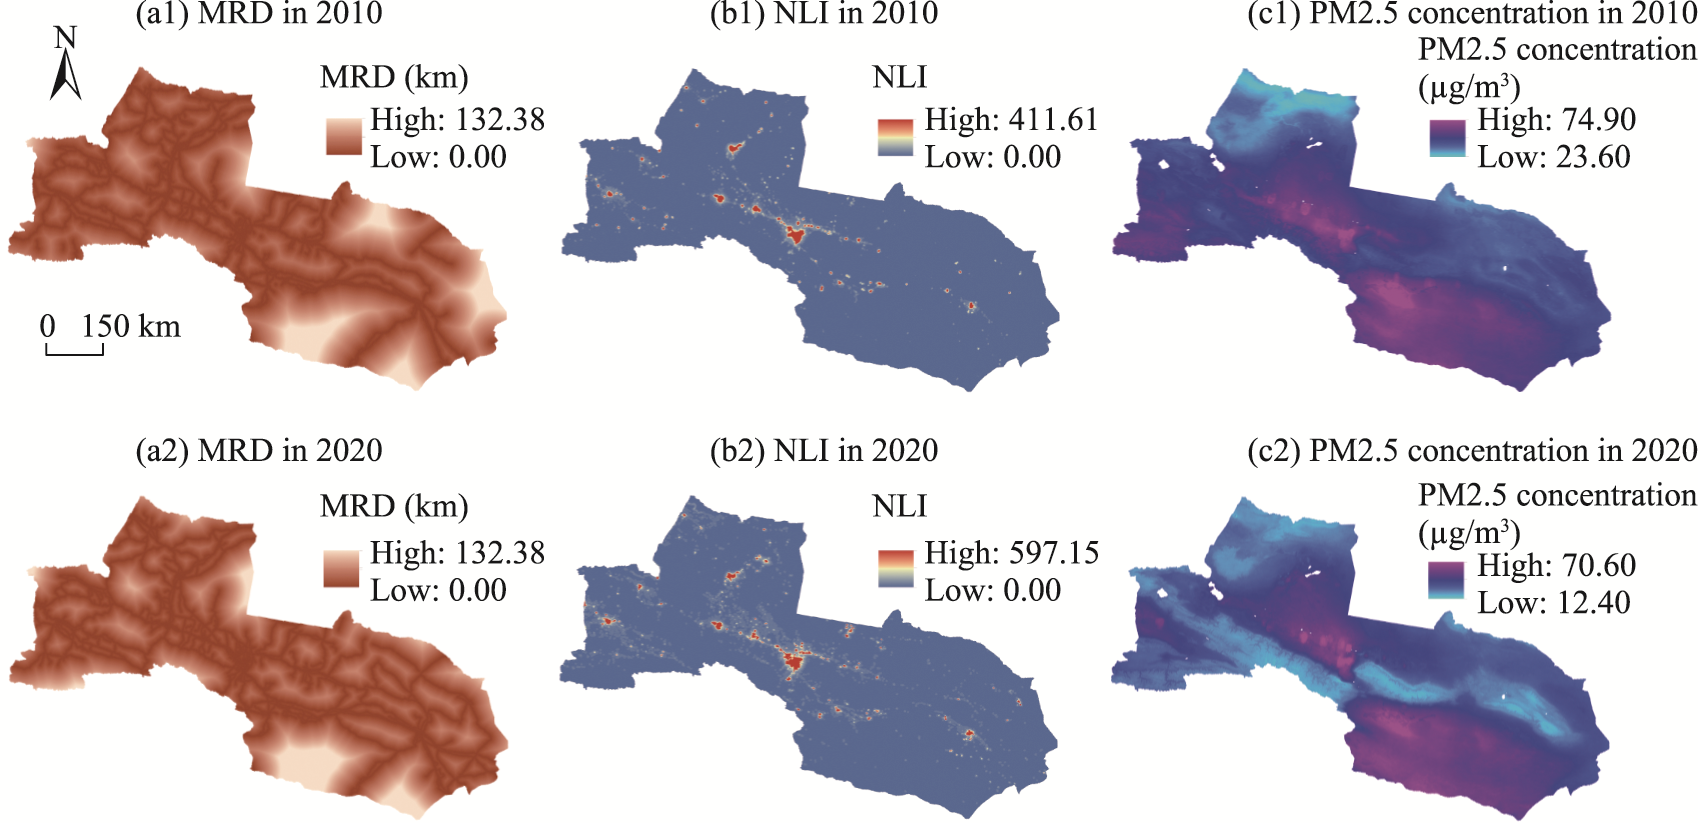
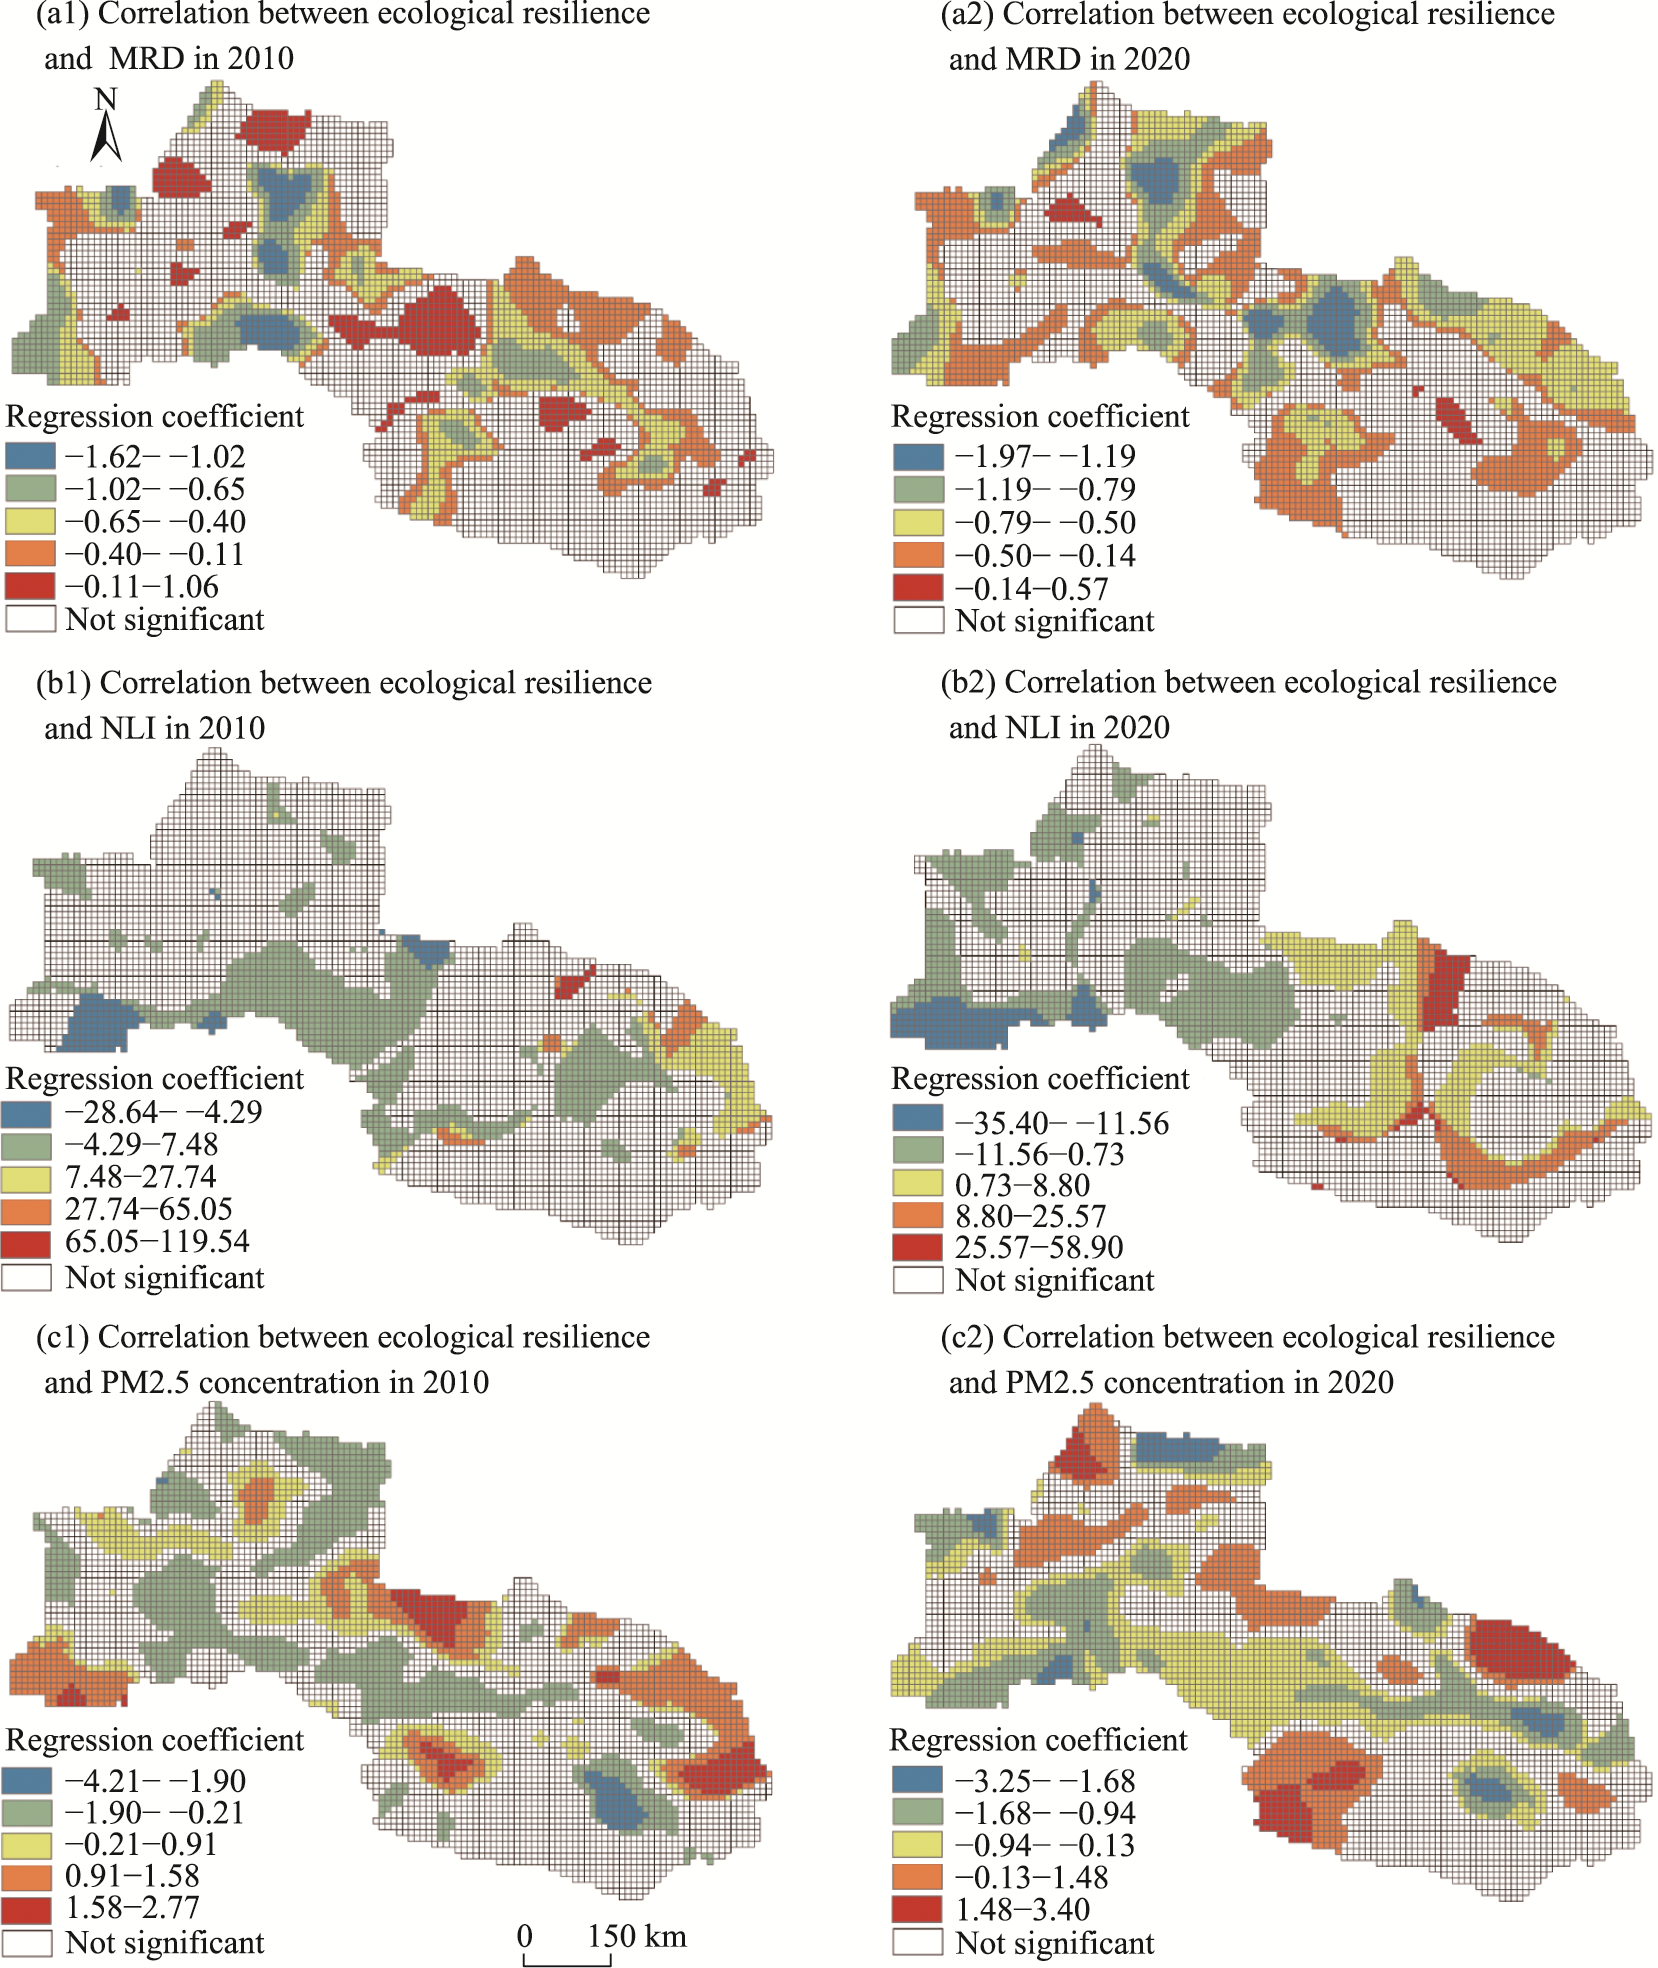
Abstract In the Anthropocene era, human activities have become increasingly complex and diversified. The natural ecosystems need higher ecological resilience to ensure regional sustainable development due to rapid urbanization and industrialization as well as other intensified human activities, especially in arid and semi-arid areas. In the study, we chose the economic belt on the northern slope of the Tianshan Mountains (EBNSTM) in Xinjiang Uygur Autonomous Region of China as a case study. By collecting geographic data and statistical data from 2010 and 2020, we constructed an ecological resilience assessment model based on the ecosystem habitat quality (EHQ), ecosystem landscape stability (ELS), and ecosystem service value (ESV). Further, we analyzed the temporal and spatial variation characteristics of ecological resilience in the EBNSTM from 2010 to 2020 by spatial autocorrelation analysis, and explored its responses to climate change and human activities using the geographically weighted regression (GWR) model. The results showed that the ecological resilience of the EBNSTM was at a low level and increased from 0.2732 to 0.2773 during 2010-2020. The spatial autocorrelation analysis of ecological resilience exhibited a spatial heterogeneity characteristic of "high in the western region and low in the eastern region", and the spatial clustering trend was enhanced during the study period. Desert, Gobi and rapidly urbanized areas showed low level of ecological resilience, and oasis and mountain areas exhibited high level of ecological resilience. Climate factors had an important impact on ecological resilience. Specifically, average annual temperature and annual precipitation were the key climate factors that improved ecological resilience, while average annual evapotranspiration was the main factor that blocked ecological resilience. Among the human activity factors, the distance from the main road showed a negative correlation with ecological resilience. Both night light index and PM2.5 concentration were negatively correlated with ecological resilience in the areas with better ecological conditions, whereas in the areas with poorer ecological conditions, the correlations were positive. The research findings could provide a scientific reference for protecting the ecological environment and promoting the harmony and stability of the human-land relationship in arid and semi-arid areas.
|
|
Received: 10 April 2023
Published: 31 October 2023
|
|
Corresponding Authors:
*LEI Jun (E-mail: leijun@ms.xjb.ac.cn)
|
|
|
| [1] |
Adger W N. 2000. Social and ecological resilience: are they related? Progress in Human Geography, 24(3): 347-364.
doi: 10.1191/030913200701540465
|
|
|
| [2] |
Aizizi Y, Kasimu A, Liang H W, et al. 2023. Evaluation of ecological space and ecological quality changes in urban agglomeration on the northern slope of the Tianshan Mountains. Ecological Indicators, 146: 109896, doi: 10.1016/j.ecolind.2023.109896.
|
|
|
| [3] |
Alberti M, Susskind L. 1996. Managing urban sustainability: An introduction to the special issue. Environmental Impact Assessment Review, 16(4-6): 213-221.
doi: 10.1016/S0195-9255(96)00070-4
|
|
|
| [4] |
Alberti M, Marzluff J M. 2004. Ecological resilience in urban ecosystems: Linking urban patterns to human and ecological functions. Urban Ecosystems, 7(3): 241-265.
doi: 10.1023/B:UECO.0000044038.90173.c6
|
|
|
| [5] |
An S, Zhu X L, Shen M G, et al. 2018. Mismatch in elevational shifts between satellite observed vegetation greenness and temperature isolines during 2000-2016 on the Tibetan Plateau. Global Change Biology, 24(11): 5411-5425.
doi: 10.1111/gcb.14432
pmid: 30156039
|
|
|
| [6] |
Bai L M, Xiu C L, Feng X H, et al. 2019. Influence of urbanization on regional habitat quality: a case study of Changchun City. Habitat International, 93: 102042, doi: 10.1016/j.habitatint.2019.102042.
|
|
|
| [7] |
Braat L C, de Groot R. 2012. The ecosystem services agenda: bridging the worlds of natural science and economics, conservation and development, and public and private policy. Ecosystem Services, 1(1): 4-15.
doi: 10.1016/j.ecoser.2012.07.011
|
|
|
| [8] |
Brunsdon C, Fotheringham S, Charlton M. 1998. Geographically weighted regression. Journal of the Royal Statistical Society: Series D (The Statistician), 47(3): 431-443.
|
|
|
| [9] |
Brunsdon C, Singleton A. 2015. Geocomputation: A Practical Primer. London: SAGE Publications, 201-220.
|
|
|
| [10] |
Cai J M, Guo H, Wang D G. 2012. Review on the resilient city research overseas. Progress in Geography, 31(10): 1245-1255. (in Chinese)
doi: 10.11820/dlkxjz.2012.10.001
|
|
|
| [11] |
Chen C K, Xu L L, Zhao D Y, et al. 2020. A new model for describing the urban resilience considering adaptability, resistance and recovery. Safety Science, 128: 104756, doi: 10.1016/j.ssci.2020.104756.
|
|
|
| [12] |
Chen T, Bao A M, Jiapaer G, et al. 2019. Disentangling the relative impacts of climate change and human activities on arid and semiarid grasslands in Central Asia during 1982-2015. Science of the Total Environment, 653: 1311-1325.
doi: 10.1016/j.scitotenv.2018.11.058
|
|
|
| [13] |
Clements H S, De Vos A, Bezerra J C, et al. 2021. The relevance of ecosystem services to land reform policies: Insights from South Africa. Land Use Policy, 100: 104939, doi: 10.1016/j.landusepol.2020.104939.
|
|
|
| [14] |
Colding J. 2007. 'Ecological land-use complementation' for building resilience in urban ecosystems. Landscape and Urban Planning, 81(1-2): 46-55.
doi: 10.1016/j.landurbplan.2006.10.016
|
|
|
| [15] |
Costanza R, d'Arge R, de Groot R, et al. 1997. The value of the world's ecosystem services and natural capital. Nature, 387(6630): 253-260.
doi: 10.1038/387253a0
|
|
|
| [16] |
Crutzen P J. 2002. Geology of mankind. Nature, 415(6867): 23, doi: 10.1038/415023a.
|
|
|
| [17] |
Cumming G S, Barnes G, Perz S, et al. 2005. An exploratory framework for the empirical measurement of resilience. Ecosystems, 8(8): 975-987.
doi: 10.1007/s10021-005-0129-z
|
|
|
| [18] |
Deng M J, Zhang Y, Li X Q. 2010. Development trend of water supply and water demand in the North of the Tianshan Mountains, Xinjiang. Arid Land Geography, 33(3): 315-324. (in Chinese)
|
|
|
| [19] |
Deng M J. 2020. Development pattern of production-living-ecological spaces and construction of a smart water network system for the economic belt on the north slope of the Tianshan Mountains. Arid Land Geography, 43(5): 1155-1168. (in Chinese)
|
|
|
| [20] |
Dong J H, Zhang Z B, Liu B T, et al. 2022. Spatiotemporal variations and driving factors of habitat quality in the loess hilly area of the Yellow River Basin: A case study of Lanzhou City, China. Journal of Arid Land, 14(6): 637-652.
doi: 10.1007/s40333-022-0097-6
|
|
|
| [21] |
Duo L H, Li Y N, Zhang M, et al. 2022. Spatiotemporal pattern evolution of urban ecosystem resilience based on "resistance-adaptation-vitality": A case study of Nanchang City. Frontiers in Earth Science, 10: 902444, doi: 10.3389/feart.2022.902444.
|
|
|
| [22] |
Durilová A, Saksa M. 2003. Comparative analysis of methodical procedures for evaluation of ecolocical landscape stability (Study area Gajary). Ekológia (Bratislava), 22: 119-129.
|
|
|
| [23] |
Ernstson H, van der Leeuw S E, Redman C L, et al. 2010. Urban transitions: on urban resilience and human-dominated ecosystems. Ambio, 39(8): 531-545.
pmid: 21141773
|
|
|
| [24] |
Fahrig L. 2003. Effects of habitat fragmentation on biodiversity. Annual Review of Ecology, Evolution, and Systematics, 34(1): 487-515.
doi: 10.1146/ecolsys.2003.34.issue-1
|
|
|
| [25] |
Fang C L. 2019. Strategic thinking and spatial layout for the sustainable development of urban agglomeration in northern slope of Tianshan Mountains. Arid Land Geography, 42(1): 1-11. (in Chinese)
|
|
|
| [26] |
Fang Z, Ding T H, Chen J Y, et al. 2022. Impacts of land use/land cover changes on ecosystem services in ecologically fragile regions. Science of the Total Environment, 831: 154967, doi: 10.1016/j.scitotenv.2022.154967.
|
|
|
| [27] |
Fotheringham A S, Brunsdon C, Charlton M. 2002. Geographically Weighted Regression: The Analysis of Spatially Varying Relationships (1st ed.). London: Taylor & Francis, 1-288.
|
|
|
| [28] |
Frommer B. 2013. Climate change and the resilient society: utopia or realistic option for German regions? Natural Hazards, 67(1): 99-115.
doi: 10.1007/s11069-012-0421-0
|
|
|
| [29] |
Fu D F, Bu B, Wu J G, et al. 2019. Investigation on the carbon sequestration capacity of vegetation along a heavy traffic load expressway. Journal of Environmental Management, 241: 549-557.
doi: S0301-4797(18)31108-3
pmid: 30318160
|
|
|
| [30] |
Gao Q, Fang C L, Liu H M, et al. 2021. Conjugate evaluation of sustainable carrying capacity of urban agglomeration and multi-scenario policy regulation. Science of the Total Environment, 785: 147373, doi: 10.1016/j.scitotenv.2021.147373.
|
|
|
| [31] |
Gashaw T, Tulu T, Argaw M, et al. 2018. Estimating the impacts of land use/land cover changes on Ecosystem Service Values: The case of the Andassa watershed in the Upper Blue Nile basin of Ethiopia. Ecosystem Services, 31: 219-228.
doi: 10.1016/j.ecoser.2018.05.001
|
|
|
| [32] |
Gaur M K, Squires V R. 2018. Climate Variability Impacts on Land Use and Livelihoods in Drylands (1st ed.). Cham: Springer International Publishing, 3-20.
|
|
|
| [33] |
Gonzalez P, Neilson R P, Lenihan J M, et al. 2010. Global patterns in the vulnerability of ecosystems to vegetation shifts due to climate change. Global Ecology and Biogeography, 19(6): 755-768.
doi: 10.1111/geb.2010.19.issue-6
|
|
|
| [34] |
Guo E L, Wang Y F, Wang C L, et al. 2021. NDVI indicates long-term dynamics of vegetation and its driving forces from climatic and anthropogenic factors in Mongolian Plateau. Remote Sensing, 13(4): 688, doi: 10.3390/rs13040688.
|
|
|
| [35] |
Guo S S, Wu C Y, Wang Y H, et al. 2022. Threshold effect of ecosystem services in response to climate change, human activity and landscape pattern in the upper and middle Yellow River of China. Ecological Indicators, 136: 108603, doi: 10.1016/j.ecolind.2022.108603.
|
|
|
| [36] |
Ha S C, Kasimu A. 2015. A study on spatial difference of urban intensive land use based on PSR model: A case study of economic belt on northern slope of Tianshan Mountains. Bulletin of Soil and Water Conservation, 35(1): 230-235, 241. (in Chinese)
|
|
|
| [37] |
Han C Q, Zheng J H, Guan J Y, et al. 2022. Evaluating and simulating resource and environmental carrying capacity in arid and semiarid regions: A case study of Xinjiang, China. Journal of Cleaner Production, 338: 130646, doi: 10.1016/j.jclepro.2022.130646.
|
|
|
| [38] |
He J, Shi X Y, Fu Y J. 2021. Identifying vegetation restoration effectiveness and driving factors on different micro-topographic types of hilly Loess Plateau: From the perspective of ecological resilience. Journal of Environmental Management, 289: 112562, doi: 10.1016/j.jenvman.2021.112562.
|
|
|
| [39] |
Hillard E M, Nielsen C K, Groninger J W. 2017. Swamp rabbits as indicators of wildlife habitat quality in bottomland hardwood forest ecosystems. Ecological Indicators, 79: 47-53.
doi: 10.1016/j.ecolind.2017.03.024
|
|
|
| [40] |
Hlásny T. 2003. Landscape heterogeneity as a measure of landscape system entropy. Ekológia (Bratislava), 22: 130-140.
|
|
|
| [41] |
Holling C S. 1973. Resilience and stability of ecological systems. Annual Review of Ecology and Systematics, 4(1): 1-23.
doi: 10.1146/ecolsys.1973.4.issue-1
|
|
|
| [42] |
Hong W Y, Guo R Z, Li X M, et al. 2022. Measuring urban ecological network resilience: A disturbance scenario simulation method. Cities, 131: 104057, doi: 10.1016/j.cities.2022.104057.
|
|
|
| [43] |
Hu B A, Wu H F, Han H R, et al. 2023. Dramatic shift in the drivers of ecosystem service trade-offs across an aridity gradient: Evidence from China's Loess Plateau. Science of the Total Environment, 858: 159836, doi: 10.1016/j.scitotenv.2022.159836.
|
|
|
| [44] |
Huang J P, Ma J R, Guan X D, et al. 2019. Progress in semi-arid climate change studies in China. Advances in Atmospheric Sciences, 36(9): 922-937.
doi: 10.1007/s00376-018-8200-9
|
|
|
| [45] |
Huang L Y, Wang J, Cheng H G. 2022. Spatiotemporal changes in ecological network resilience in the Shandong Peninsula urban agglomeration. Journal of Cleaner Production, 339: 130681, doi: 10.1016/j.jclepro.2022.130681.
|
|
|
| [46] |
Jabareen Y. 2013. Planning the resilient city: Concepts and strategies for coping with climate change and environmental risk. Cities, 31: 220-229.
doi: 10.1016/j.cities.2012.05.004
|
|
|
| [47] |
Jing Y Q, Zhang F, He Y F, et al. 2020. Assessment of spatial and temporal variation of ecological environment quality in Ebinur Lake Wetland National Nature Reserve, Xinjiang, China. Ecological Indicators, 110: 105874, doi: 10.1016/j.ecolind.2019.105874.
|
|
|
| [48] |
Kim J, Choi J, Choi C, et al. 2013. Impacts of changes in climate and land use/land cover under IPCC RCP scenarios on streamflow in the Hoeya River Basin, Korea. Science of the Total Environment, 452-453: 181-195.
doi: 10.1016/j.scitotenv.2013.02.005
|
|
|
| [49] |
Lei J, Wu S X, Zhang X L. 2006. Temporal-spatial characteristics of the urbanization of rural land in Xinjiang. Chinese Journal of Population, Resources and Environment, 4: 37-44.
doi: 10.1080/10042857.2006.10677464
|
|
|
| [50] |
Li D, Yang W P, Huang R Y. 2023. The multidimensional differences and driving forces of ecological environment resilience in China. Environmental Impact Assessment Review, 98: 106954, doi: 10.1016/j.eiar.2022.106954.
|
|
|
| [51] |
Li Q, Yu Y, Catena M R, et al. 2021. Multifactor-based spatio-temporal analysis of effects of urbanization and policy interventions on ecosystem service capacity: A case study of Pingshan River Catchment in Shenzhen City, China. Urban Forestry & Urban Greening, 64: 127263, doi: 10.1016/j.ufug.2021.127263.
|
|
|
| [52] |
Li S, Liu H N. 2022. Spatio-temporal pattern evolution of coupling coordination between urbanization and ecological resilience in arid region: A case of Ningxia Hui Autonomous Region. Arid Land Geography, 45(4): 1281-1290. (in Chinese)
|
|
|
| [53] |
Li X, Xu H M, Chen X L, et al. 2013. Potential of NPP-VIIRS nighttime light imagery for modeling the regional economy of China. Remote Sensing, 5(6): 3057-3081.
doi: 10.3390/rs5063057
|
|
|
| [54] |
Liu Y F, Guo B, Lu M, et al. 2023. Quantitative distinction of the relative actions of climate change and human activities on vegetation evolution in the Yellow River Basin of China during 1981-2019. Journal of Arid Land, 15(1): 91-108.
doi: 10.1007/s40333-022-0079-8
|
|
|
| [55] |
Liu Y X, Fu B J, Wang S, et al. 2020. Research progress of human-earth system dynamics based on spatial resilience theory. Acta Geographica Sinica, 75(5): 891-903. (in Chinese)
doi: 10.11821/dlxb202005001
|
|
|
| [56] |
Long Y, Jiang F G, Deng M L, et al. 2023. Spatial-temporal changes and driving factors of eco-environmental quality in the Three-North Region of China. Journal of Arid Land, 15(3): 231-252.
doi: 10.1007/s40333-023-0053-0
|
|
|
| [57] |
Lu F, Hu H F, Sun W J, et al. 2018. Effects of national ecological restoration projects on carbon sequestration in China from 2001 to 2010. Proceedings of the National Academy of Sciences, 115(16): 4039-4044.
|
|
|
| [58] |
Maguire B, Hagan P. 2007. Disasters and communities: Understanding social resilience. The Australian Journal of Emergency Management, 22(2): 16-20.
|
|
|
| [59] |
Mao D H, He X Y, Wang Z M, et al. 2019. Diverse policies leading to contrasting impacts on land cover and ecosystem services in Northeast China. Journal of Cleaner Production, 240: 117961, doi: 10.1016/j.jclepro.2019.117961.
|
|
|
| [60] |
McGarigal K, Cushman S, Ene E. 2023. FRAGSTATS v4: Spatial pattern analysis program for categorical maps. [2023-02-10]. https://www.fragstats.org.
|
|
|
| [61] |
McKinney M L. 2002. Urbanization, biodiversity, and conservation: The impacts of urbanization on native species are poorly studied, but educating a highly urbanized human population about these impacts can greatly improve species conservation in all ecosystems. BioScience, 52(10): 883-890.
doi: 10.1641/0006-3568(2002)052[0883:UBAC]2.0.CO;2
|
|
|
| [62] |
Meng J N, Fang H W, Huang L, et al. 2022. Multidimensional ecosystem assessment of Poyang Lake under anthropogenic influences. Ecological Modelling, 473: 110134, doi: 10.1016/j.ecolmodel.2022.110134.
|
|
|
| [63] |
Nakaya T, Fotheringham A S, Charlton M, et al. 2009. Semiparametric geographically weighted generalised linear modelling in GWR4.0. In: Lees B G, Laffan S W. The 10th International Conference on GeoComputation. Sydney: The University of New South Wales, 144-148.
|
|
|
| [64] |
National Bureau of Statistics. 2010-2020. China Yearbook of Agricultural Price Survey. Beijing: China Statistics Press. (in Chinese)
|
|
|
| [65] |
Nyström M, Jouffray J B, Norström A V, et al. 2019. Anatomy and resilience of the global production ecosystem. Nature, 575(7781): 98-108.
doi: 10.1038/s41586-019-1712-3
|
|
|
| [66] |
Ortega M, Pascual S, Elena-Rosselló R, et al. 2020. Land-use and spatial resilience changes in the Spanish olive socio-ecological landscape. Applied Geography, 117: 102171, doi: 10.1016/j.apgeog.2020.102171.
|
|
|
| [67] |
Páez A, Wheeler D C. 2009. Geographically weighted regression. In: Kitchin R, Thrift N. International Encyclopedia of Human Geography. Oxford: Elsevier, 407-414.
|
|
|
| [68] |
Pan N H, Guan Q Y, Wang Q Z, et al. 2021. Spatial differentiation and driving mechanisms in ecosystem service value of arid region: A case study in the middle and lower reaches of Shule River Basin, NW China. Journal of Cleaner Production, 319: 128718, doi: 10.1016/j.jclepro.2021.128718.
|
|
|
| [69] |
Pan N H, Du Q Q, Guan Q Y, et al. 2022a. Ecological security assessment and pattern construction in arid and semi-arid areas: A case study of the Hexi Region, NW China. Ecological Indicators, 138: 108797, doi: 10.1016/j.ecolind.2022.108797.
|
|
|
| [70] |
Pan Z Z, Gao G Y, Fu B J. 2022b. Spatiotemporal changes and driving forces of ecosystem vulnerability in the Yangtze River Basin, China: Quantification using habitat-structure-function framework. Science of the Total Environment, 835: 155494, doi: 10.1016/j.scitotenv.2022.155494.
|
|
|
| [71] |
Pendall R, Foster K A, Cowell M. 2009. Resilience and regions: Building understanding of the metaphor. Cambridge Journal of Regions, Economy and Society, 3(1): 71-84.
doi: 10.1093/cjres/rsp028
|
|
|
| [72] |
Peng C, Yuan M H, Gu C L, et al. 2017. A review of the theory and practice of regional resilience. Sustainable Cities and Society, 29: 86-96.
doi: 10.1016/j.scs.2016.12.003
|
|
|
| [73] |
Peng J, Liu Y X, Wu J S, et al. 2015. Linking ecosystem services and landscape patterns to assess urban ecosystem health: A case study in Shenzhen City, China. Landscape and Urban Planning, 143: 56-68.
doi: 10.1016/j.landurbplan.2015.06.007
|
|
|
| [74] |
Qin J X, Hao X M, Hua D, et al. 2021. Assessment of ecosystem resilience in Central Asia. Journal of Arid Environments, 195: 104625, doi: 10.1016/j.jaridenv.2021.104625.
|
|
|
| [75] |
Rapport D J. 2007. Sustainability science: an ecohealth perspective. Sustainability Science, 2(1): 77-84.
doi: 10.1007/s11625-006-0016-3
pmid: 32215110
|
|
|
| [76] |
Reader M O, Eppinga M B, de Boer H J, et al. 2023. Biodiversity mediates relationships between anthropogenic drivers and ecosystem services across global mountain, island and delta systems. Global Environmental Change, 78: 102612, doi: 10.1016/j.gloenvcha.2022.102612.
|
|
|
| [77] |
Sachs J D, Kroll C, Lafortune G, et al. 2022. Sustainable Development Report 2022. Cambridge: Cambridge University Press, 1-82.
|
|
|
| [78] |
Schulze P. 1996. Engineering Within Ecological Constraints (1st ed.). Washington: The National Academies Press, 31-44.
|
|
|
| [79] |
Shi C C, Zhu X P, Wu H W, et al. 2022. Assessment of urban ecological resilience and its influencing factors: A case study of the Beijing-Tianjin-Hebei Urban Agglomeration of China. Land, 11(6): 921, doi: 10.3390/land11060921.
|
|
|
| [80] |
Sklenicka P, Pixova K C. 2004. Importance of spatial heterogeneity to landscape planning and management. Ekológia (Bratislava), 23: 310-319.
|
|
|
| [81] |
Statistic Bureau of Xinjiang Uygur Autonomous Region. 2010-2020. Statistical Yearbook of Xinjiang Uygur Autonomous Region. Beijing: China Statistics Press. (in Chinese)
|
|
|
| [82] |
Tong Y J, Lei J, Zhang S B, et al. 2023. Analysis of the spatial and temporal variability and factors influencing the ecological resilience in the urban agglomeration on the Northern Slope of Tianshan Mountain. Sustainability, 15(6): 4828, doi: 10.3390/su15064828.
|
|
|
| [83] |
Valayamkunnath P, Sridhar V, Zhao W G, et al. 2018. Intercomparison of surface energy fluxes, soil moisture, and evapotranspiration from eddy covariance, large-aperture scintillometer, and modeling across three ecosystems in a semiarid climate. Agricultural and Forest Meteorology, 248: 22-47.
doi: 10.1016/j.agrformet.2017.08.025
|
|
|
| [84] |
Wang K W, Ma H T, Fang C L. 2023. The relationship evolution between urbanization and urban ecological resilience in the Northern Slope Economic Belt of Tianshan Mountains, China. Sustainable Cities and Society, 97: 104783, doi: 10.1016/j.scs.2023.104783.
|
|
|
| [85] |
Wang S J, Cui Z T, Lin J J, et al. 2022. The coupling relationship between urbanization and ecological resilience in the Pearl River Delta. Journal of Geographical Sciences, 32(1): 44-64.
doi: 10.1007/s11442-022-1935-3
|
|
|
| [86] |
Wang T, Li H B, Huang Y. 2021. The complex ecological network's resilience of the Wuhan metropolitan area. Ecological Indicators, 130: 108101, doi: 10.1016/j.ecolind.2021.108101.
|
|
|
| [87] |
Wang Y, Shi R Y, Qiao C L. 2018. Evaluation of water resources carrying capacity based on fuzzy comprehensive evaluation method in northern slope economic belt of Tianshan Mountains. Bulletin of Soil and Water Conservation, 38(5): 206-212, 219. (in Chinese)
|
|
|
| [88] |
Wang Y J, Qin D H. 2017. Influence of climate change and human activity on water resources in arid region of Northwest China: An overview. Advances in Climate Change Research, 8(4): 268-278.
doi: 10.1016/j.accre.2017.08.004
|
|
|
| [89] |
Waters C N, Zalasiewicz J, Summerhayes C, et al. 2016. The Anthropocene is functionally and stratigraphically distinct from the Holocene. Science, 351(6269): aad2622, doi: 10.1126/science.aad2622.
|
|
|
| [90] |
Wei L, Zhou L, Sun D Q, et al. 2022a. Evaluating the impact of urban expansion on the habitat quality and constructing ecological security patterns: A case study of Jiziwan in the Yellow River Basin, China. Ecological Indicators, 145: 109544, doi: 10.1016/j.ecolind.2022.109544.
|
|
|
| [91] |
Wei Q Q, Abudureheman M, Halike A, et al. 2022b. Temporal and spatial variation analysis of habitat quality on the PLUS-InVEST model for Ebinur Lake Basin, China. Ecological Indicators, 145: 109632, doi: 10.1016/j.ecolind.2022.109632.
|
|
|
| [92] |
Wu C G, Zhou Z X, Wang P C, et al. 2010. The concept and measurement of landscape connectivity and its applications. Acta Ecologica Sinica, 30(7): 1903-1910. (in Chinese)
|
|
|
| [93] |
Xia C Y, Dong Z Y Z, Chen B. 2022. Spatio-temporal analysis and simulation of urban ecological resilience: A case study of Hangzhou. Acta Ecologica Sinica, 42(1): 116-126. (in Chinese)
|
|
|
| [94] |
Xiao W, Lv X J, Zhao Y L, et al. 2020. Ecological resilience assessment of an arid coal mining area using index of entropy and linear weighted analysis: A case study of Shendong Coalfield, China. Ecological Indicators, 109: 105843, doi: 10.1016/j.ecolind.2019.105843.
|
|
|
| [95] |
Xie G D, Zhen L, Lu C X, et al. 2008. Expert knowledge based valuation method of ecosystem services in China. Journal of Natural Resources, 23(5): 911-919. (in Chinese)
doi: 10.11849/zrzyxb.2008.05.019
|
|
|
| [96] |
Xie M H, Bai W N, Bai L, et al. 2017. Policy recommendations for industrial green development in the Tianshan Mountain Northern Slope Economic Belt. Strategic Study of CAE, 19(4): 79-87. (in Chinese)
|
|
|
| [97] |
Yan Y B, Chai Z Y, Yang X D, et al. 2021. The temporal and spatial changes of the ecological environment quality of the urban agglomeration on the northern slope of Tianshan Mountain and the influencing factors. Ecological Indicators, 133: 108380, doi: 10.1016/j.ecolind.2021.108380.
|
|
|
| [98] |
Yang S Q, Zhang L X, Zhu G R. 2023a. Effects of transport infrastructures and climate change on ecosystem services in the integrated transport corridor region of the Qinghai-Tibet Plateau. Science of the Total Environment, 885: 163961, doi: 10.1016/j.scitotenv.2023.163961.
|
|
|
| [99] |
Yang Z Y, Zhang S B, Lei J, et al. 2023b. Evolution of economic linkage network of the cities and counties on the northern slope of the Tianshan Mountains, China. Regional Sustainability, 4(2): 173-184.
doi: 10.1016/j.regsus.2023.05.002
|
|
|
| [100] |
Yuan Y, Bai Z K, Zhang J N, et al. 2022. Increasing urban ecological resilience based on ecological security pattern: A case study in a resource-based city. Ecological Engineering, 175: 106486, doi: 10.1016/j.ecoleng.2021.106486.
|
|
|
| [101] |
Zhang F, Wang Y S, Jim C Y, et al. 2023. Analysis of urban expansion and human-land coordination of oasis town groups in the Core Area of Silk Road Economic Belt, China. Land, 12(1): 224, doi: 10.3390/land12010224.
|
|
|
| [102] |
Zhang L F, Fang C L, Zhu C, et al. 2022. Ecosystem service trade-offs and identification of eco-optimal regions in urban agglomerations in arid regions of China. Journal of Cleaner Production, 373: 133823, doi: 10.1016/j.jclepro.2022.133823.
|
|
|
| [103] |
Zhang X X, Gu X C, Cheng C X, et al. 2020a. Spatiotemporal heterogeneity of PM2.5 and its relationship with urbanization in North China from 2000 to 2017. Science of the Total Environment, 744: 140925, doi: 10.1016/j.scitotenv.2020.140925.
|
|
|
| [104] |
Zhang Z P, Xia F Q, Yang D G, et al. 2020b. Spatiotemporal characteristics in ecosystem service value and its interaction with human activities in Xinjiang, China. Ecological Indicators, 110: 105826, doi: 10.1016/j.ecolind.2019.105826.
|
|
|
| [105] |
Zhao R D, Fang C L, Liu H M, et al. 2021. Evaluating urban ecosystem resilience using the DPSIR framework and the ENA model: A case study of 35 cities in China. Sustainable Cities and Society, 72: 102997, doi: 10.1016/j.scs.2021.102997.
|
|
|
| [106] |
Zhao Y H, Qu Z, Zhang Y, et al. 2022. Effects of human activity intensity on habitat quality based on nighttime light remote sensing: A case study of Northern Shaanxi, China. Science of the Total Environment, 851: 158037, doi: 10.1016/j.scitotenv.2022.158037.
|
|
|
| [107] |
Zhu C, Fang C L, Zhang L F. 2023. Analysis of the coupling coordinated development of the Population-Water-Ecology- Economy system in urban agglomerations and obstacle factors discrimination: A case study of the Tianshan North Slope Urban Agglomeration, China. Sustainable Cities and Society, 90: 104359, doi: 10.1016/j.scs.2022.104359.
|
|
|
|
Viewed |
|
|
|
Full text
|
|
|
|
|
Abstract
|
|
|
|
|
Cited |
|
|
|
|
| |
Shared |
|
|
|
|
| |
Discussed |
|
|
|
|