| Research article |
|


|
|
|
| Ecosystem service values of gardens in the Yellow River Basin, China |
GE Qianqian1,2, XU Wenjie3, FU Meichen1, HAN Yingxin4, AN Guoqiang4,5,6,*( ), XU Yuetong4 ), XU Yuetong4 |
1School of Land Science and Technology, China University of Geosciences (Beijing), Beijing 100083, China
2China Land Surveying and Planning Institute, Beijing 100035, China
3Shandong Urban and Rural Planning Design Institute, Jinan 250013, China
4Territorial Spatial Planning Institute of Shandong Province, Jinan 250014, China
5College of Geography and Environment, Shandong Normal University, Jinan 250358, China
6Key Laboratory of Land Use, Ministry of Natural Resources, Shandong Basis, Jinan 250014, China |
|
|
|
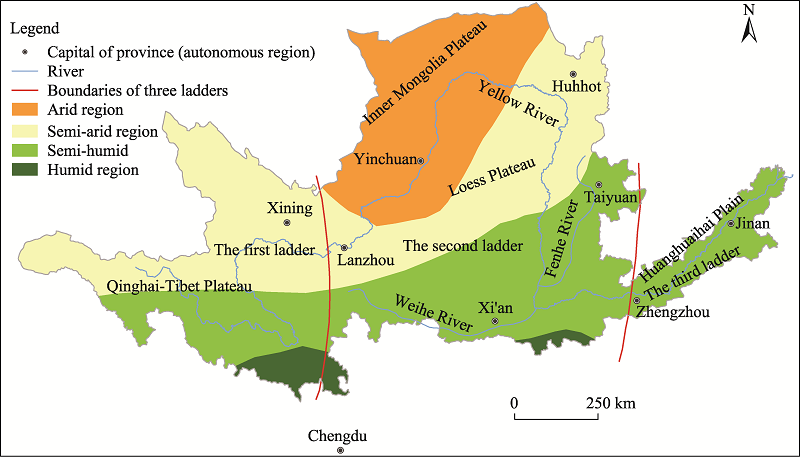
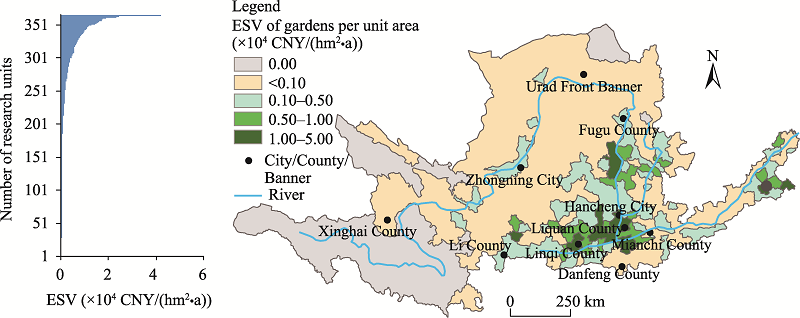
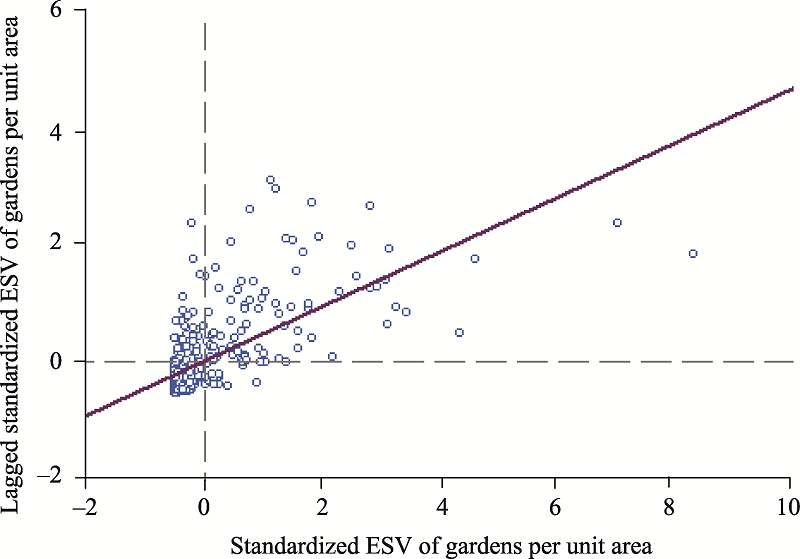
Abstract Studies on the ecosystem service value (ESV) of gardens are critical for informing evidence- based land management practices based on an understanding of the local ecosystem. By analyzing equivalent value factors (EVFs), this paper evaluated the values of 11 ecosystem services of gardens in the Yellow River Basin of China in 2019. High-precision land use survey data were used to improve the accuracy of the land use classification, garden areas, and spatial distribution of the ESVs of gardens. The results showed that garden ecosystem generally had high ESVs, especially in terms of the ESV of food production, which is worthy of further research and application to the practice of land use planning and management. Specifically, the value of one standard EVF of ecosystem services in 2019 was 3587.04 CNY/(hm2•a), and the ESV of food production of gardens was much higher than that of croplands. Garden ecosystem provided an ESV of 1348.66×108 CNY/a in the Yellow River Basin. The areas with the most concentrated ESVs of gardens were located in four regions: downstream in the Shandong-Henan zone along the Yellow River, mid-stream in the Shanxi-Shaanxi zone along the Yellow River, the Weihe River Basin, and upstream in the Qinghai-Gansu-Ningxia-Inner Mongolia zone along the Yellow River. The spatial correlation of the ESVs in the basin was significant (global spatial autocorrelation index Moran's I=0.464), which implied that the characteristics of high ESVs adjacent to high ESVs and low ESVs adjacent to low ESVs are prominent. In the Yellow River Basin, the contribution of the ESVs of gardens to the local environment and economy varied across regions. We also put forward some suggestions for promoting the construction of ecological civilization in the Yellow River Basin. The findings of this study provide important contributions to the research of ecosystem service evaluation in the Yellow River Basin.
|
|
Received: 17 May 2021
Published: 31 March 2022
|
|
Corresponding Authors:
*AN Guoqiang (E-mail: an_tiger_@163.com)
|
|
|
| [1] |
An G Q, Huang H H, Liu Z, et al. 2022. Research progress on land use and ecosystem service value assessment in China. Journal of University of Jinan (Science and Technology), 36(1): 28-37. (in Chinese)
|
|
|
| [2] |
Baumgärtner J, Bieri M. 2006. Fruit tree ecosystem service provision and enhancement. Ecological Engineering, 27(2): 118-123.
doi: 10.1016/j.ecoleng.2005.12.005
|
|
|
| [3] |
Boumans R, Roman J, Altman I, et al. 2015. The multi-scale integrated model of ecosystem services (MIMES): Simulating the interactions of coupled human and natural systems. Ecosystem services, 12: 30-41.
doi: 10.1016/j.ecoser.2015.01.004
|
|
|
| [4] |
Calvet-Mir L, Gómez-Baggethun E, Reyes-García V. 2012. Beyond food production: Ecosystem services provided by home gardens. A case study in Vall Fosca, Catalan Pyrenees, Northeastern Spain. Ecological Economics, 74: 153-160.
doi: 10.1016/j.ecolecon.2011.12.011
|
|
|
| [5] |
Cao S X, Liu Y J, Su W, et al. 2018. The net ecosystem services value in mainland China. Scientia Sinica Terrae, 48(3): 331-339. (in Chinese)
doi: 10.1360/N072017-00144
|
|
|
| [6] |
Chen J, Wu D W. 2011. Service value assessment of orchard ecosystem: A case of Putian City of Fujian. Chinese Journal of Applied Ecology, 22(9): 2399-2404. (in Chinese)
|
|
|
| [7] |
Cilliers S S, Siebert S J, Du Toit M J, et al. 2018. Garden ecosystem services of Sub-Saharan Africa and the role of health clinic gardens as social-ecological systems. Landscape and Urban Planning, 180: 294-307.
doi: 10.1016/j.landurbplan.2017.01.011
|
|
|
| [8] |
Costanza R, d'Arge R, de Groot R, et al. 1997. The value of the world's ecosystem services and natural capital. Nature, 387(15): 253-260.
doi: 10.1038/387253a0
|
|
|
| [9] |
Costanza R, de Groot R, Sutton P, et al. 2014. Changes in the global value of ecosystem services. Global Environmental Change, 26: 152-158.
doi: 10.1016/j.gloenvcha.2014.04.002
|
|
|
| [10] |
Costanza R, de Groot R, Braat L, et al. 2017. Twenty years of ecosystem services: how far have we come and how far do we still need to go? Ecosystem Services, 28: 1-16.
doi: 10.1016/j.ecoser.2017.09.008
|
|
|
| [11] |
Daily G C. 1997. Nature's Services:Societal Dependence on Natural Ecosystems. Washington, DC: Island Press, 220-221.
|
|
|
| [12] |
de Groot R, Brander L, van der Ploeg S, et al. 2012. Global estimates of the value of ecosystems and their services in monetary units. Ecosystem Services, 1: 50-61.
doi: 10.1016/j.ecoser.2012.07.005
|
|
|
| [13] |
European Environment Agency. 2022. CICES towards a common classification of ecosystem services: Structure of CICES. [2022-02-20]. https://cices.eu/cices-structure/ .
|
|
|
| [14] |
Fu B J, Zhang L W. 2014. Land-use change and ecosystem services: Concepts, methods, and progress. Progress in Geography, 33(4): 441-446. (in Chinese)
|
|
|
| [15] |
General Administration of Quality Supervision, Inspection and Quarantine of the People's Republic of China AQSIQ and Standardization Administration of the People's Republic of China(SAC). 2017. Current Land Use Classification (GB/T 21010-2017). Beijing: Standards Press of China, 2-3. (in Chinese)
|
|
|
| [16] |
Gong S H, Xiao Y, Xiao Y,, et al. 2017. Driving forces and their effects on water conservation services in forest ecosystems in China. Chinese Geographical Science, 27(2): 216-228.
doi: 10.1007/s11769-017-0860-3
|
|
|
| [17] |
Grammatikopoulou I, Vackárová D. 2021. The value of forest ecosystem services: A meta-analysis at the European scale and application to national ecosystem accounting. Ecosystem Services, 48: 101262, doi: 10.1016/j.ecoser.2021.101262.
doi: 10.1016/j.ecoser.2021.101262
|
|
|
| [18] |
Gu J H, Xue H Z, Dong G T, et al. 2021. Effects of NDVI/land-use on spatiotemporal changes of evapotranspiration in the Yellow River Basin. Arid Land Geography, 44(1): 158-167. (in Chinese)
|
|
|
| [19] |
Hu Z N, Yang X, Yang J J, et al. 2021. Linking landscape pattern, ecosystem service value, and human well-being in Xishuangbanna, southwest China: Insights from a coupling coordination model. Global Ecology and Conservation, 27: e01583, doi: 10.1016/j.gecco.2021.e01583.
doi: 10.1016/j.gecco.2021.e01583
|
|
|
| [20] |
Kumar P. 2010. The Economics of Ecosystems and Biodiversity: Ecological and Economic Foundations. London and Washington: Earthscan, 189-196.
|
|
|
| [21] |
Labiosa W B, Forney W M, Esnard A M, et al. 2013. An integrated multi-criteria scenario evaluation web tool for participatory land-use planning in urbanized areas: The ecosystem portfolio model. Environmental Modelling & Software, 41: 210-222.
|
|
|
| [22] |
Li G D, Fang C L, Wang S J. 2016a. Exploring spatiotemporal changes in ecosystem-service values and hotspots in China. Science of the Total Environment, 546: 609-620.
|
|
|
| [23] |
Li Q, Wen W J, Wang X J. 2016b. Key issues for the development of a forest ecological compensation mechanism. Acta Ecologica Sinica, 36(6): 1481-1490. (in Chinese)
|
|
|
| [24] |
Lin B, Egerer M. 2019. Global social and environmental change drives the management and delivery of ecosystem services from urban gardens: A case study from central coast, California. Global Environmental Change, 60: 1-10.
|
|
|
| [25] |
Liu J J, Wang J, Dai J W, et al. 2021. The relationship between supply and demand of ecosystem services and its spatio-temporal variation in the Yellow River Basin. Journal of Natural Resources, 36(1): 148-161. (in Chinese)
doi: 10.31497/zrzyxb.20210110
|
|
|
| [26] |
McCauley D J. 2006. Selling out on nature. Nature, 443: 27-28.
doi: 10.1038/443027a
|
|
|
| [27] |
Millennium Ecosystem Assessment. 2005. Ecosystems and human well-being: Synthesis. [2021-12-20]. http://www.Millenniumassessment.org/en/index.html .
|
|
|
| [28] |
Ministry of Natural Resources of the People's Republic of China (MNR). 2021. Communique of main data of the third round national land survey. [2021-08-25]. http://www.mnr.gov.cn/dt/ywbb/202108/t20210826_2678340.html . (in Chinese)
|
|
|
| [29] |
National Bureau of Statistics. 2011. China Statistical Yearbook. Beijing:China Statistics Press. [2021-12-20] http://www.stats.gov.cn/tjsj/ndsj/2011/indexch.htm . (in Chinese)
|
|
|
| [30] |
National Bureau of Statistics. 2020a. China Statistical Yearbook. Beijing:China Statistics Press. [2021-12-20] http://www.stats.gov.cn/tjsj/ndsj/2020/indexch.htm . (in Chinese)
|
|
|
| [31] |
National Bureau of Statistics. 2020b. China Rural Statistical Yearbook. Beijing: China Statistics Press, 111-240. (in Chinese)
|
|
|
| [32] |
Nelson E, Mendoza G, Regetz J, et al. 2009. Modeling multiple ecosystem services, biodiversity conservation, commodity production, and tradeoffs at landscape scales. Frontiers in Ecology and the Environment, 7(1): 4-11.
doi: 10.1890/080023
|
|
|
| [33] |
Ojea E, Loureiro M L, Alló M, et al. 2016. Ecosystem services and REDD: estimating the benefits of non-carbon services in worldwide forests. World Development, 78: 246-261.
doi: 10.1016/j.worlddev.2015.10.002
|
|
|
| [34] |
Qian D W, Cao G M, Du Y G, et al. 2020. Spatio-temporal dynamics of ecosystem service value in the southern slope of Qilian Mountain from 2000 to 2015. Acta Ecologica Sinca, 40(4): 1392-1404. (in Chinese)
|
|
|
| [35] |
Qu Y B, Zhao Y Y, Ding G D, et al. 2021. Spatiotemporal patterns of the forage-livestock balance in the Xilin Gol steppe, China: implications for sustainably utilizing grassland-ecosystem services. Journal of Arid Land, 13(2):135-151.
doi: 10.1007/s40333-021-0053-x
|
|
|
| [36] |
Song W, Deng X Z. 2017. Land-use/land-cover change and ecosystem service provision in China. Science of the Total Environment, 576: 705-719.
doi: 10.1016/j.scitotenv.2016.07.078
|
|
|
| [37] |
Terrado M, Sabater S, Chaplin-Kramer B, et al. 2016. Model development for the assessment of terrestrial and aquatic habitat quality in conservation planning. Science of the Total Environment, 540: 63-70.
doi: 10.1016/j.scitotenv.2015.03.064
|
|
|
| [38] |
Thompson S C G, Barton M A. 1994. Ecocentric and anthropocentric attitudes toward the environment. Journal of Environmental Psychology, 14(2): 149-157.
doi: 10.1016/S0272-4944(05)80168-9
|
|
|
| [39] |
Tian Z H, Wang Y N. 2011. Eco-economic value of soil conservation service of orchard ecosystems in Beijing mountainous area: A case study of orchard in Pinggu district of Beijing. Scientia Silvae Sinicae, 47(12): 165-171. (in Chinese)
|
|
|
| [40] |
Tian Z H, Liu R H. 2014. The eco-economic value of gas regulation service of orchard ecosystems in Beijing mountainous area: A case study of orchard in Pinggu district of Beijing. Ecological Economy, 30(11): 165-169. (in Chinese)
|
|
|
| [41] |
Villa F, Athanasiadis I N, Rizzoli A E. 2009. Modelling with knowledge: A review of emerging semantic approaches to environmental modelling. Environmental Modelling & Software, 24(5): 577-587.
|
|
|
| [42] |
Wang J H, Lu X G, Jiang M. 2007. Evaluation of ecosystem services of park of Nanhu Lake in Changchun City, China. Wetland Science, 5(2): 159-165. (in Chinese)
|
|
|
| [43] |
Willemen L, Crossman N D, Newsom D, et al. 2019. Aggregate effects on ecosystem services from certification of tea farming in the Upper Tana River Basin, Kenya. Ecosystem Services, 38: 10096, doi: 10.1016/j.ecoser.2019.100962.
|
|
|
| [44] |
Xie G D, Lu C X, Leng Y F, et al. 2003. Ecological assets valuation of the Tibetan Plateau. Journal of Natural Resources, 18(2): 189-196. (in Chinese)
|
|
|
| [45] |
Xie G D, Xiao Y. 2013. Review of agro-ecosystem services and their values. Chinese Journal of Eco-Agriculture, 21(6): 645-651. (in Chinese)
doi: 10.3724/SP.J.1011.2013.00645
|
|
|
| [46] |
Xie G D, Zhang C X, Zhang L M, et al. 2015. Improvement of the evaluation method for ecosystem service value based on per unit area. Journal of Natural Resources, 30(8): 1243-1254. (in Chinese)
|
|
|
| [47] |
Xie G D, Zhang C X, Zhen L, et al. 2017. Dynamic changes in the value of China's ecosystem services. Ecosystem Services, 26: 146-154.
doi: 10.1016/j.ecoser.2017.06.010
|
|
|
| [48] |
Xin Z H, Li C, Liu H X, et al. 2018. Evaluation of temporal and spatial ecosystem services in Dalian, China: Implications for urban planning. Sustainability, 10(4): 1247, doi: 10.3390/su10041247.
doi: 10.3390/su10041247
|
|
|
| [49] |
Xue M G, Xing L, Wang X Y. 2018. Spatial correction and evaluation of ecosystem services in China. China Land Science, 32(9): 81-88. (in Chinese)
|
|
|
| [50] |
Yang S T, Liu C M, Sun R. 2002. The vegetation cover over last 20 years in Yellow River Basin. Acta Geographica Sinica, 57(6): 679-684. (in Chinese)
|
|
|
| [51] |
Yu Y, Chen X, Huttner P, et al. 2018. Model based decision support system for land use changes and socio-economic assessments. Journal of Arid Land, 10(2): 169-182.
doi: 10.1007/s40333-018-0091-1
|
|
|
| [52] |
Zhang H, Sun J, Deng W, et al. 2020. Ecosystem health: Assessment framework, spatial evolution, and regional optimization in Southwest China. Chinese Geographical Science, 30(1): 142-156.
doi: 10.1007/s11769-020-1101-8
|
|
|
|
Viewed |
|
|
|
Full text
|
|
|
|
|
Abstract
|
|
|
|
|
Cited |
|
|
|
|
| |
Shared |
|
|
|
|
| |
Discussed |
|
|
|
|