| Research article |
|

|
|
|
| Dividing the transit wind speeds into intervals as a favorable methodology for analyzing the relationship between wind speed and the aerodynamic impedance of vegetation in semiarid grasslands |
LI Ruishen1, PEI Haifeng1, ZHANG Shengwei1,2,3,*( ), LI Fengming4, LIN Xi1, WANG Shuai1, YANG Lin1 ), LI Fengming4, LIN Xi1, WANG Shuai1, YANG Lin1 |
1College of Water Conservancy and Civil Engineering, Inner Mongolia Agricultural University, Hohhot 010018, China
2Key Laboratory of Water Resources Protection and Utilization of Inner Mongolia Autonomous Region, Hohhot 010018, China
3Autonomous Region Collaborative Innovation Center for Integrated Management of Water Resources and Water Environment in the Inner Mongolia Reaches of the Yellow River, Hohhot 010018, China
4Inner Mongolia Autonomous Region Management Center of Sanshenggong Hydro-junction in the Yellow River, Bayannur 015200, China |
|
|
|
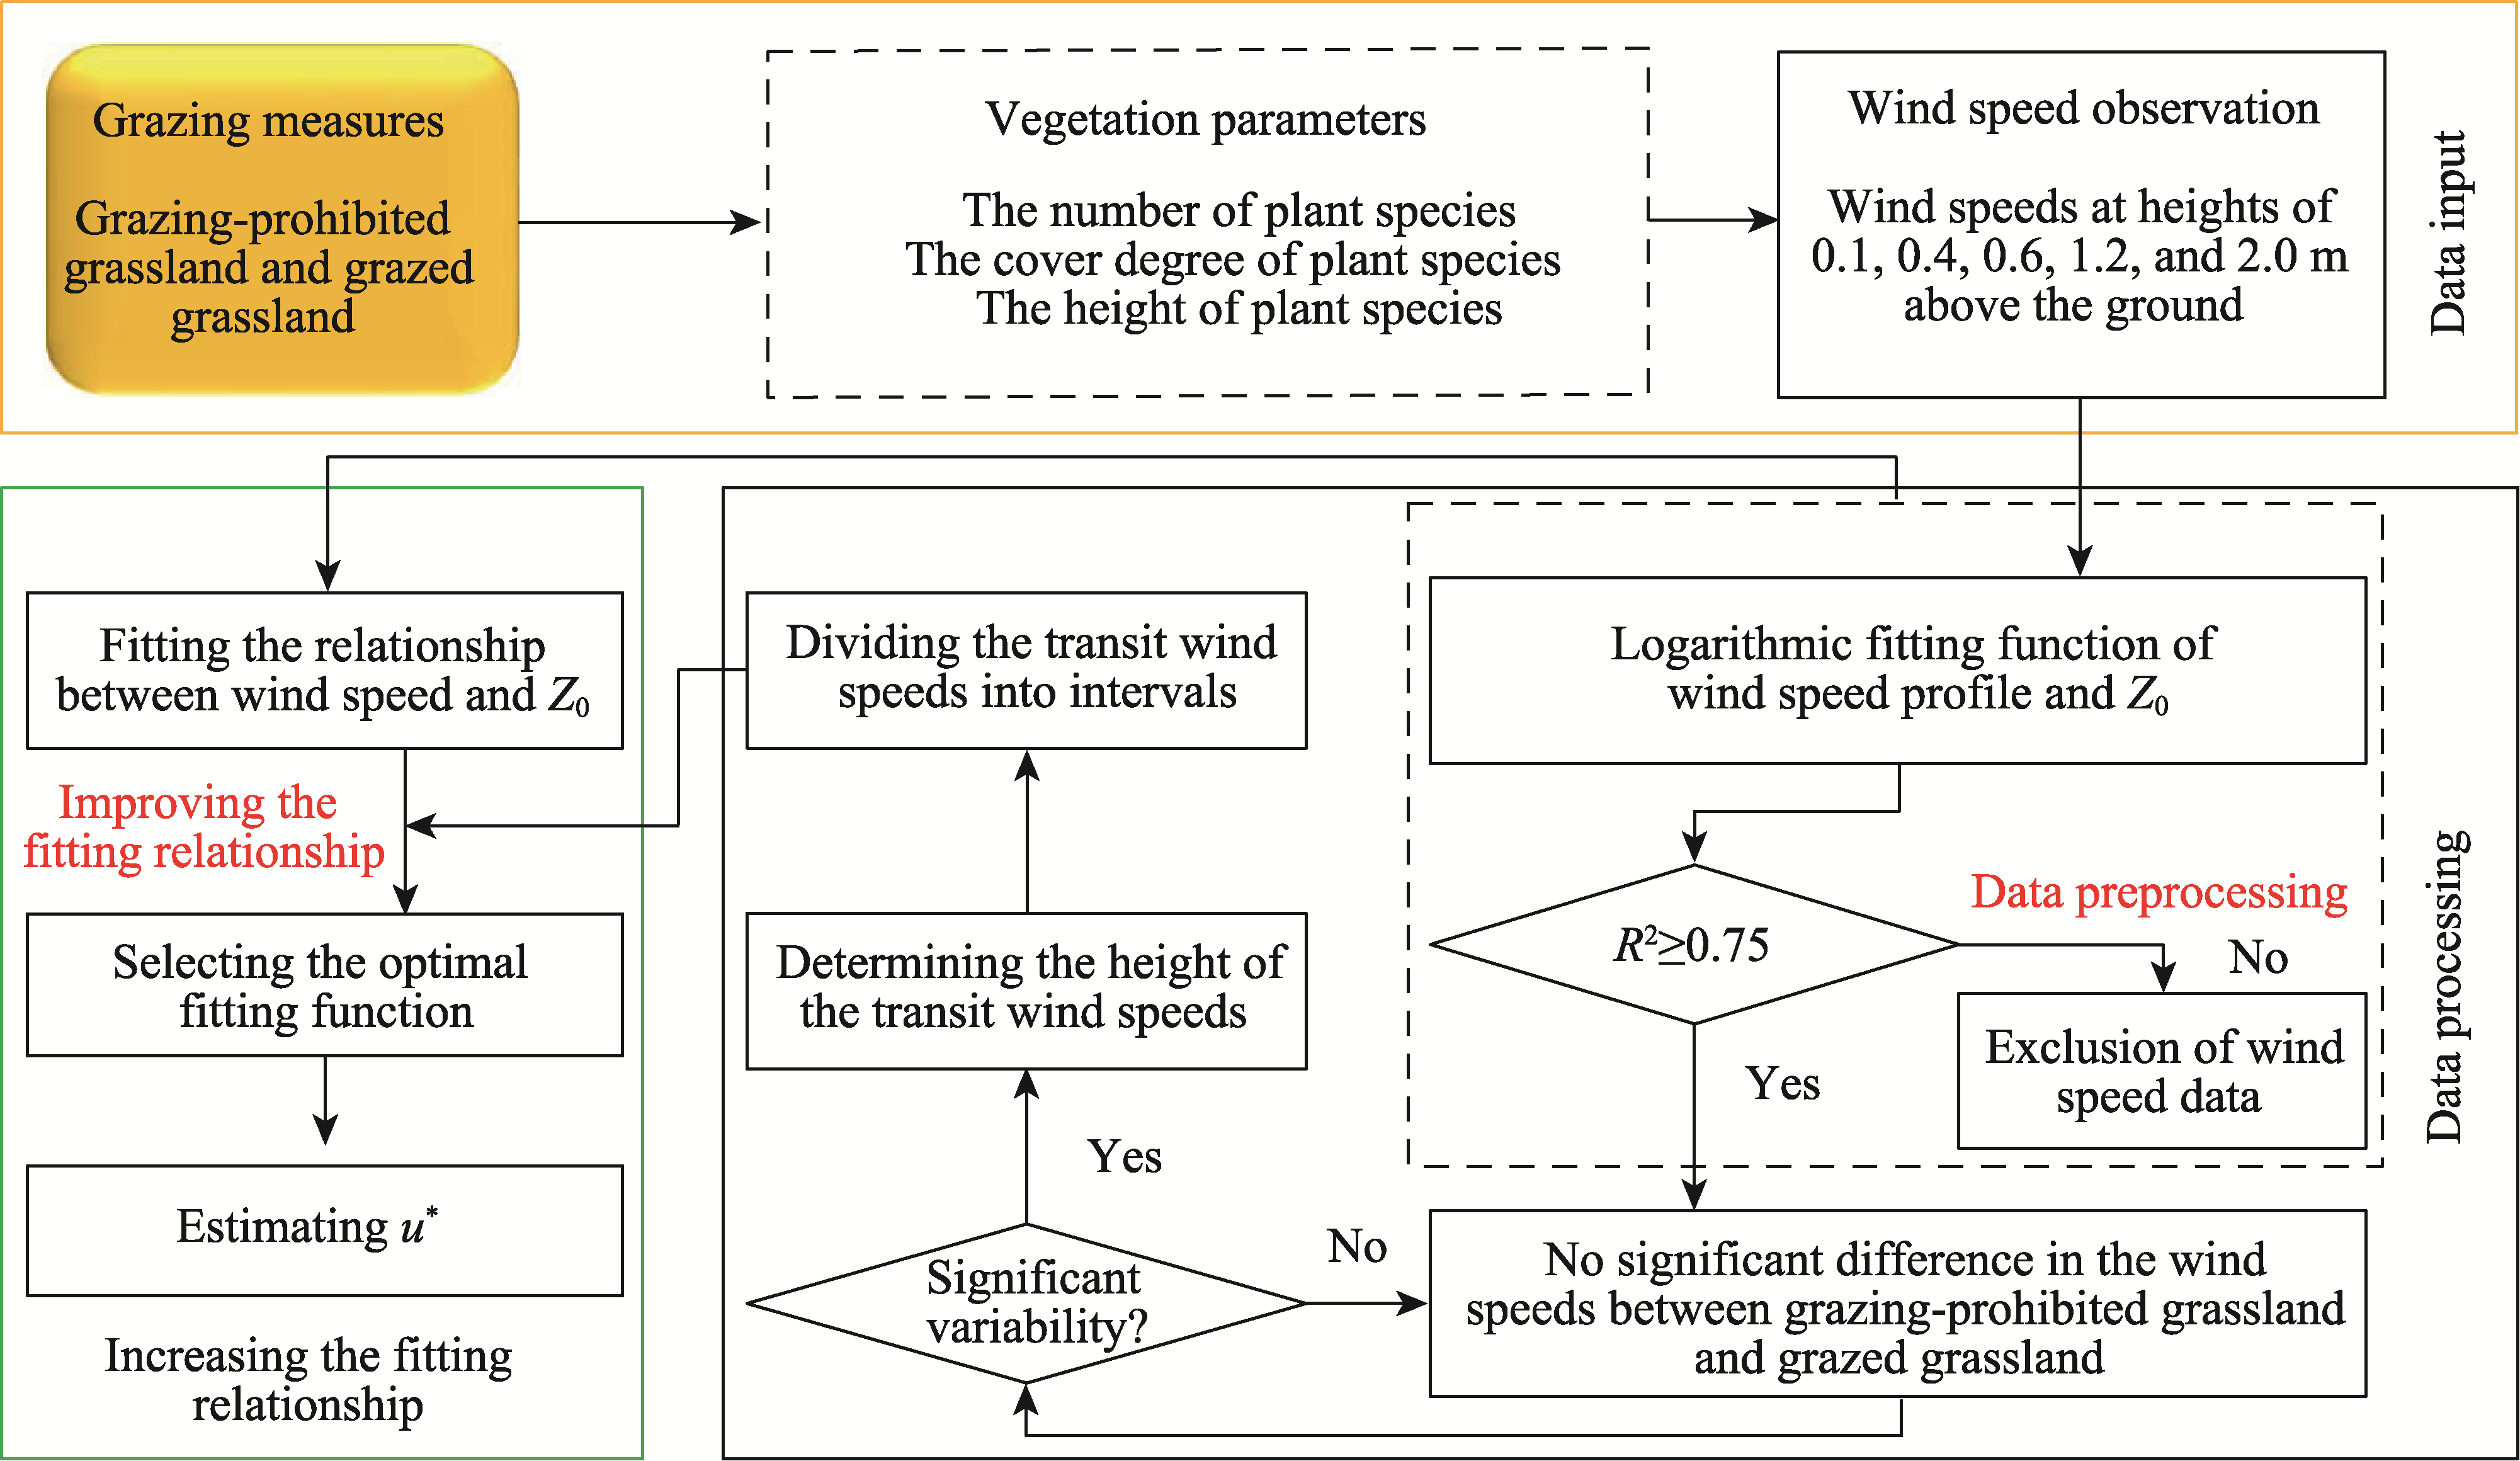
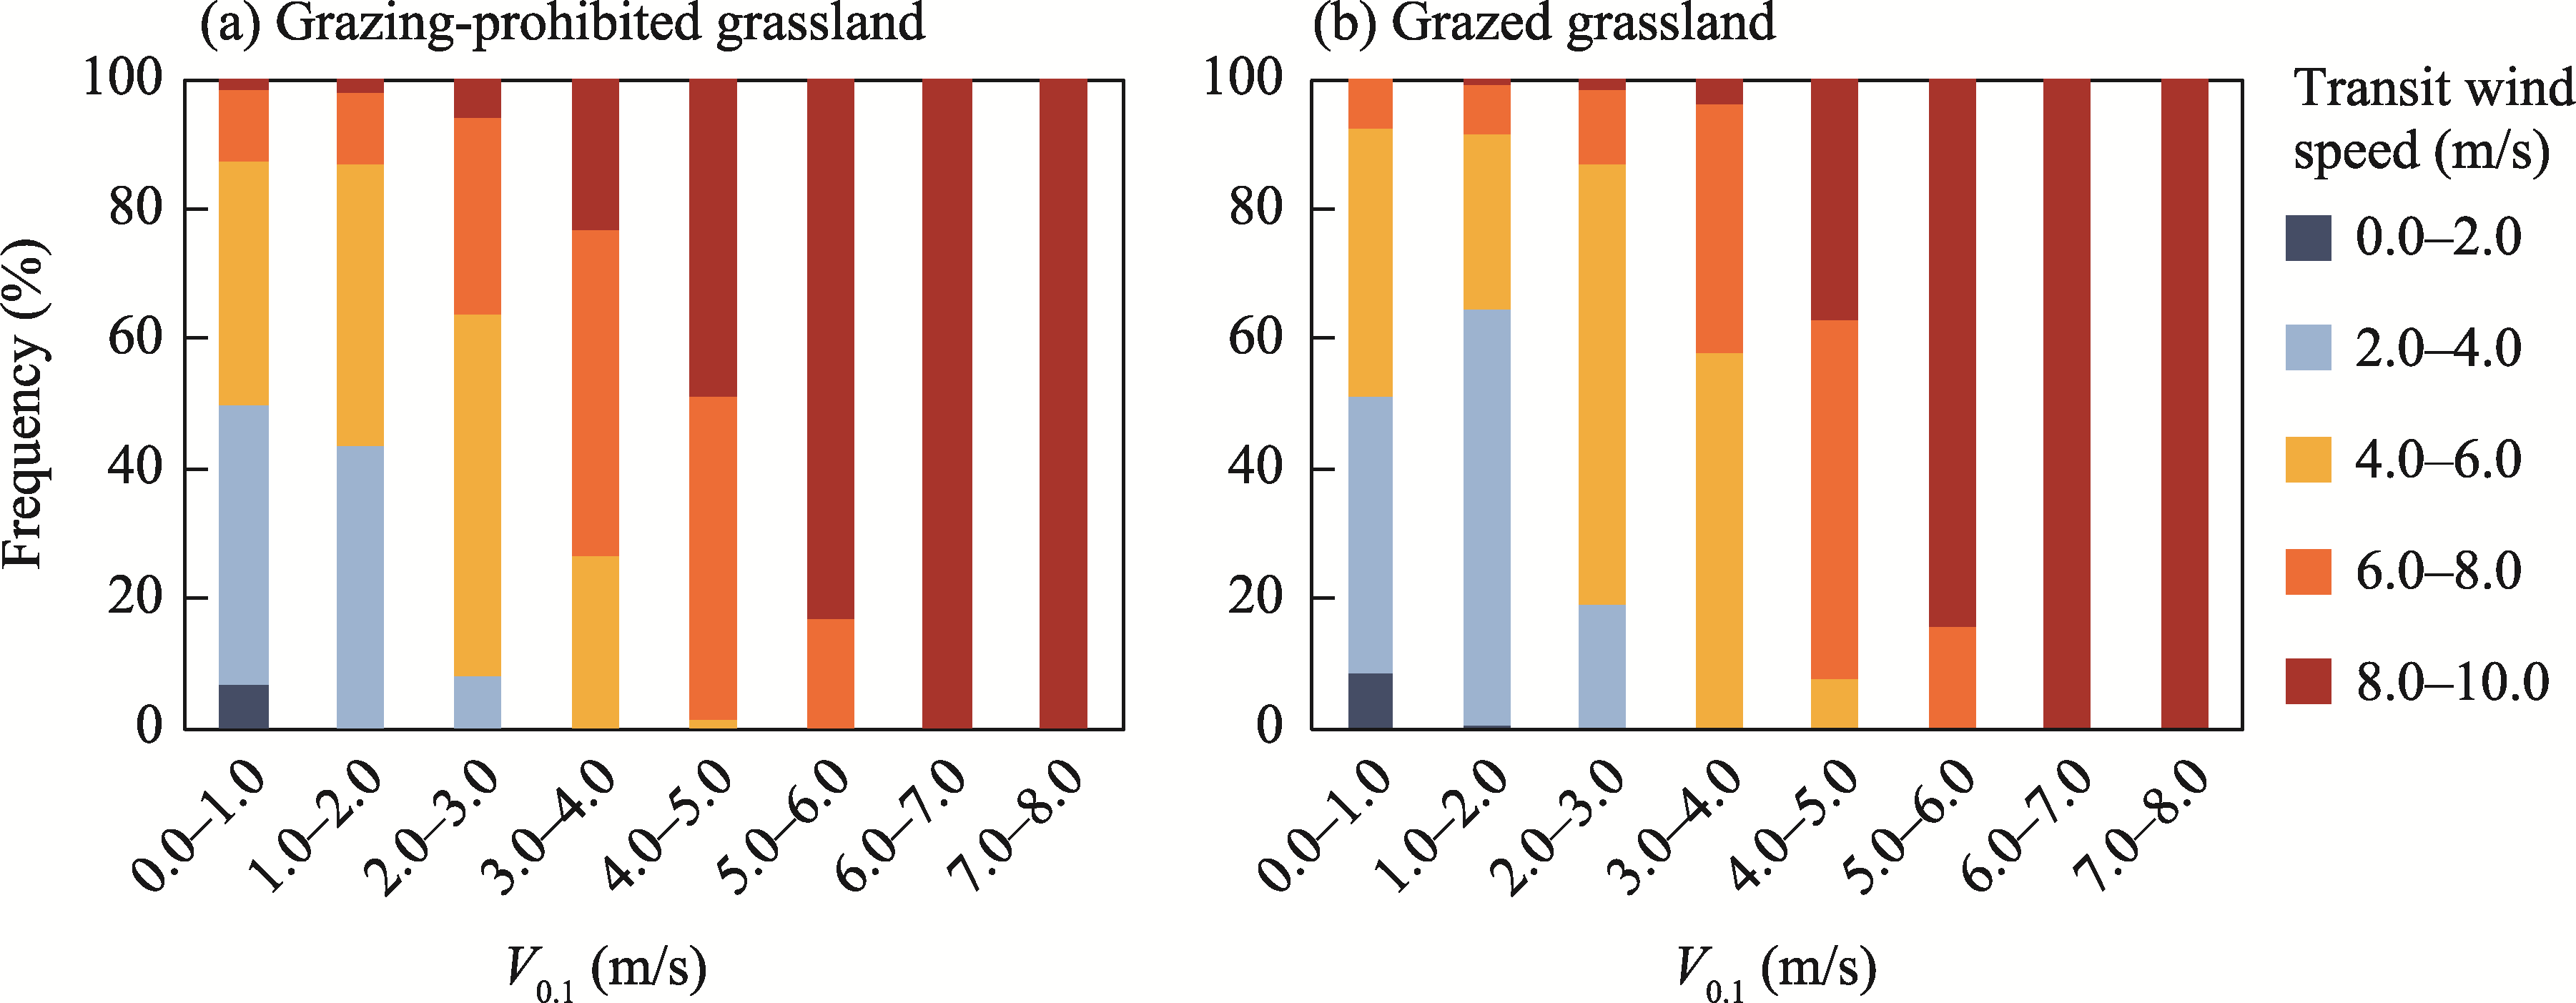
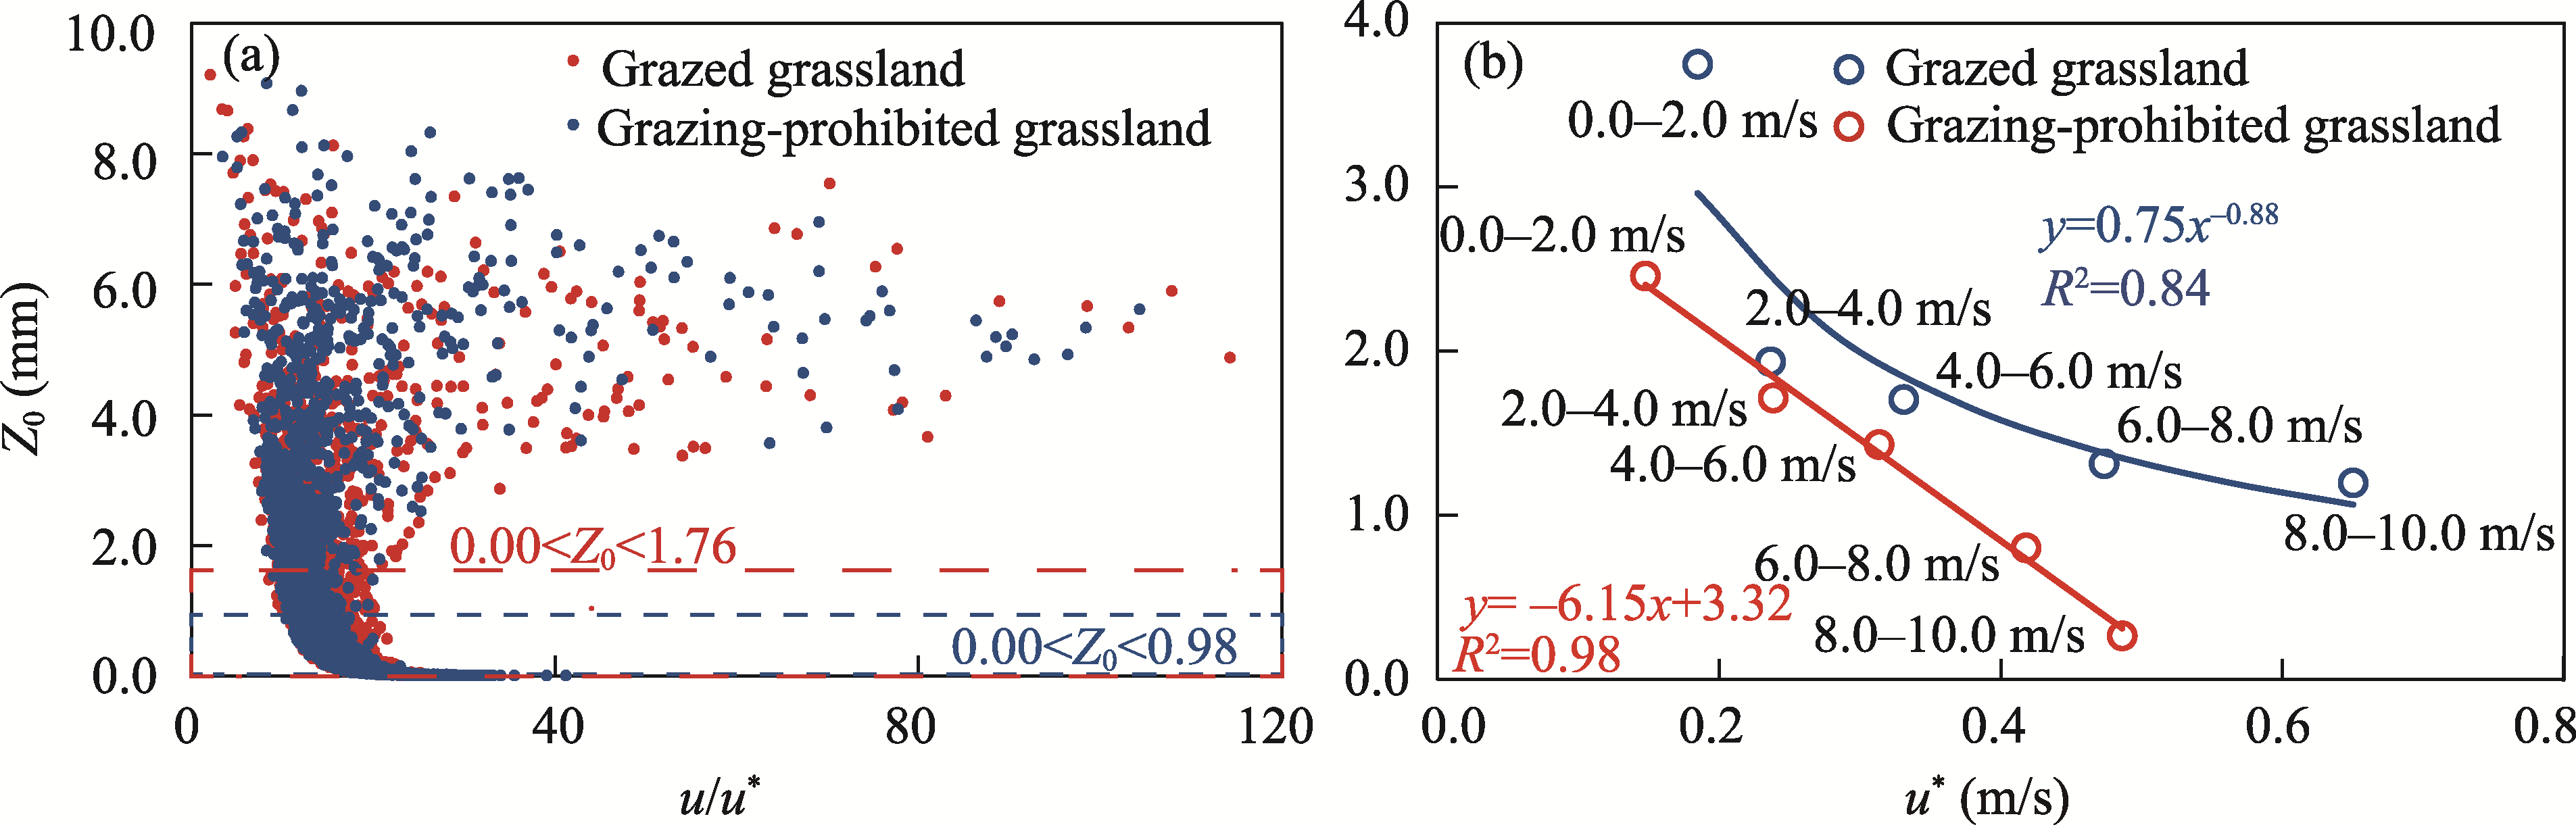
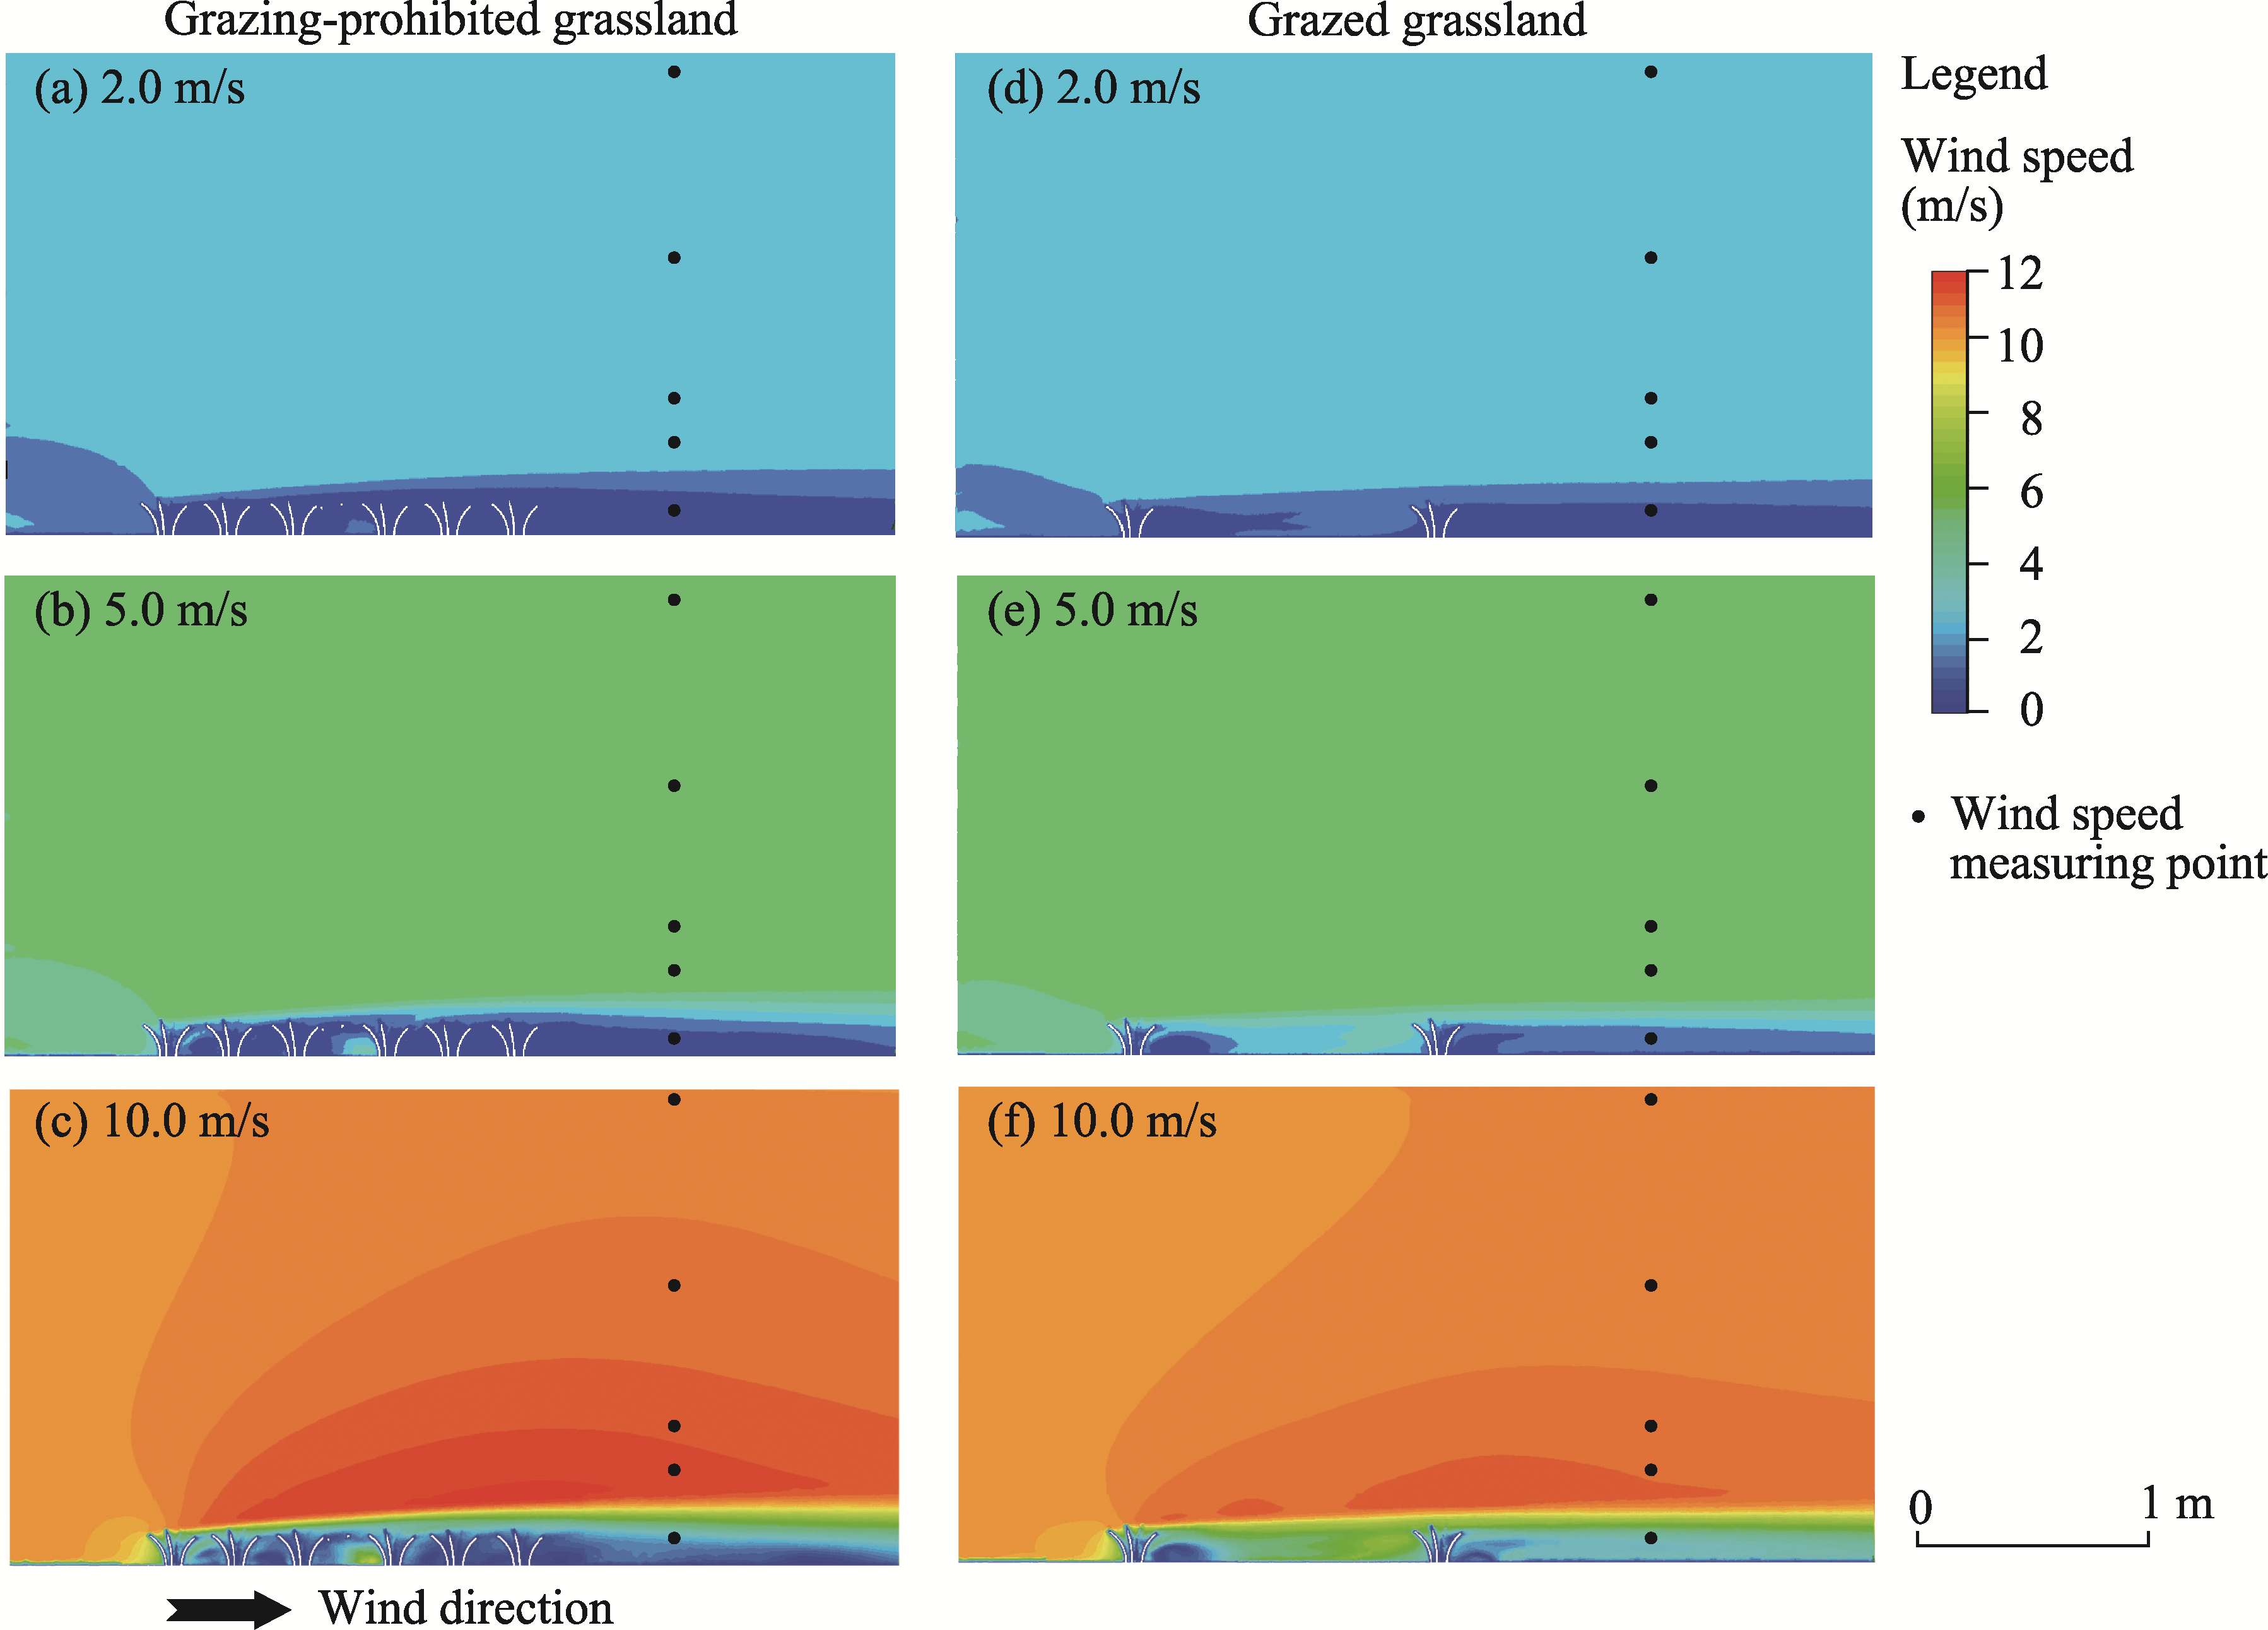
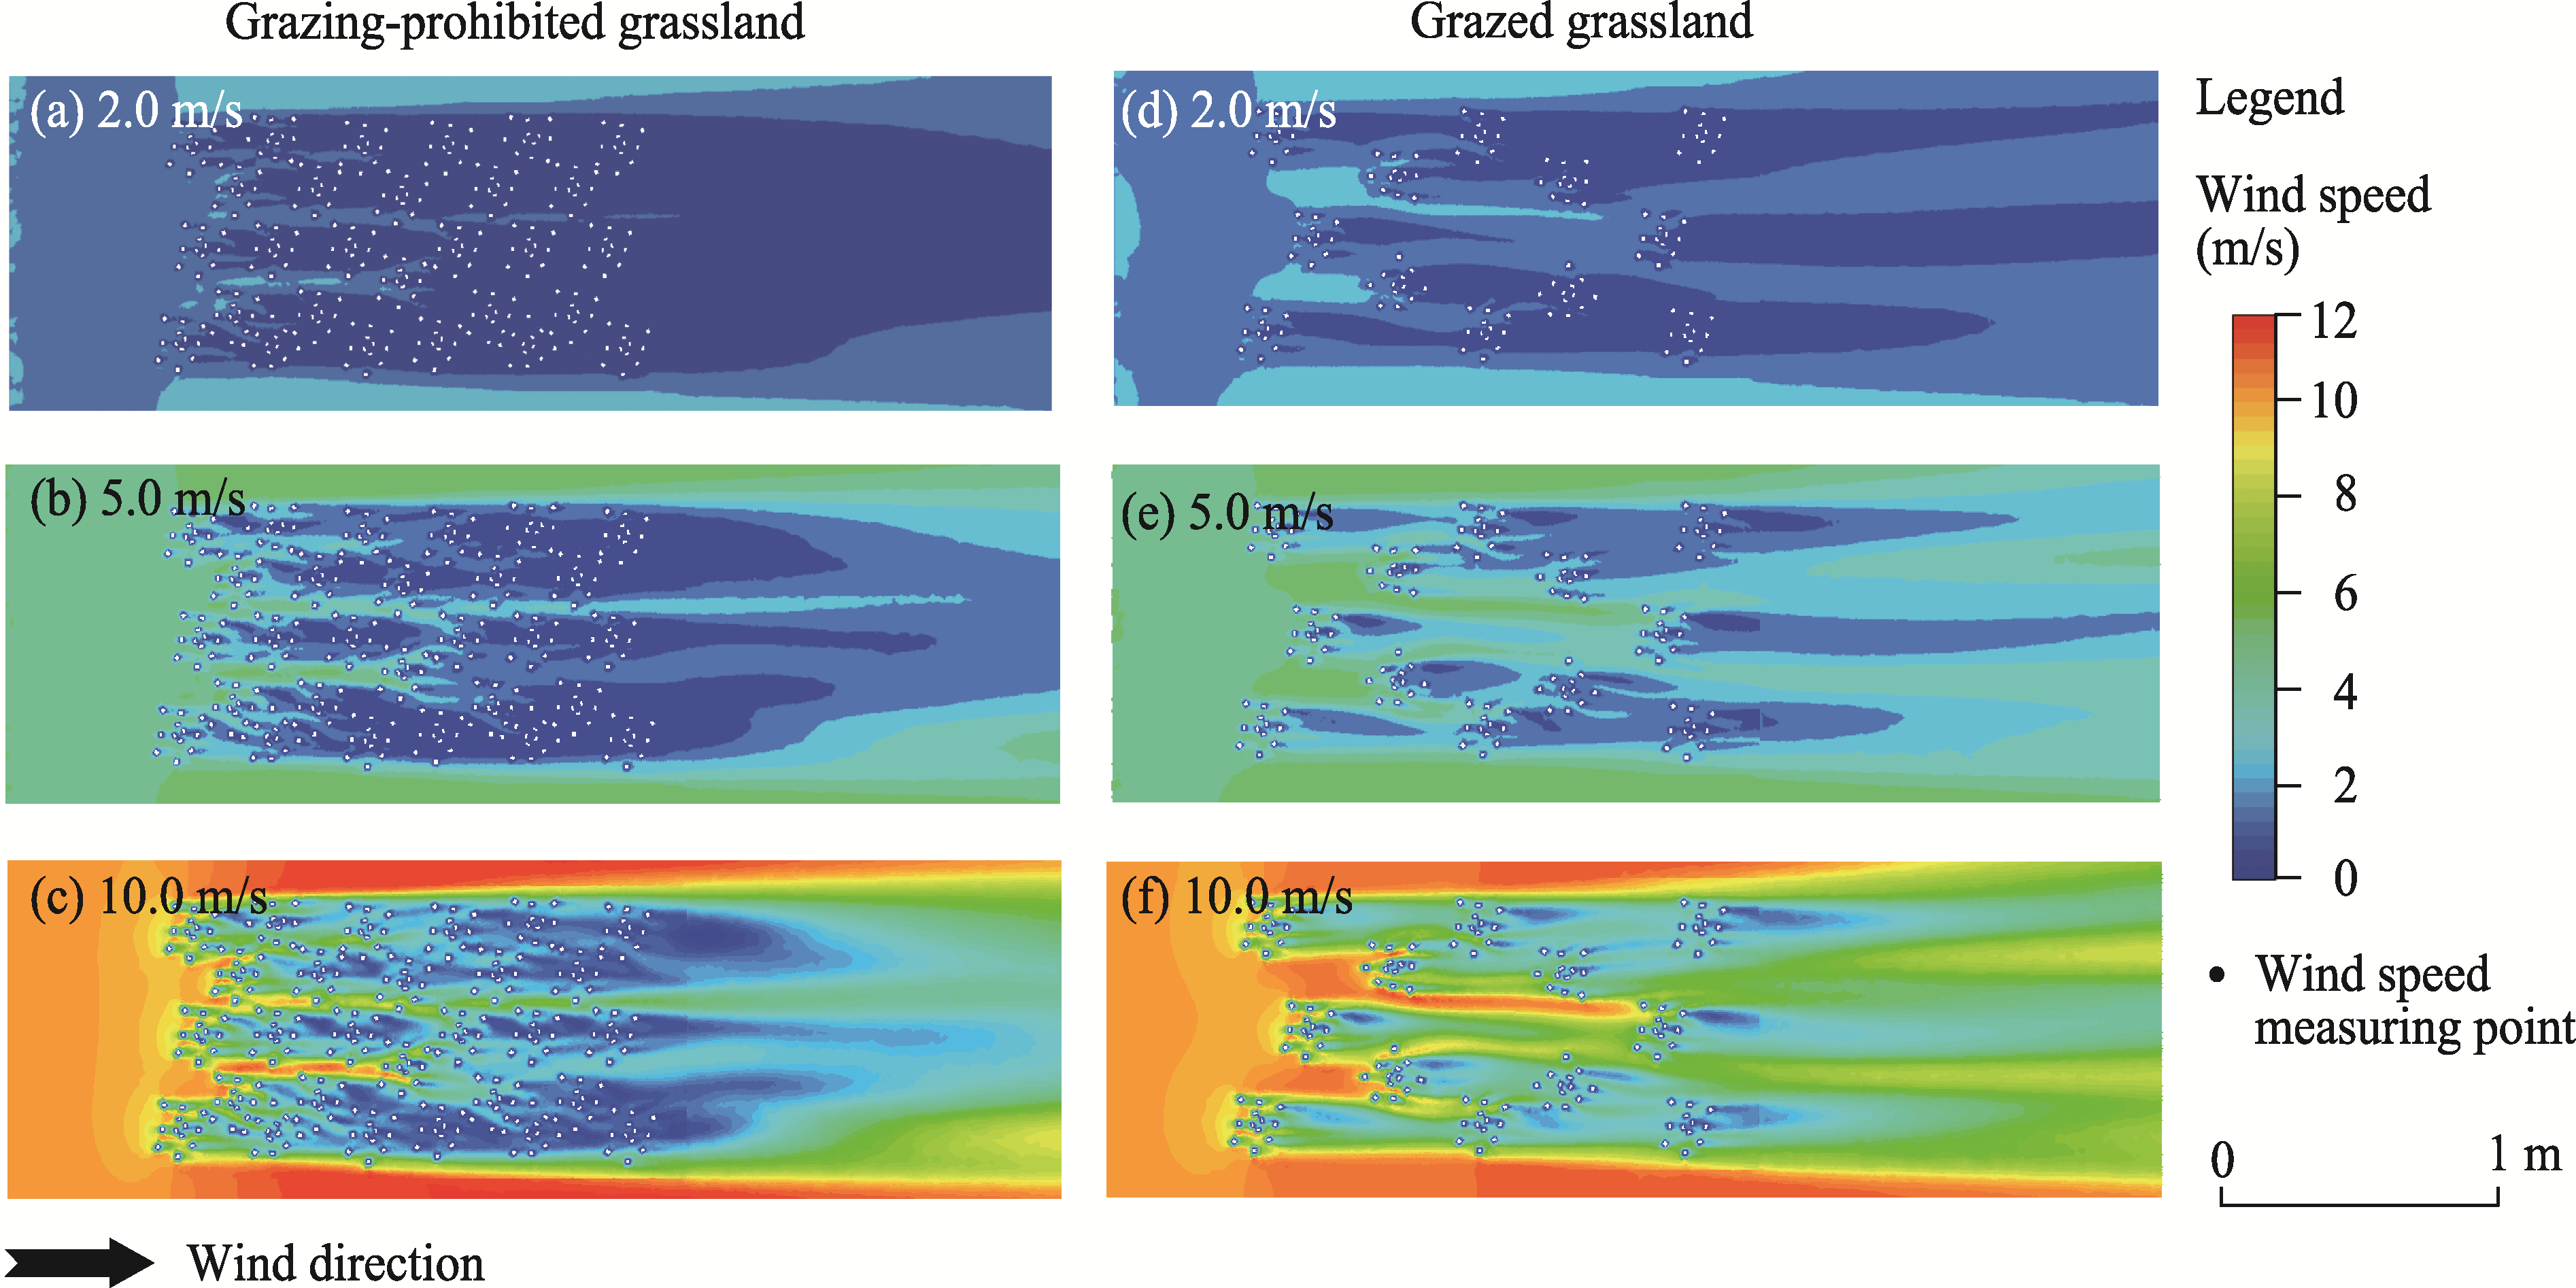
Abstract In grassland ecosystems, the aerodynamic roughness (Z0) and frictional wind speed (u*) contribute to the aerodynamic impedance of the grassland canopy. Thus, they are often used in the studies of wind erosion and evapotranspiration. However, the effect of wind speed and grazing measures on the aerodynamic impedance of the grassland canopy has received less analysis. In this study, we monitored wind speeds at multiple heights in grazed and grazing-prohibited grasslands for 1 month in 2021, determined the transit wind speed at 2.0 m height by comparing wind speed differences at the same height in both grasslands, and divided these transit wind speeds at intervals of 2.0 m/s to analyze the effect of the transit wind speed on the relationship among Z0, u*, and wind speed within the grassland canopy. The results showed that dividing the transit wind speeds into intervals has a positive effect on the logarithmic fit of the wind speed profile. After dividing the transit wind speeds into intervals, the wind speed at 0.1 m height (V0.1) gradually decreased with the increase of Z0, exhibiting three distinct stages: a sharp change zone, a steady change zone, and a flat zone; while the overall trend of u* increased first and then decreased with the increase of V0.1. Dividing the transit wind speeds into intervals improved the fitting relationship between Z0 and V0.1 and changed their fitting functions in grazed and grazing-prohibited grasslands. According to the computational fluid dynamic results, we found that the number of tall-stature plants has a more significant effect on windproof capacity than their height. The results of this study contribute to a better understanding of the relationship between wind speed and the aerodynamic impedance of vegetation in grassland environments.
|
|
Received: 08 October 2022
Published: 31 August 2023
|
|
Corresponding Authors:
* ZHANG Shengwei (E-mail: zsw@imau.edu.cn)
|
| Cite this article:
LI Ruishen, PEI Haifeng, ZHANG Shengwei, LI Fengming, LIN Xi, WANG Shuai, YANG Lin. Dividing the transit wind speeds into intervals as a favorable methodology for analyzing the relationship between wind speed and the aerodynamic impedance of vegetation in semiarid grasslands. Journal of Arid Land, 2023, 15(8): 887-900.
URL:
http://jal.xjegi.com/10.1007/s40333-023-0102-8 OR http://jal.xjegi.com/Y2023/V15/I8/887
|
|
|
| [1] |
Alberton B, Torres R d S, Cancian L F, et al. 2017. Introducing digital cameras to monitor plant phenology in the tropics: applications for conservation. Perspectives in Ecology and Conservation, 15(2): 82-90.
doi: 10.1016/j.pecon.2017.06.004
|
|
|
| [2] |
Bañuelos-Ruedas F, Angeles-Camacho C, Rios-Marcuello S. 2010. Analysis and validation of the methodology used in the extrapolation of wind speed data at different heights. Renewable and Sustainable Energy Reviews, 14(8): 2383-2391.
doi: 10.1016/j.rser.2010.05.001
|
|
|
| [3] |
Barnéoud P, Ek N. 2019. On the Application of linear regression to surface-layer wind profiles for deducing roughness length and friction velocity. Boundary-Layer Meteorology, 174(2): 327-339.
doi: 10.1007/s10546-019-00479-8
|
|
|
| [4] |
de Souza C M, Dias-Júnior C Q, Tóta J, et al. 2016. An empirical-analytical model of the vertical wind speed profile above and within an Amazon forest site. Meteorological Applications, 23(1): 158-164.
doi: 10.1002/met.1543
|
|
|
| [5] |
Dong Z B, Gao S Y, Fryreart D W. 2001. Drag coefficients, roughness length and zero-plane displacement height as disturbed by artificial standing vegetation. Journal of Arid Environments, 49(3): 485-505.
doi: 10.1006/jare.2001.0807
|
|
|
| [6] |
Du H Q, Wang T, Xue X. 2017. Field determination for roughness length above the different non-erodible surfaces. Sciences in Cold and Arid Regions, 9(1): 67-77.
|
|
|
| [7] |
Fu L T, Fan Q, Huang Z L. 2019. Wind speed acceleration around a single low solid roughness in atmospheric boundary layer. Scientific Reports, 9(1): 12002, doi: 10.1038/s41598-019-48574-7.
doi: 10.1038/s41598-019-48574-7
|
|
|
| [8] |
Gonzales H B, Ravi S, Li J R, et al. 2018. Ecohydrological implications of aeolian sediment trapping by sparse vegetation in drylands. Ecohydrology, 11(7): e1986, doi: 10.1002/eco.1986.
doi: 10.1002/eco.1986
|
|
|
| [9] |
Haghighi E, Or D. 2015. Interactions of bluff-body obstacles with turbulent airflows affecting evaporative fluxes from porous surfaces. Journal of Hydrology, 530: 103-116.
doi: 10.1016/j.jhydrol.2015.09.048
|
|
|
| [10] |
Jäschke Y, Heberling G, Wesche K. 2020. Environmental controls override grazing effects on plant functional traits in Tibetan rangelands. Functional Ecology, 34(3): 747-760.
doi: 10.1111/fec.v34.3
|
|
|
| [11] |
Kang L Q, Zhang J J, Zou X Y, et al. 2019. Experimental investigation of the aerodynamic roughness length for flexible plants. Boundary-Layer Meteorology, 172(3): 397-416.
doi: 10.1007/s10546-019-00449-0
|
|
|
| [12] |
Kinugasa T, Sagayama T, Gantsetseg B, et al. 2021. Effect of simulated grazing on sediment trapping by single plants: A wind-tunnel experiment with two grassland species in Mongolia. CATENA, 202: 105262, doi: 10.1016/j.catena.2021.105262.
doi: 10.1016/j.catena.2021.105262
|
|
|
| [13] |
Levin N, Ben-Dor E, Kidron G J, et al. 2008. Estimation of surface roughness (z0) over a stabilizing coastal dune field based on vegetation and topography. Earth Surface Processes and Landforms, 33(10): 1520-1541.
doi: 10.1002/esp.v33:10
|
|
|
| [14] |
Li X, Feng G, Sharratt B, et al. 2015. Aerodynamic properties of agricultural and natural surfaces in northwestern Tarim Basin. Agricultural and Forest Meteorology, 204: 37-45.
doi: 10.1016/j.agrformet.2015.01.005
|
|
|
| [15] |
Liu J Q, Kimura R, Miyawaki M, et al. 2021. Effects of plants with different shapes and coverage on the blown-sand flux and roughness length examined by wind tunnel experiments. CATENA, 197: 104976, doi: 10.1016/j.catena.2020.104976.
doi: 10.1016/j.catena.2020.104976
|
|
|
| [16] |
Liu X Y, Zhang C L, Zhang H, et al. 2022. Characteristics of wind velocity pulsation and its relation to average wind velocity and friction wind velocity. Bulletin of Soil and Water Conservation, 40(5): 60-63, 78. (in Chinese)
|
|
|
| [17] |
Luo Q, Zhen L, Xiao Y, et al. 2020. The effects of different types of vegetation restoration on wind erosion prevention: A case study in Yanchi. Environmental Research Letters, 15(11): 115001, doi: 10.1088/1748-9326/abbaff.
doi: 10.1088/1748-9326/abbaff
|
|
|
| [18] |
Miri A, Dragovich D, Dong Z B. 2017. Vegetation morphologic and aerodynamic characteristics reduce aeolian erosion. Scientific Reports, 7: 12831, doi: 10.1038/s41598-017-13084-x.
doi: 10.1038/s41598-017-13084-x
|
|
|
| [19] |
Onoda Y, Westoby M, Adler P B, et al. 2011. Global patterns of leaf mechanical properties. Ecology Letters, 14(3): 301-312.
doi: 10.1111/j.1461-0248.2010.01582.x
pmid: 21265976
|
|
|
| [20] |
Pi H, Huggins D R, Sharratt B. 2020. Threshold friction velocities influenced by standing crop residue in the inland Pacific Northwest, USA. Land Degradation and Development, 31(16): 2356-2368.
doi: 10.1002/ldr.v31.16
|
|
|
| [21] |
Rauber L R, Sequinatto L, Kaiser D R, et al. 2021. Soil physical properties in a natural highland grassland in southern Brazil subjected to a range of grazing heights. Agriculture, Ecosystems and Environment, 319: 107515, doi: 10.1016/j.agee.2021.107515.
doi: 10.1016/j.agee.2021.107515
|
|
|
| [22] |
Stanhill G. 1969. A simple instrument for the field measurement of turbulent diffusion flux. Journal of Applied Meteorology and Climatology, 8(4): 509-513.
|
|
|
| [23] |
Stull R B. 1988. An Introduction to Boundary Layer Meteorology. New York: Springer Science and Business Media.
|
|
|
| [24] |
Török P, Penksza K, Tóth E, et al. 2018. Vegetation type and grazing intensity jointly shape grazing effects on grassland biodiversity. Ecology and Evolution, 8(20): 10326-10335.
doi: 10.1002/ece3.4508
pmid: 30397469
|
|
|
| [25] |
Walter B, Gromke C, Leonard K C, et al. 2012. Spatio-temporal surface shear-stress variability in live plant canopies and cube arrays. Boundary-Layer Meteorology, 143(2): 337-356.
doi: 10.1007/s10546-011-9690-5
|
|
|
| [26] |
Xin G W, Huang N, Zhang J, et al. 2021. Investigations into the design of sand control fence for Gobi buildings. Aeolian Research, 49: 100662, doi: 10.1016/j.aeolia.2020.100662.
doi: 10.1016/j.aeolia.2020.100662
|
|
|
| [27] |
Xiong P F, Chen Z F, Zhou J J, et al. 2021. Aboveground biomass production and dominant species type determined canopy storage capacity of abandoned grassland communities on semiarid Loess Plateau. Ecohydrology, 14(2): e2265, doi: 10.1002/eco.2265.
doi: 10.1002/eco.2265
|
|
|
| [28] |
Yan R R, Xin X P, Yan Y C, et al. 2015. Impacts of differing grazing rates on canopy structure and species composition in Hulunber meadow steppe. Rangeland Ecology and Management, 68(1): 54-64.
doi: 10.1016/j.rama.2014.12.001
|
|
|
| [29] |
Yu M Z, Wu B F, Zeng H W, et al. 2018. The impacts of vegetation and meteorological factors on aerodynamic roughness length at different time scales. Atmosphere, 9(4): 149, doi: 10.3390/atmos9040149.
doi: 10.3390/atmos9040149
|
|
|
| [30] |
Zanella P G, Junior L H P D G, Pinto C E, et al. 2021. Grazing intensity drives plant diversity but does not affect forage production in a natural grassland dominated by the tussock-forming grass Andropogon lateralis Nees. Scientific Reports, 11(1): 16744, doi: 10.1038/s41598-021-96208-8.
doi: 10.1038/s41598-021-96208-8
|
|
|
| [31] |
Zhang Q, Zeng J, Yao T. 2012. Interaction of aerodynamic roughness length and windflow conditions and its parameterization over vegetation surface. Chinese Science Bulletin, 57(13): 1559-1567.
doi: 10.1007/s11434-012-5000-y
|
|
|
| [32] |
Zhang W, Wu J J, Jiang A. 2022. Numerical study on aerodynamic roughness of forest. Earth Science Informatics, 15(1): 465-472.
doi: 10.1007/s12145-021-00735-x
|
|
|
| [33] |
Zheng M M, Song J, Ru J Y, et al. 2020. Effects of grazing, wind erosion, and dust deposition on plant community composition and structure in a temperate steppe. Ecosystems, 24(2): 403-420.
doi: 10.1007/s10021-020-00526-3
|
|
|
|
Viewed |
|
|
|
Full text
|
|
|
|
|
Abstract
|
|
|
|
|
Cited |
|
|
|
|
| |
Shared |
|
|
|
|
| |
Discussed |
|
|
|
|