| Research article |
|


|
|
|
| Three-dimensional (3D) parametric measurements of individual gravels in the Gobi region using point cloud technique |
JING Xiangyu1,2, HUANG Weiyi1,2, KAN Jiangming1,2,*( ) ) |
1College of Engineering, Beijing Forestry University, Beijing 100083, China
2Key Laboratory of State Forestry Administration on Forestry Equipment and Automation, Beijing 100083, China |
|
|
|
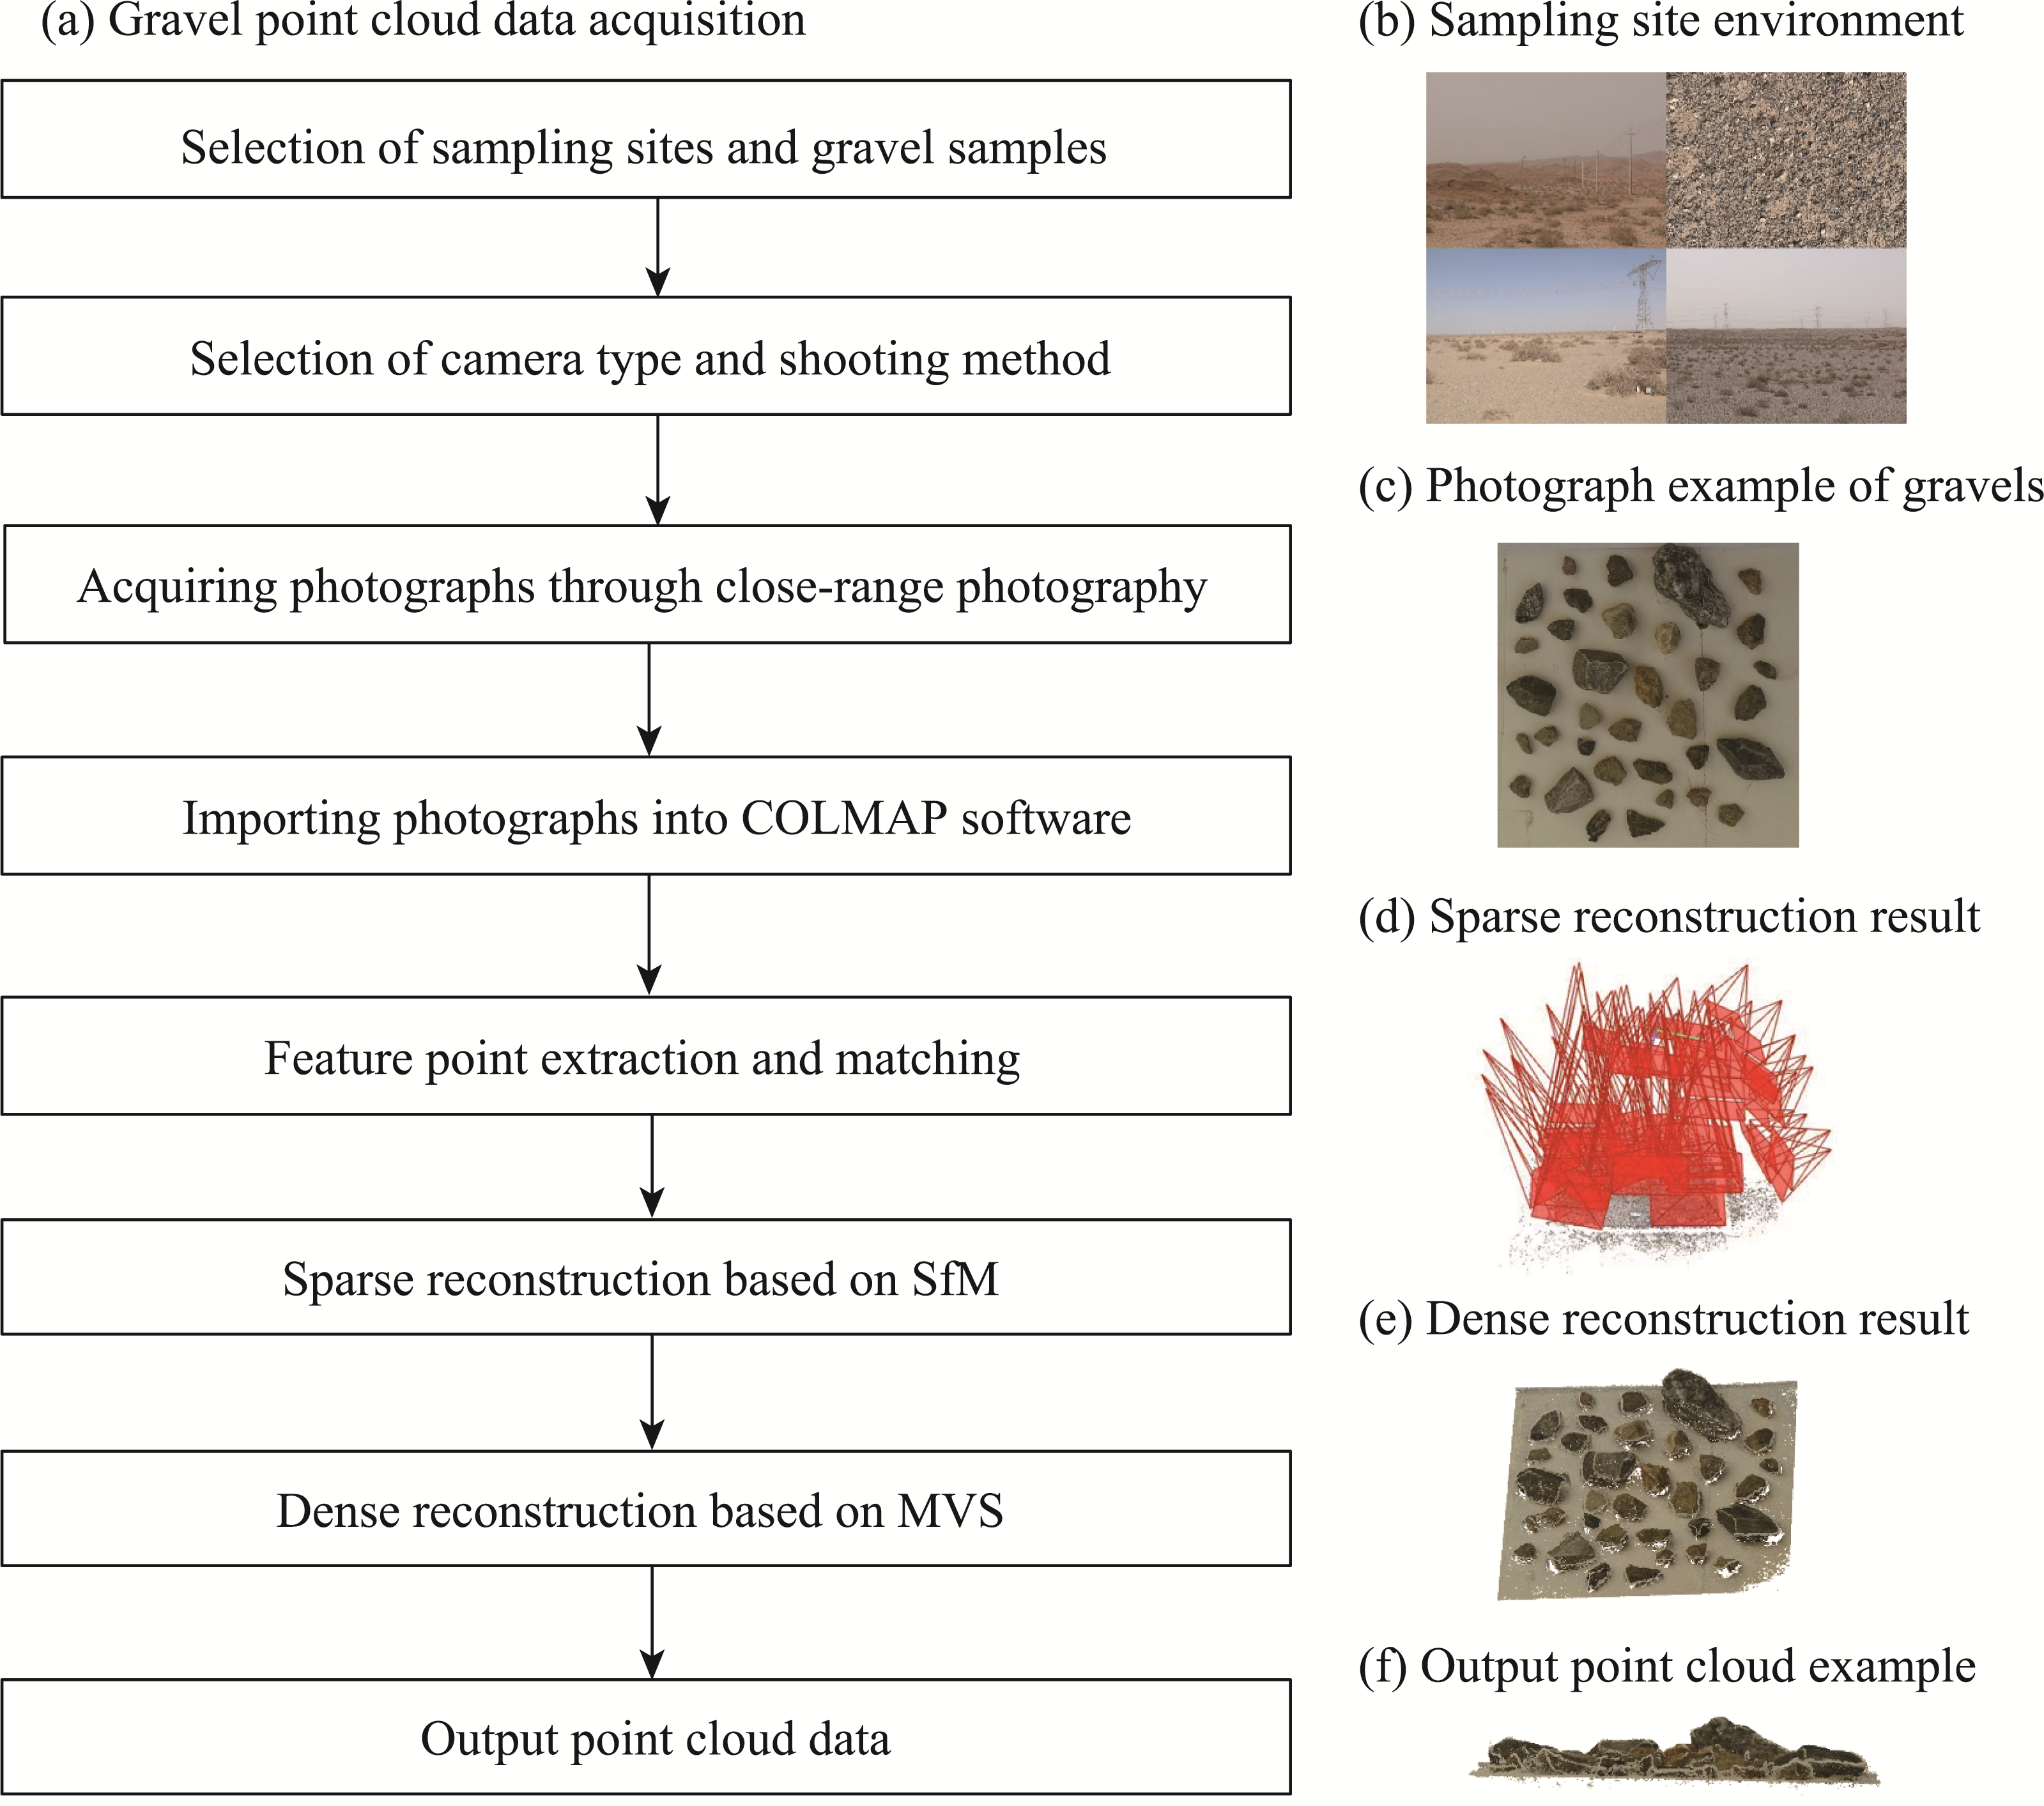
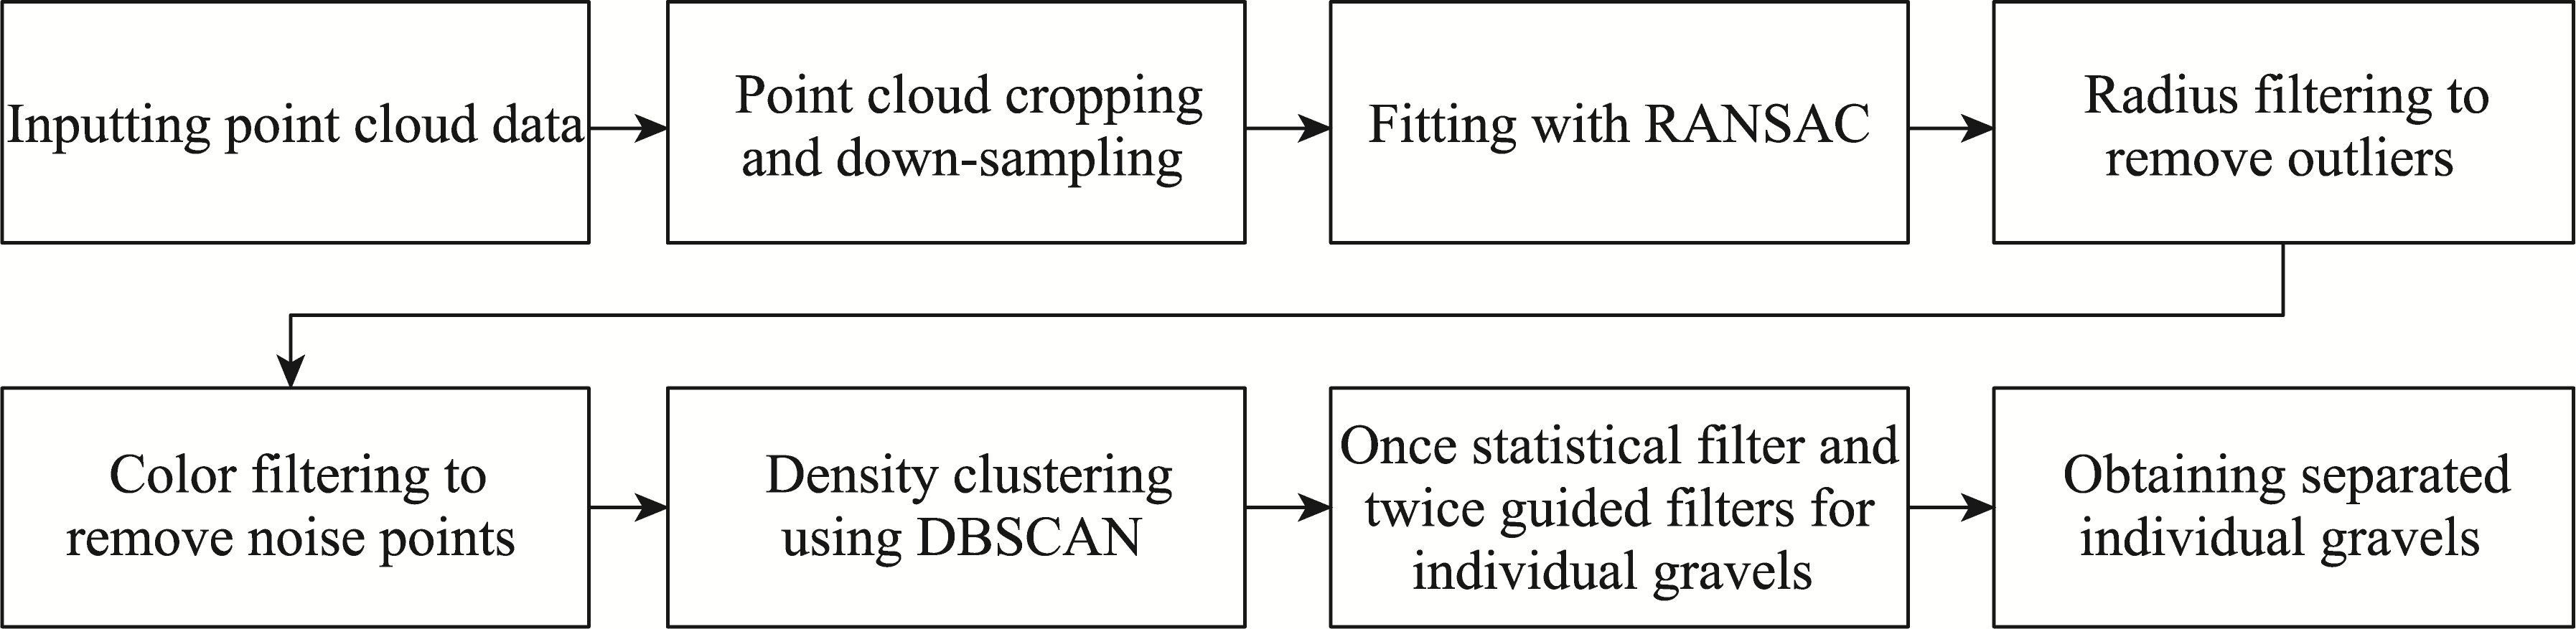
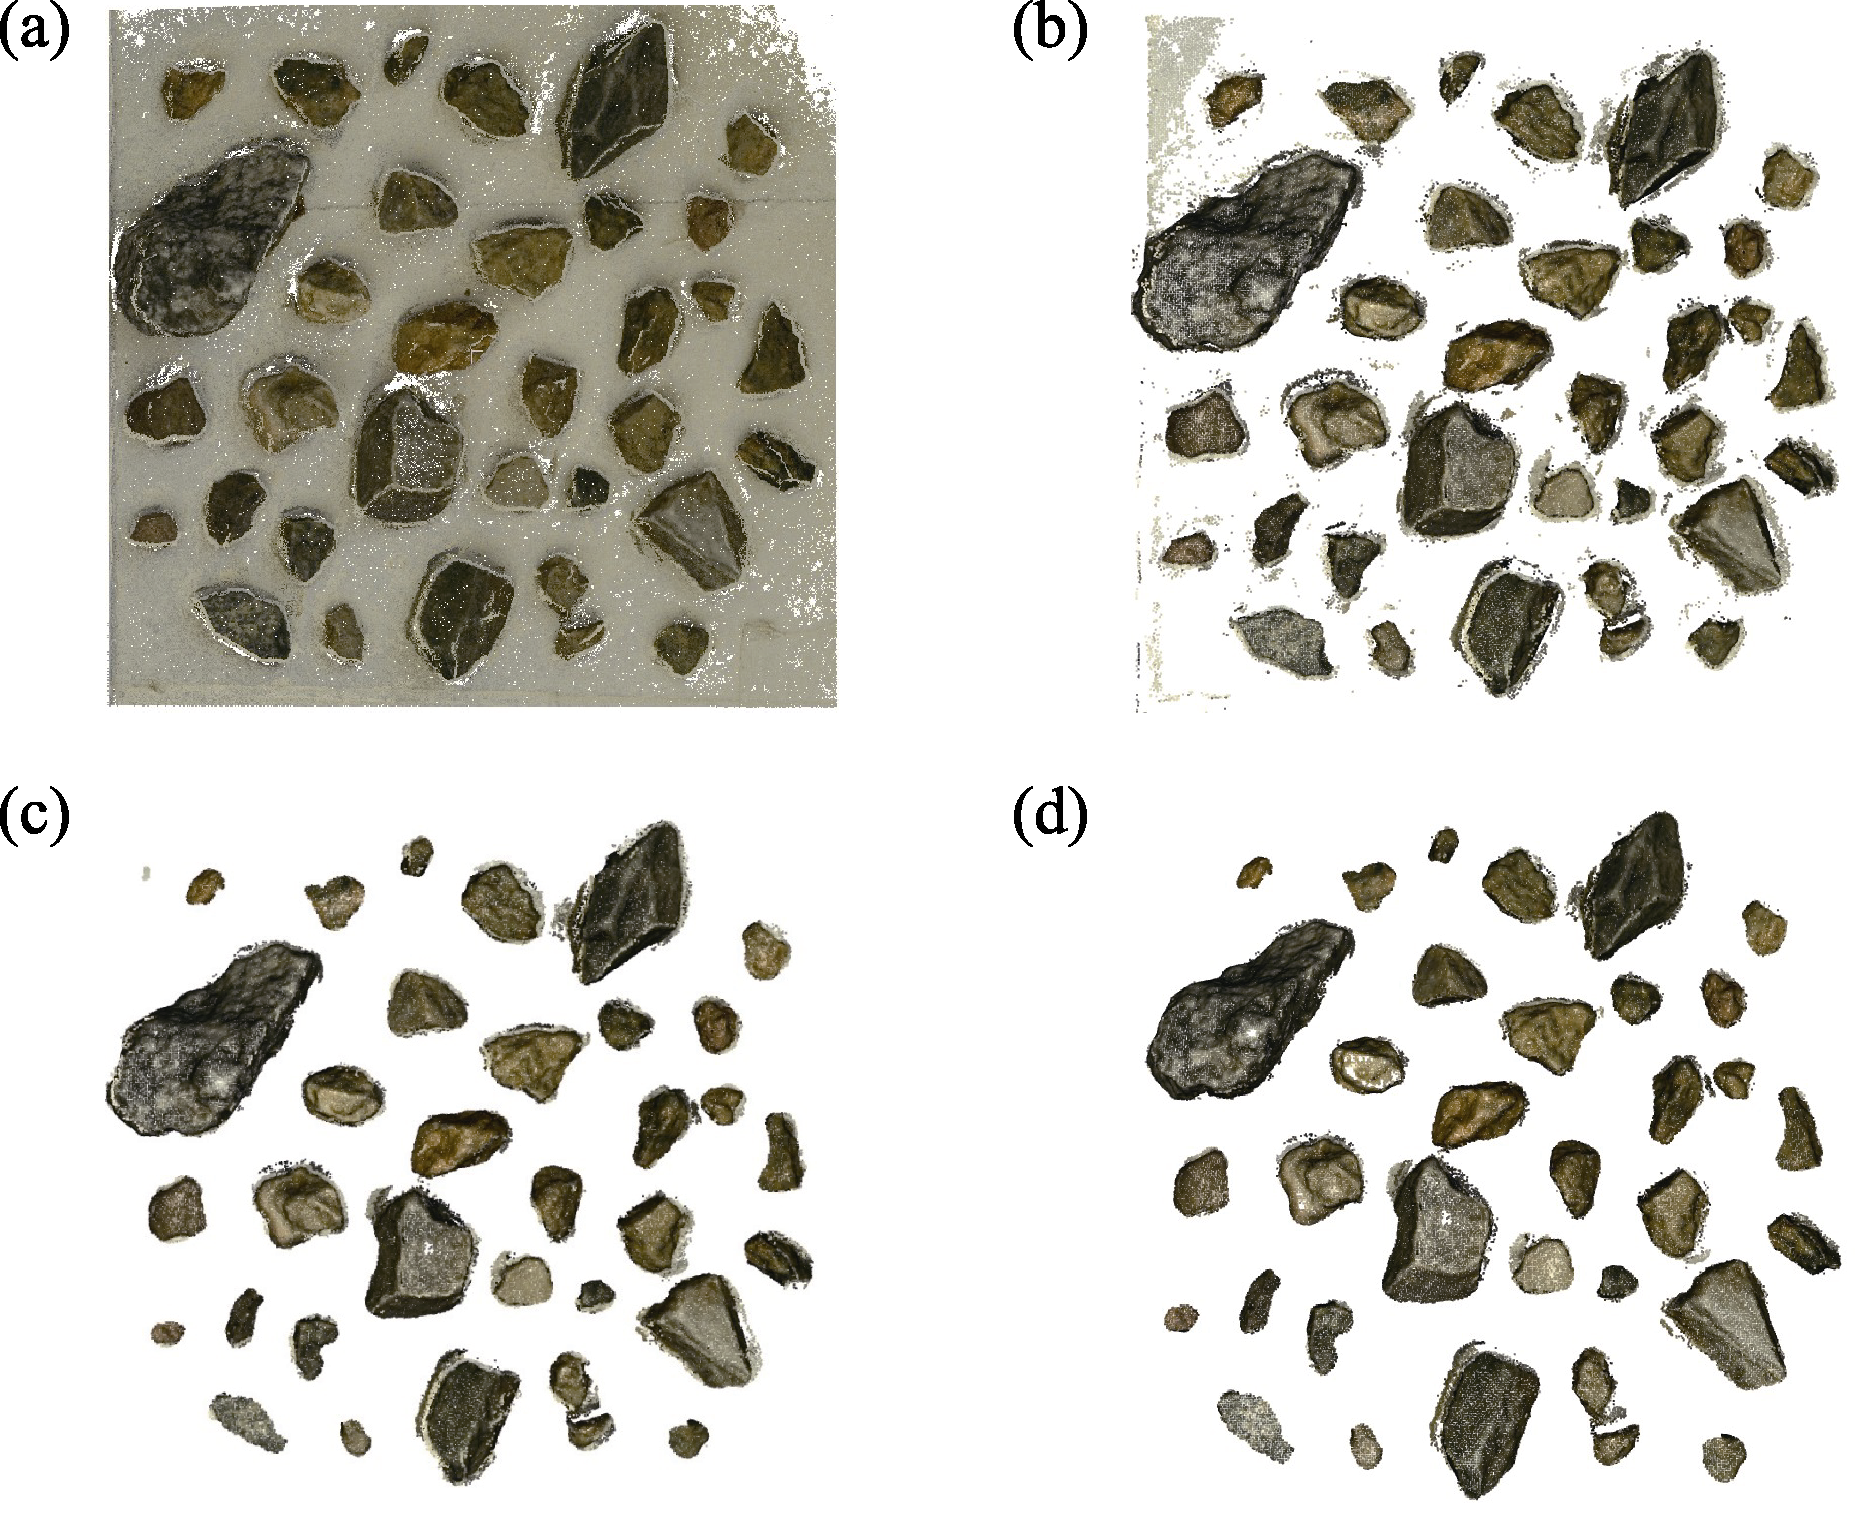
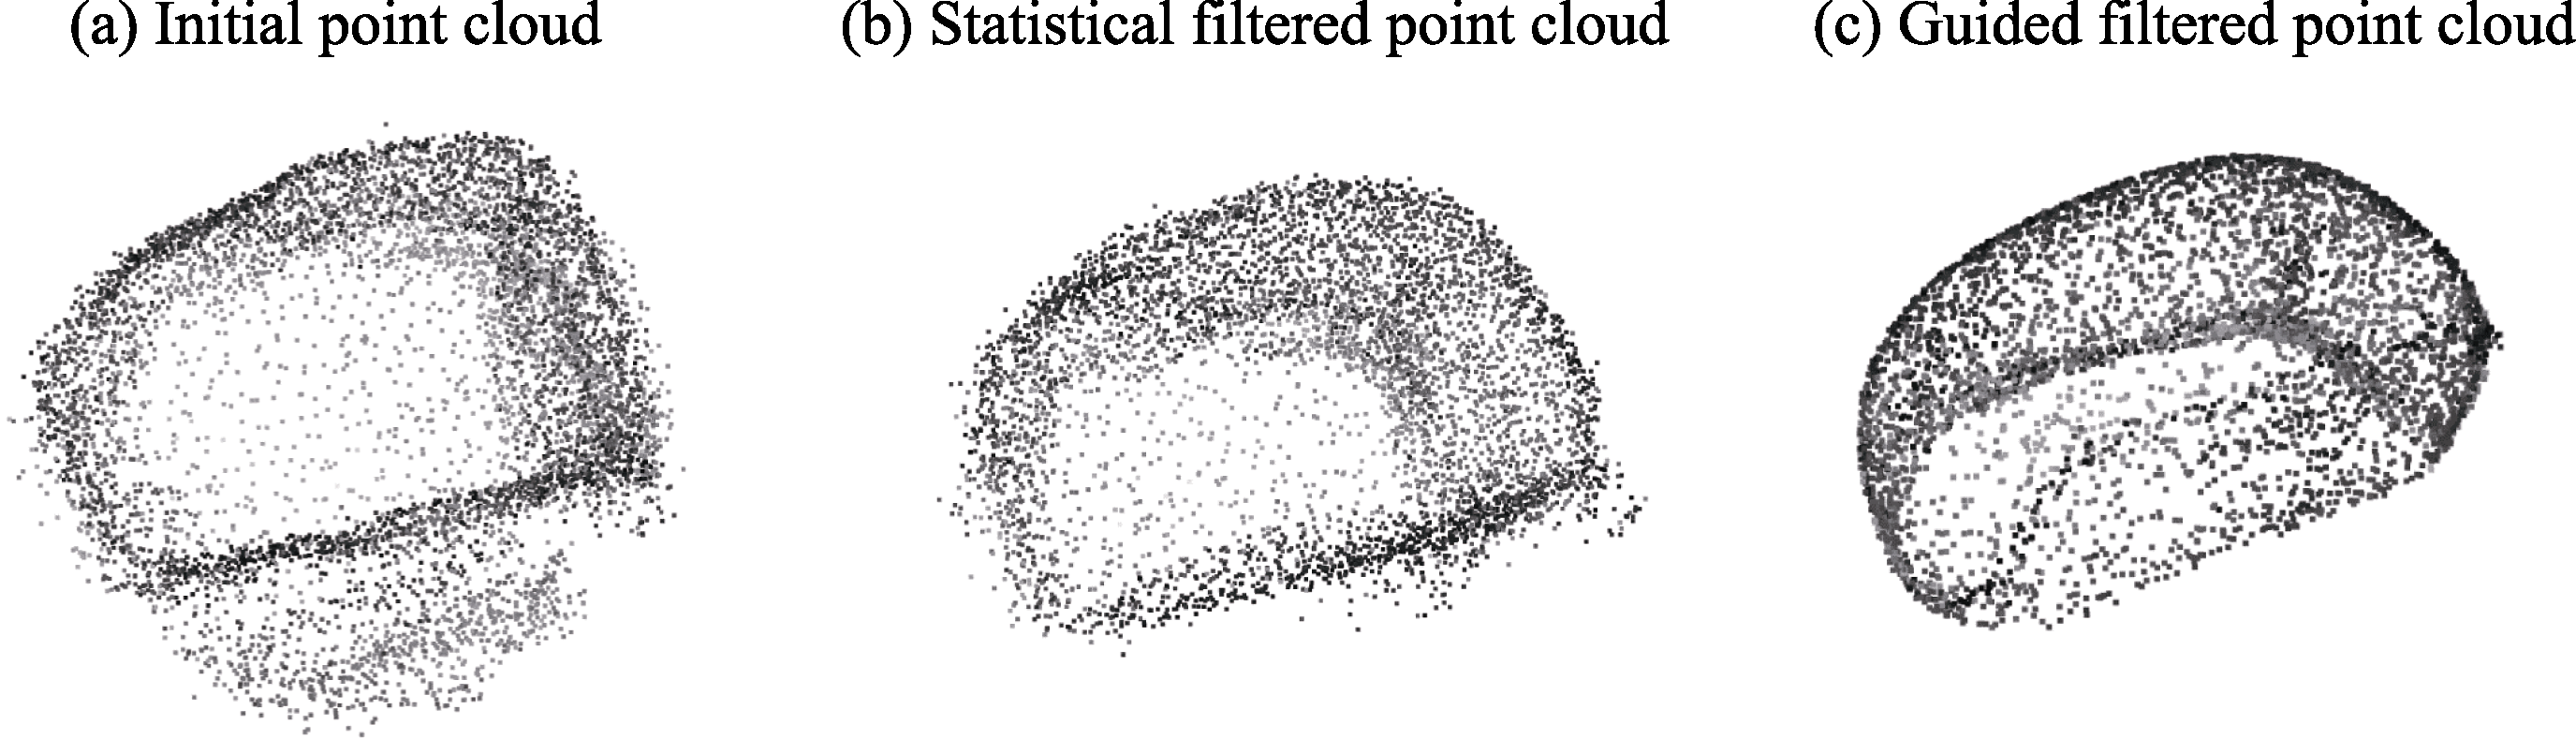
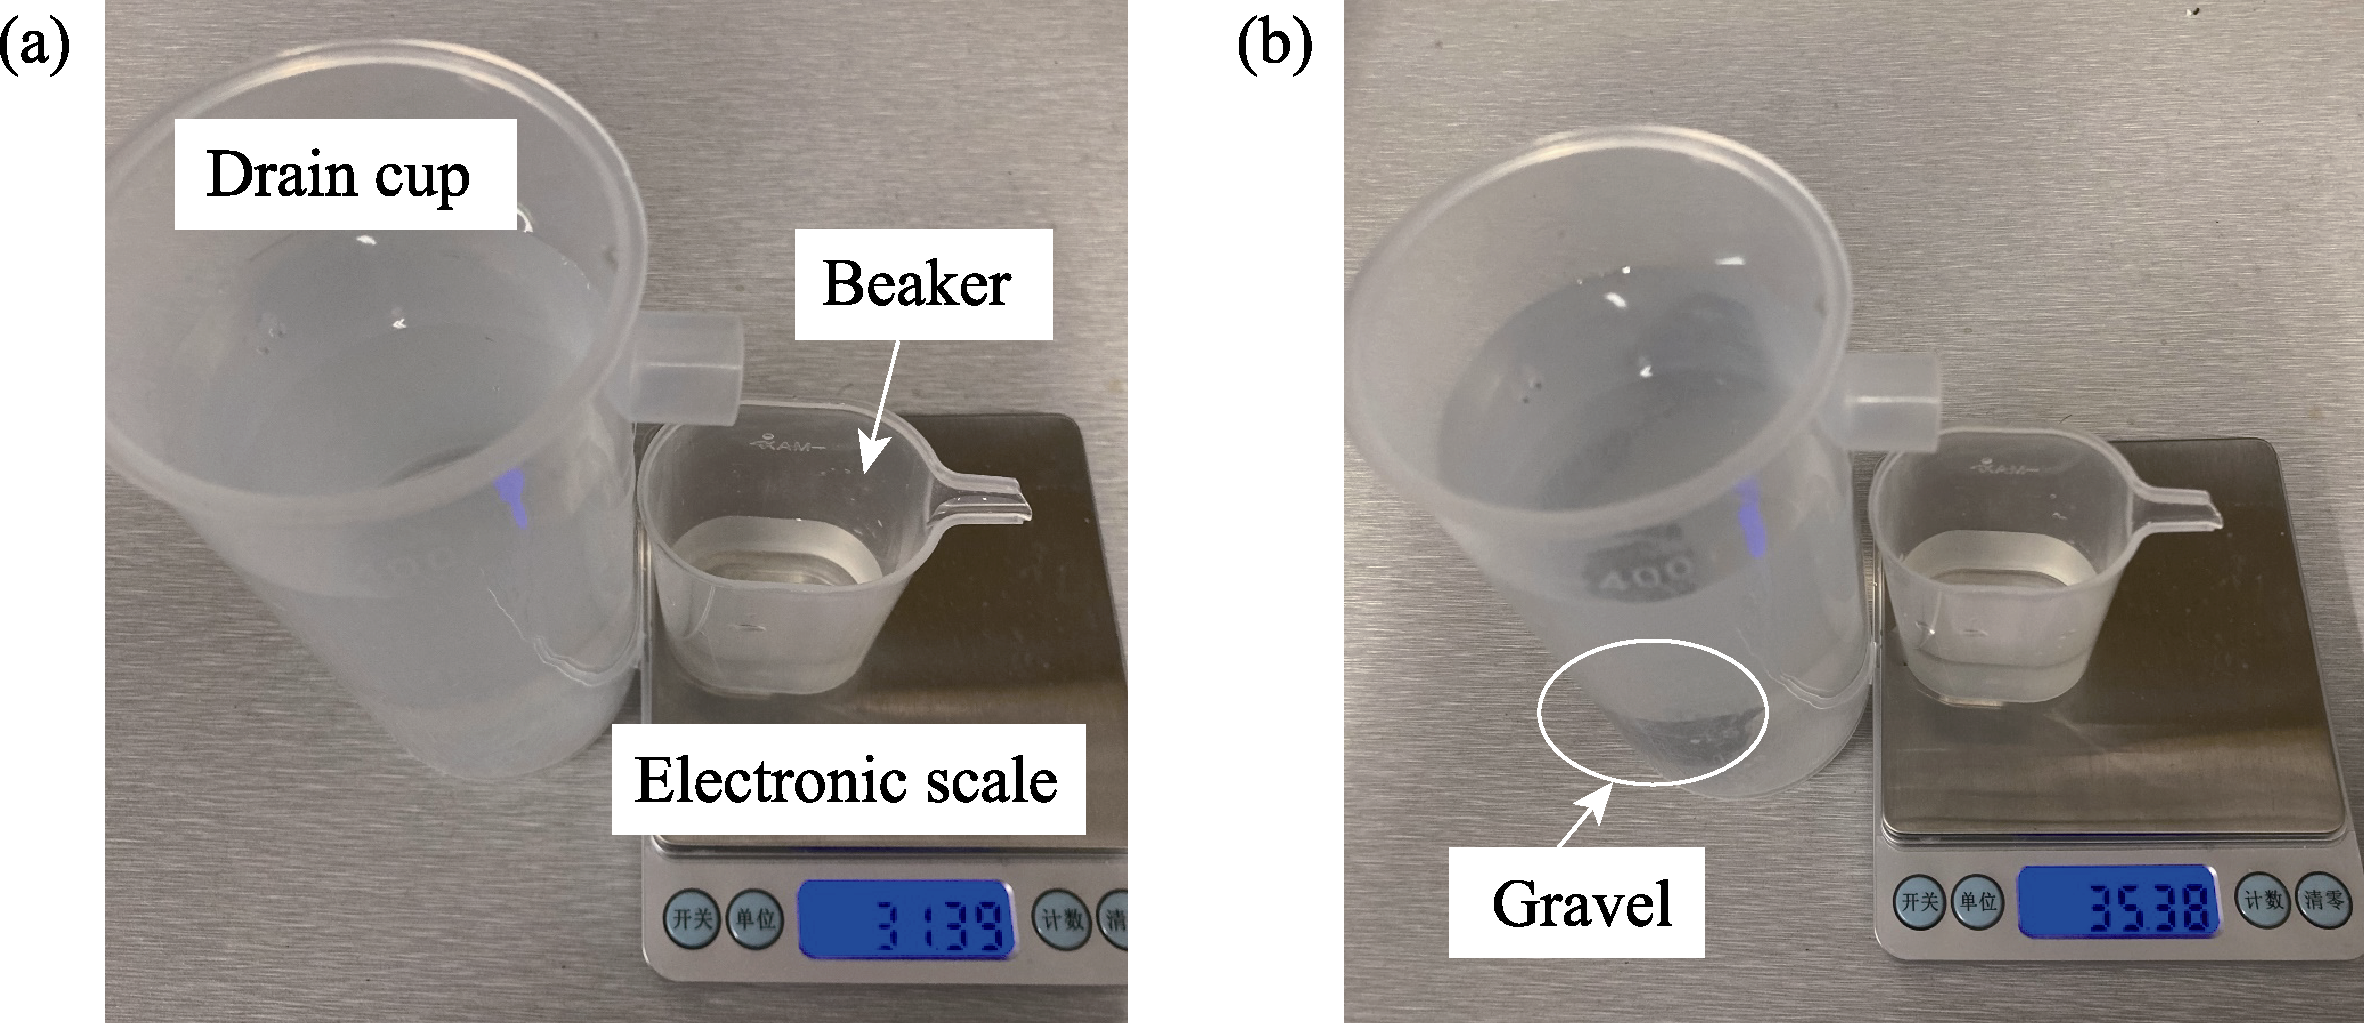
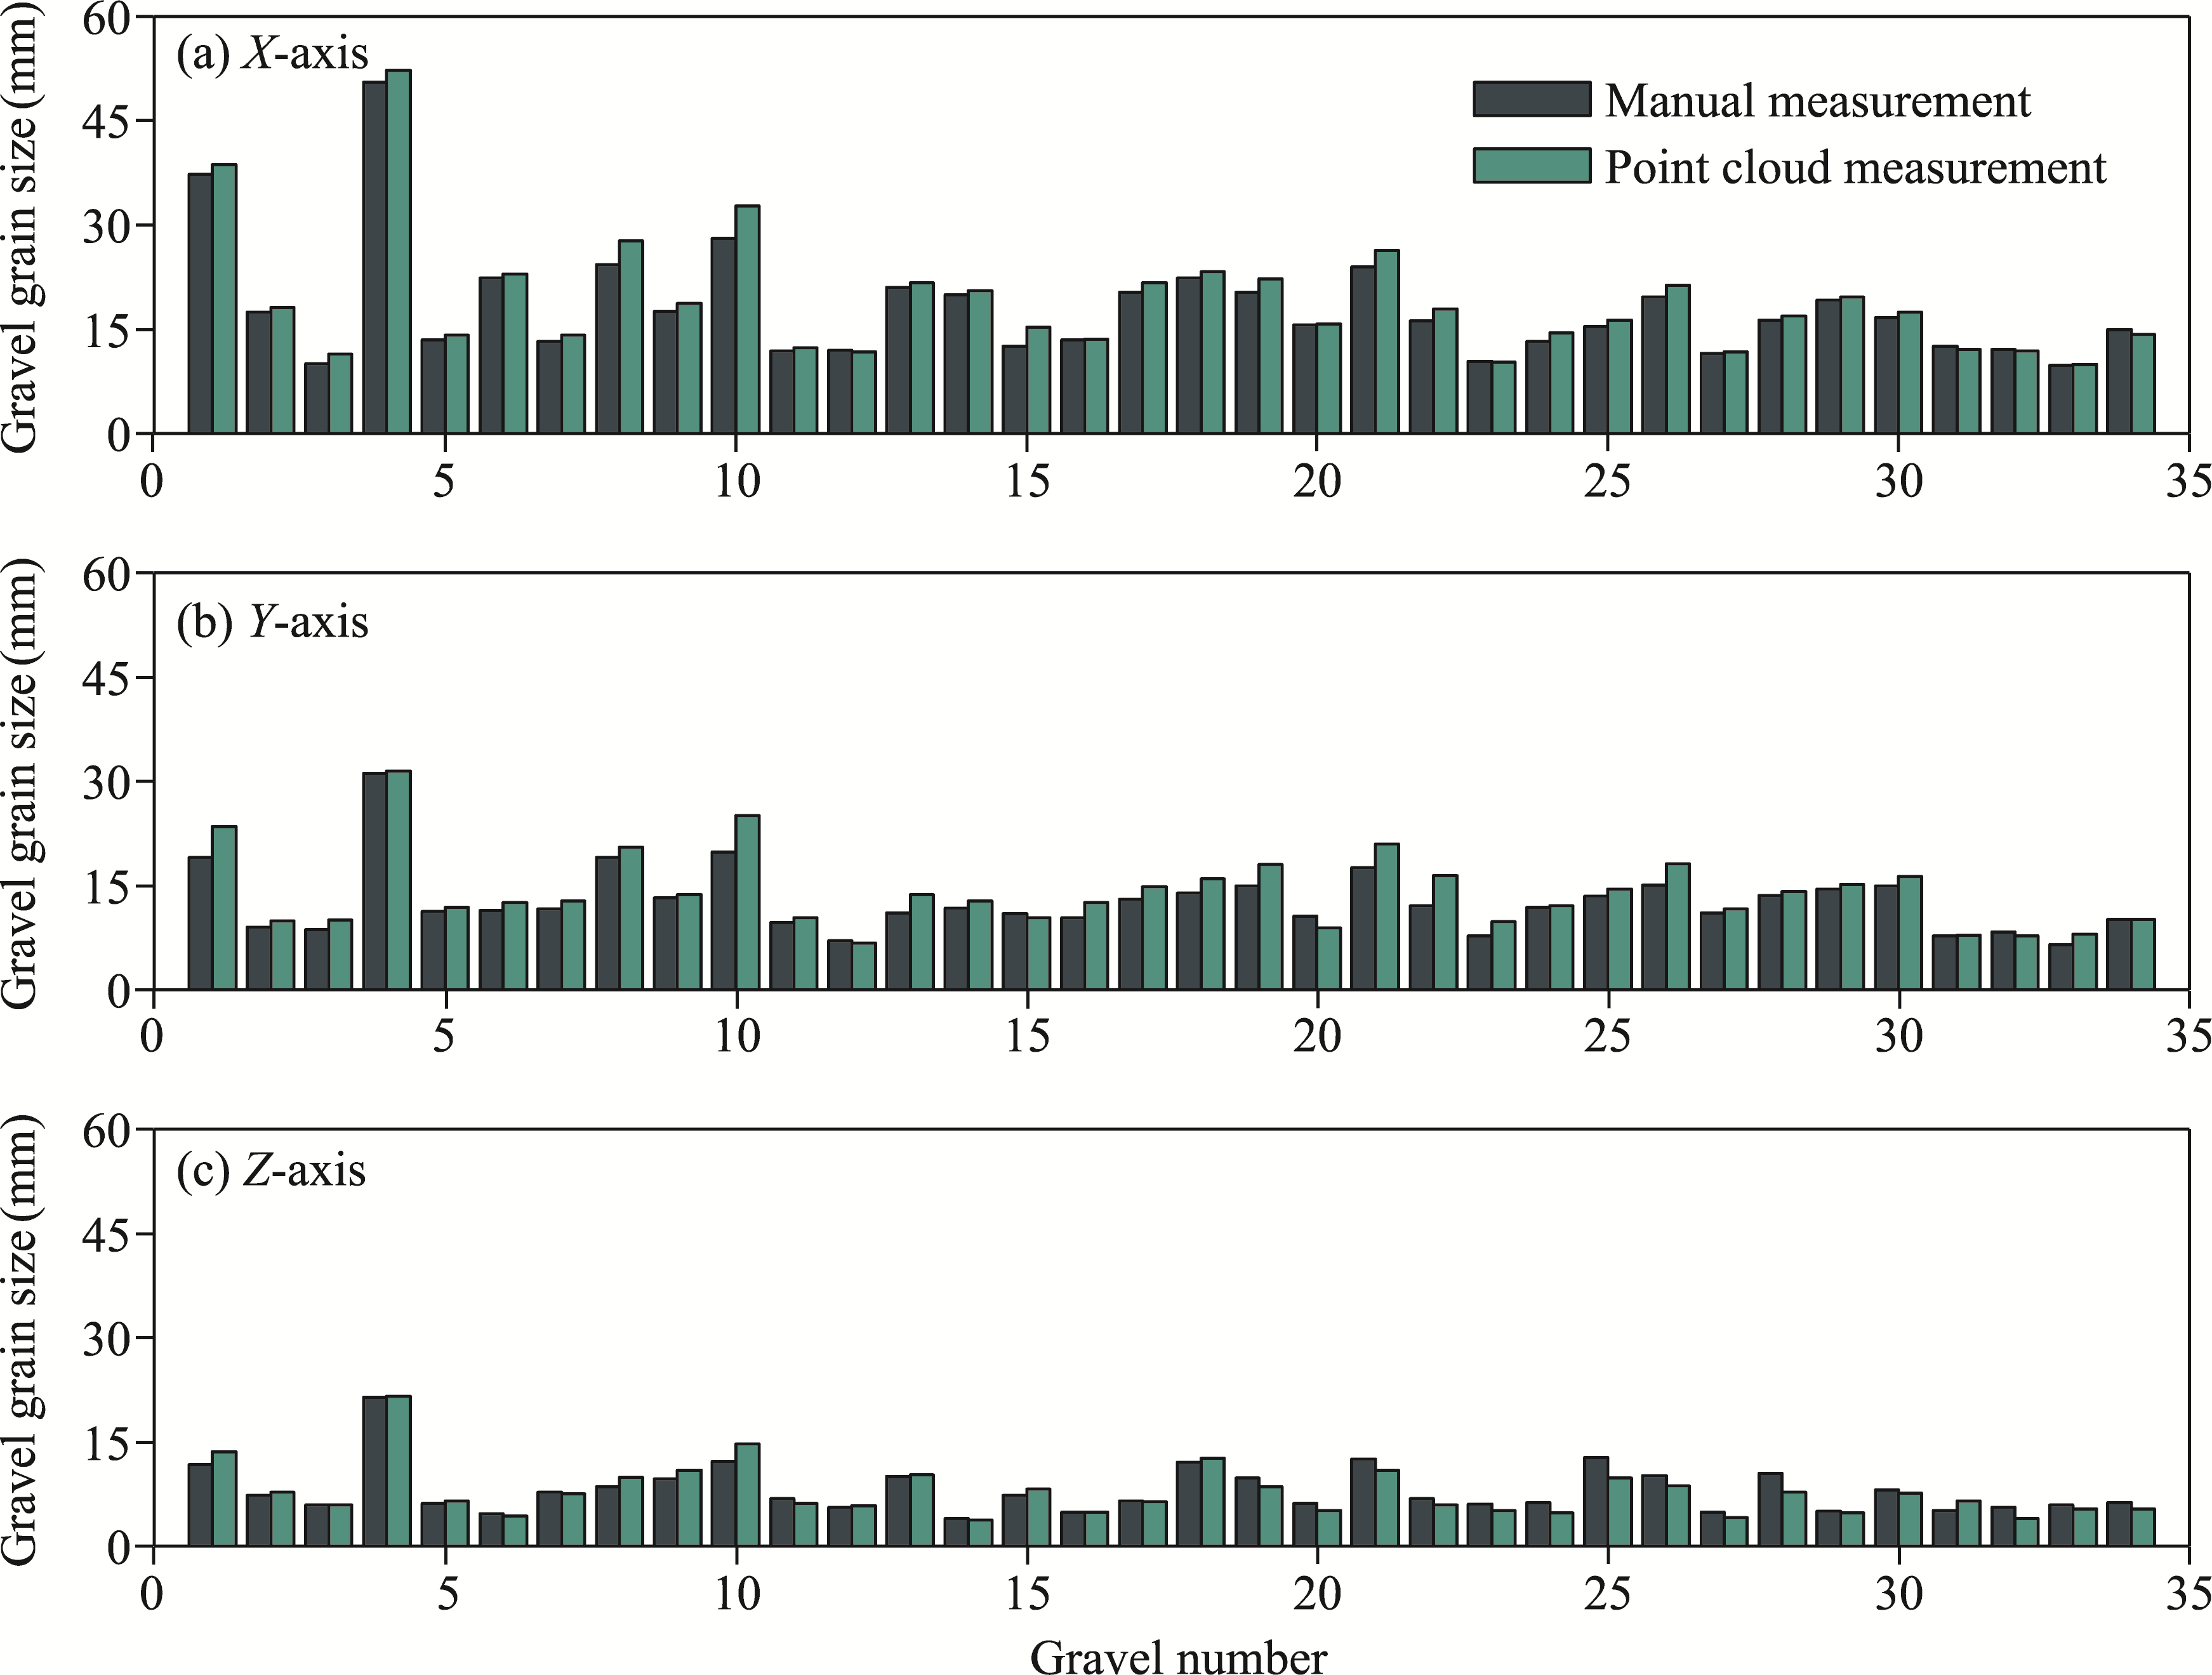
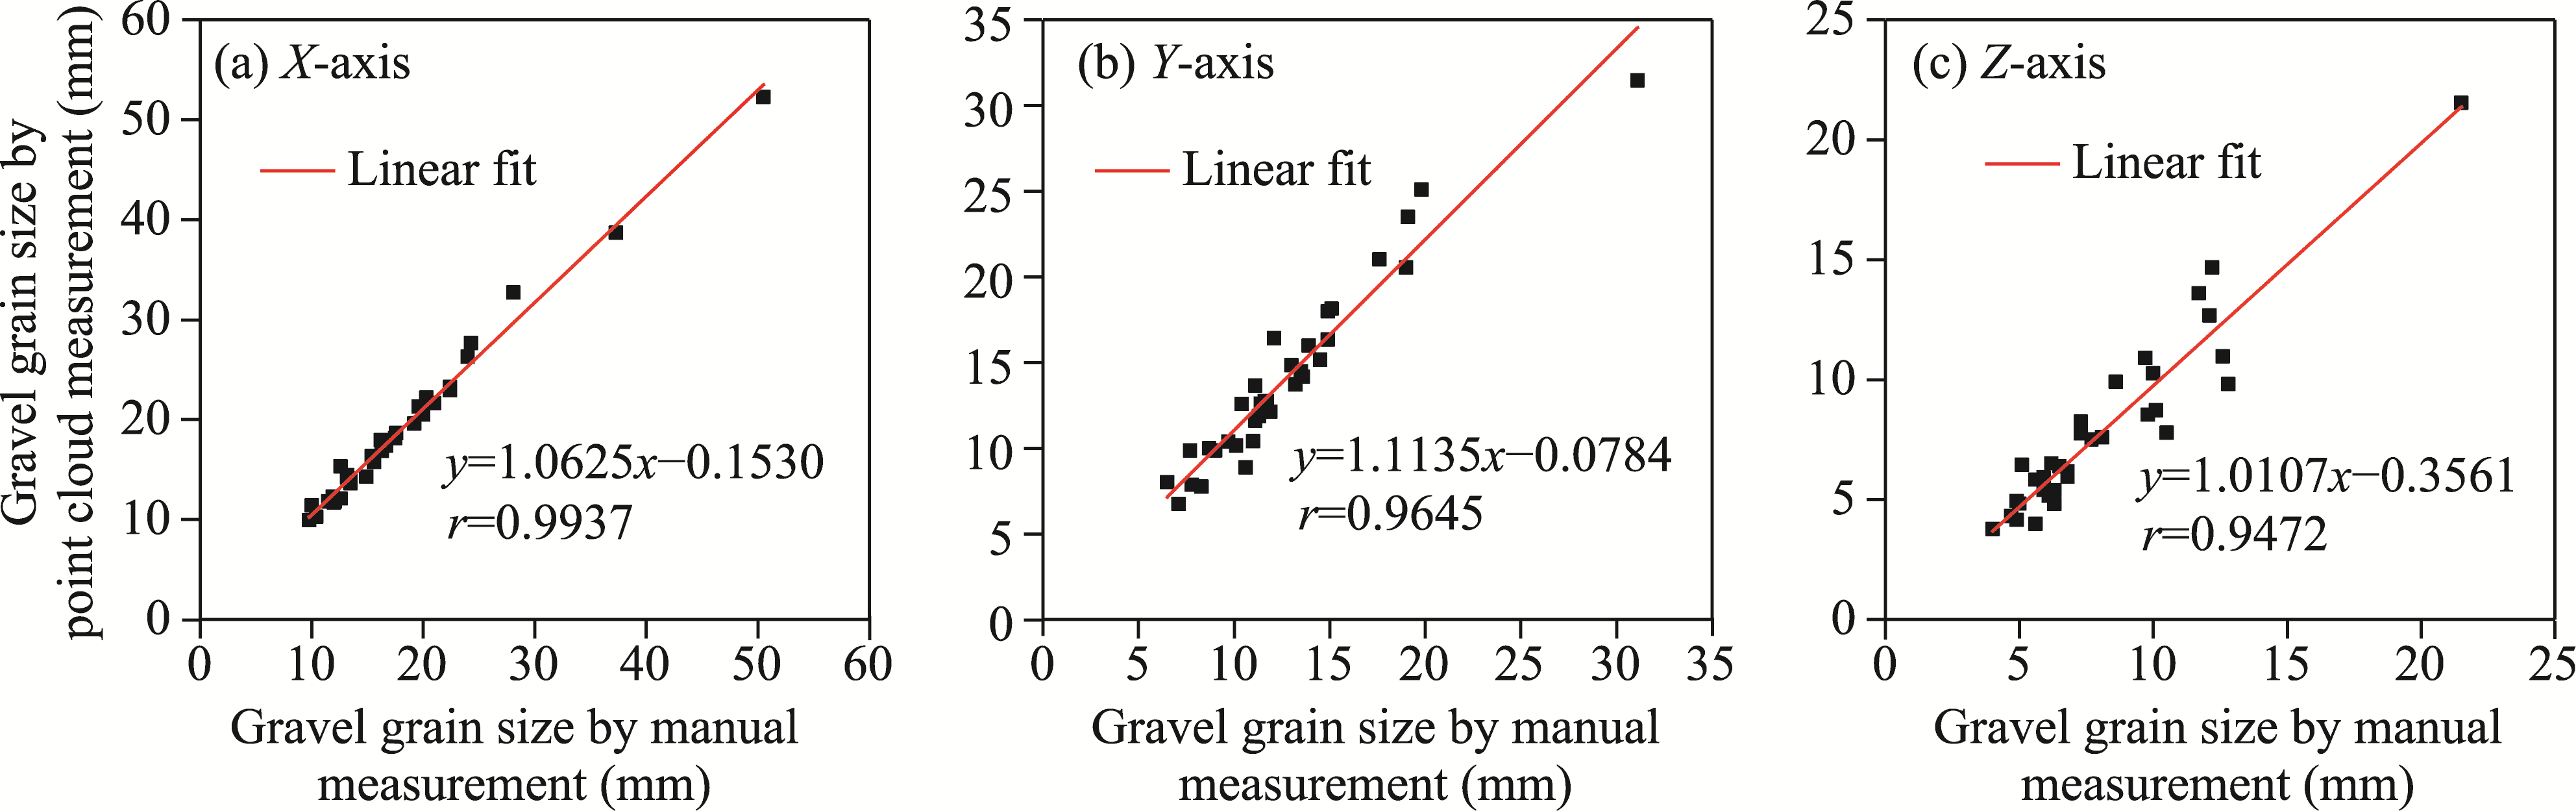
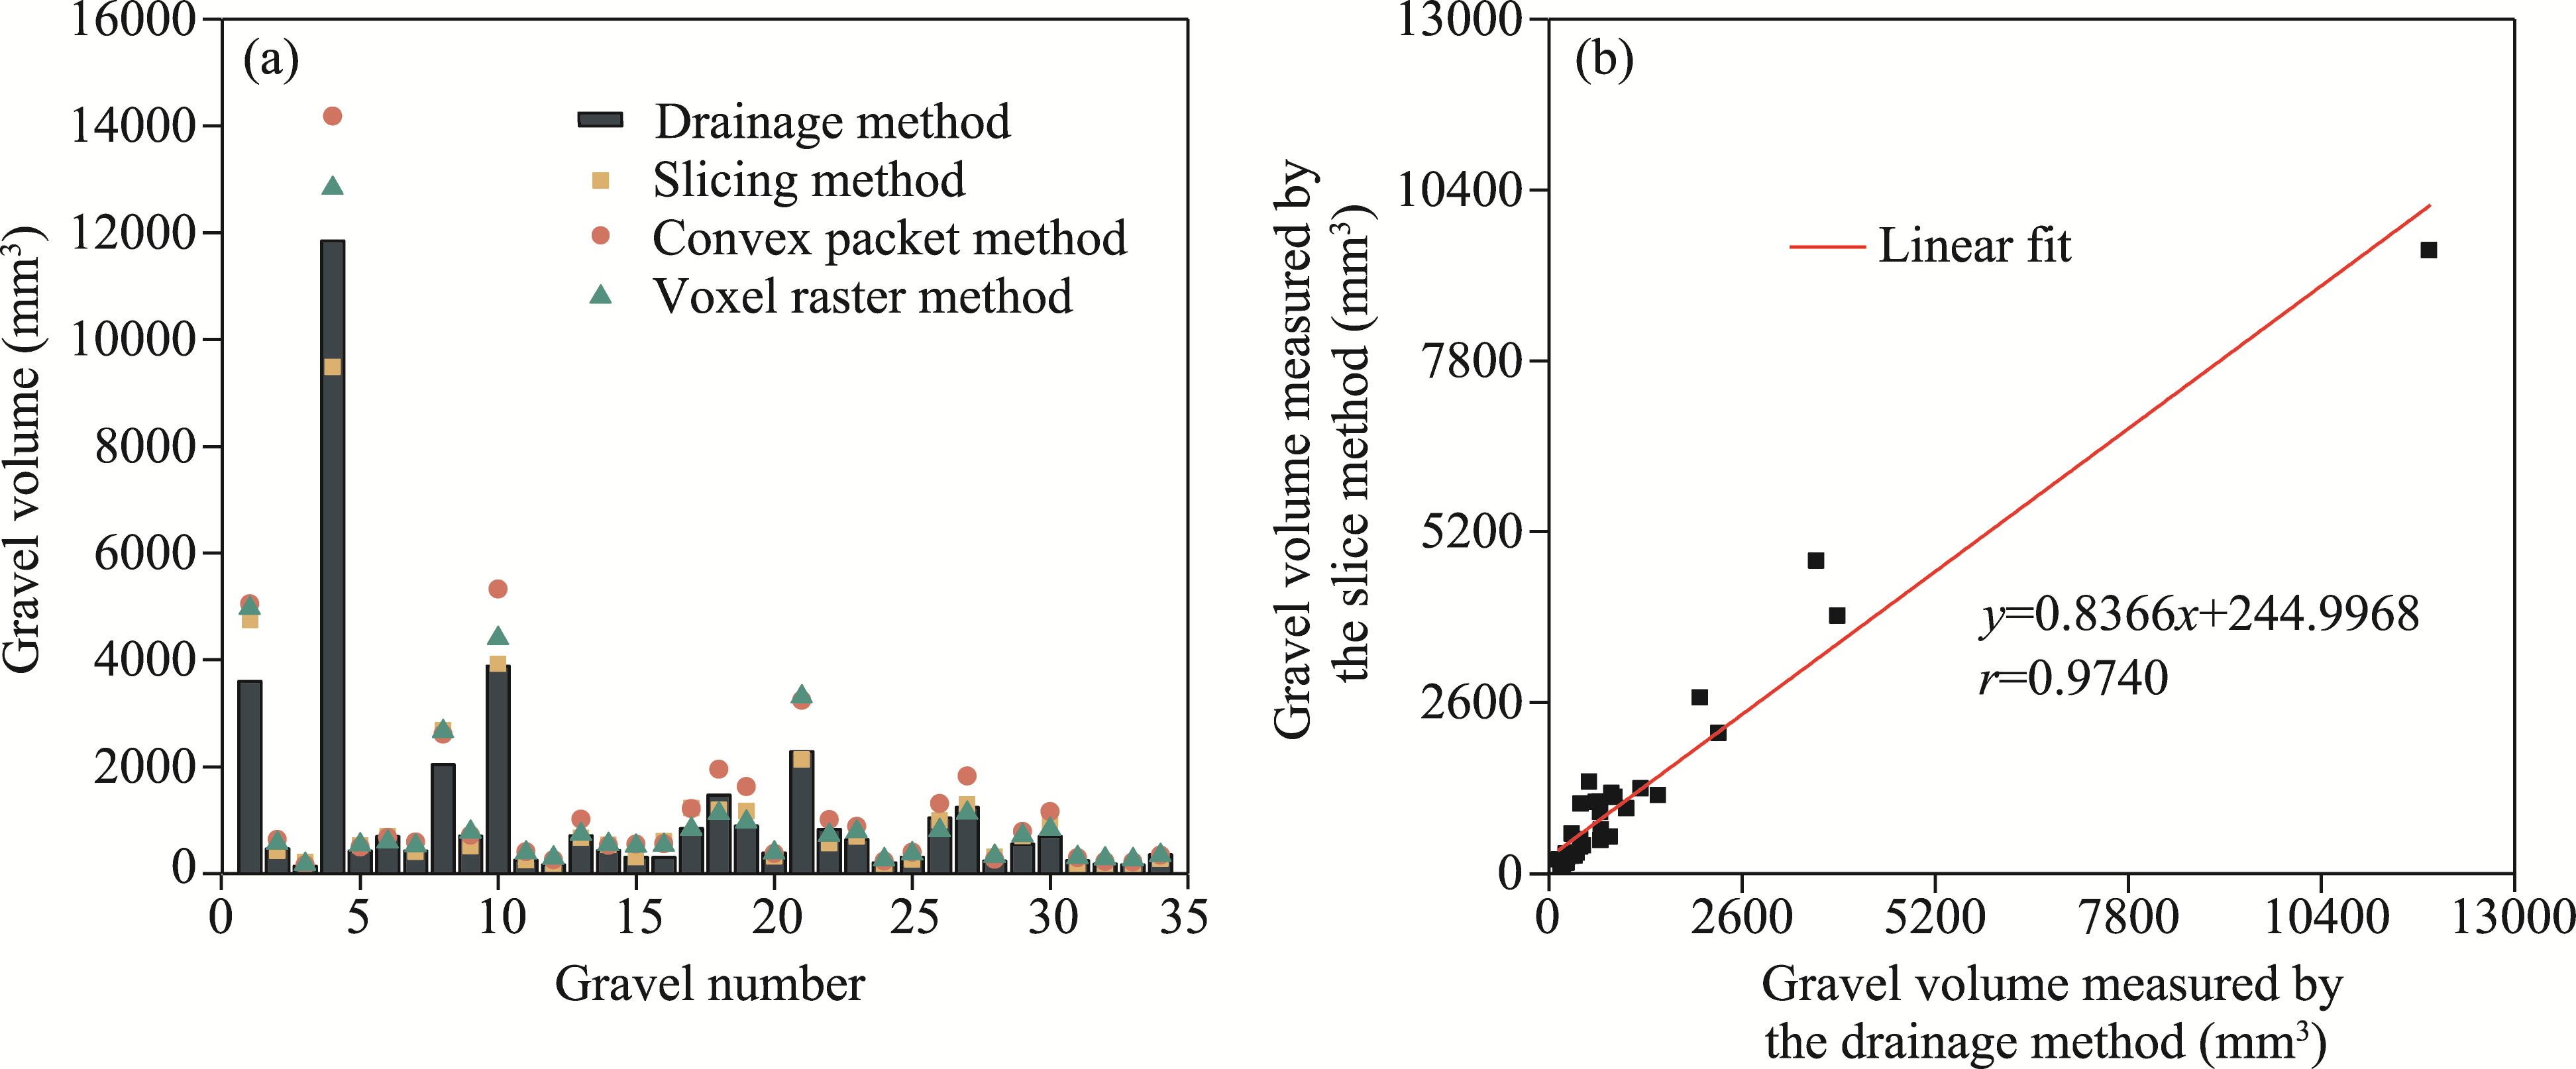
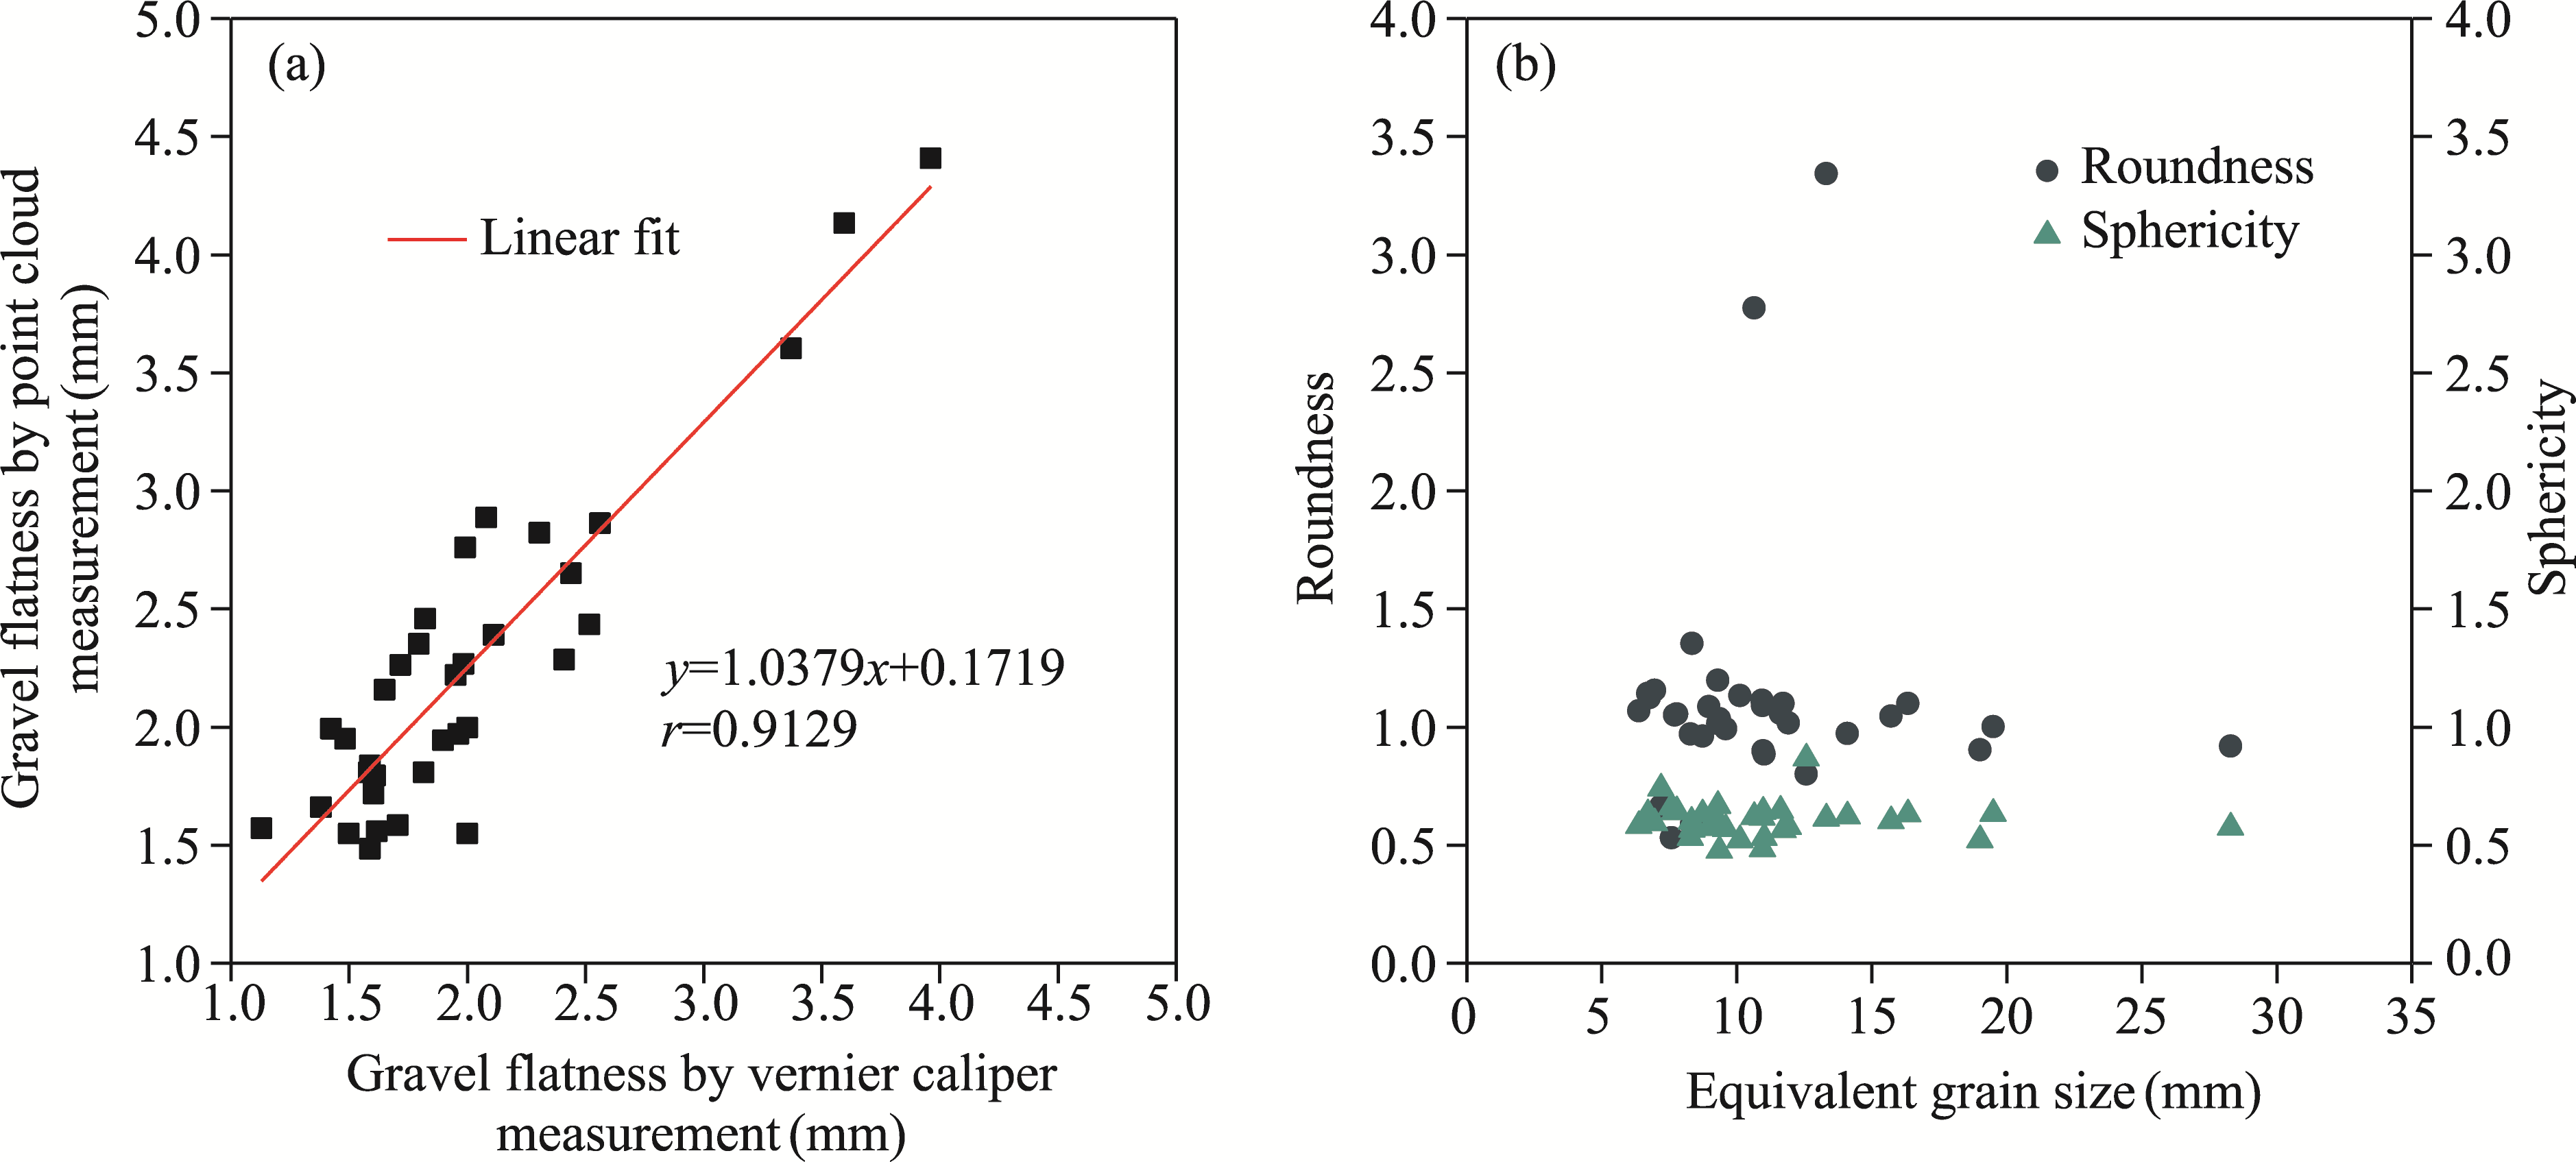
Abstract Gobi spans a large area of China, surpassing the combined expanse of mobile dunes and semi-fixed dunes. Its presence significantly influences the movement of sand and dust. However, the complex origins and diverse materials constituting the Gobi result in notable differences in saltation processes across various Gobi surfaces. It is challenging to describe these processes according to a uniform morphology. Therefore, it becomes imperative to articulate surface characteristics through parameters such as the three-dimensional (3D) size and shape of gravel. Collecting morphology information for Gobi gravels is essential for studying its genesis and sand saltation. To enhance the efficiency and information yield of gravel parameter measurements, this study conducted field experiments in the Gobi region across Dunhuang City, Guazhou County, and Yumen City (administrated by Jiuquan City), Gansu Province, China in March 2023. A research framework and methodology for measuring 3D parameters of gravel using point cloud were developed, alongside improved calculation formulas for 3D parameters including gravel grain size, volume, flatness, roundness, sphericity, and equivalent grain size. Leveraging multi-view geometry technology for 3D reconstruction allowed for establishing an optimal data acquisition scheme characterized by high point cloud reconstruction efficiency and clear quality. Additionally, the proposed methodology incorporated point cloud clustering, segmentation, and filtering techniques to isolate individual gravel point clouds. Advanced point cloud algorithms, including the Oriented Bounding Box (OBB), point cloud slicing method, and point cloud triangulation, were then deployed to calculate the 3D parameters of individual gravels. These systematic processes allow precise and detailed characterization of individual gravels. For gravel grain size and volume, the correlation coefficients between point cloud and manual measurements all exceeded 0.9000, confirming the feasibility of the proposed methodology for measuring 3D parameters of individual gravels. The proposed workflow yields accurate calculations of relevant parameters for Gobi gravels, providing essential data support for subsequent studies on Gobi environments.
|
|
Received: 11 December 2023
Published: 30 April 2024
|
|
Corresponding Authors:
*KAN Jiangming (E-mail: kanjm@bjfu.edu.cn)
|
|
|
| [1] |
Agüera-Vega F, Agüera-Puntas M, Martínez-Carricondo P, et al. 2020. Effects of point cloud density, interpolation method and grid size on derived Digital Terrain Model accuracy at micro topography level. International Journal of Remote Sensing, 41(21): 8281-8299.
doi: 10.1080/01431161.2020.1771788
|
|
|
| [2] |
Al-Rawabdeh A, He F N, Moussa A, et al. 2016. Using an unmanned aerial vehicle-based digital imaging system to derive a 3D point cloud for landslide scarp recognition. Remote Sensing, 8(2): 95, doi: 10.3390/rs8020095.
|
|
|
| [3] |
Arnold E, Al-Jarrah O Y, Dianati M, et al. 2019. A survey on 3D object detection methods for autonomous driving applications. IEEE Transactions on Intelligent Transportation Systems, 20(10): 3782-3795.
doi: 10.1109/TITS.6979
|
|
|
| [4] |
Babaeian M, Ataei M, Sereshki F, et al. 2019. A new framework for evaluation of rock fragmentation in open pit mines. Journal of Rock Mechanics and Geotechnical Engineering, 11(2): 325-336.
doi: 10.1016/j.jrmge.2018.11.006
|
|
|
| [5] |
Bao Y T, Lin P F, Li Y, et al. 2021. Parallel structure from motion for sparse point cloud generation in large-scale scenes. Sensors, 21(11): 3939, doi: 10.3390/s21113939.
|
|
|
| [6] |
Bertin S, Friedrich H. 2016. Field application of close-range digital photogrammetry (CRDP) for grain-scale fluvial morphology studies. Earth Surface Processes and Landforms, 41(10): 1358-1369.
doi: 10.1002/esp.v41.10
|
|
|
| [7] |
Bockheim J G. 2010. Evolution of desert pavements and the vesicular layer in soils of the Transantarctic Mountains. Geomorphology, 118(3-4): 433-443.
doi: 10.1016/j.geomorph.2010.02.012
|
|
|
| [8] |
Brasington J, Vericat D, Rychkov I. 2012. Modeling river bed morphology, roughness, and surface sedimentology using high resolution terrestrial laser scanning. Water Resources Research, 48(11): W11519, doi: 10.1029/2012WR012223.
|
|
|
| [9] |
Bunte K, Abt S R. 2001. Sampling surface and subsurface particle-size distributions in wadable gravel-and cobble-bed streams for analyses in sediment transport, hydraulics, and streambed monitoring. General Technical Report RMRS-GTR-74. Fort Collins, Colorado, USA: US Department of Agriculture, Forest Service, Rocky Mountain Research Station.
|
|
|
| [10] |
Chen Z A, Scott T R, Bearman S, et al. 2020. Geomorphological analysis using unpiloted aircraft systems, structure from motion, and deep learning. In: 2020 IEEE/RSJ International Conference on Intelligent Robots and Systems (IROS). Las Vegas, NV, USA, 1276-1283.
|
|
|
| [11] |
Cheng J J, Jiang F Q, Xue C X, et al. 2015. Characteristics of the disastrous wind-sand environment along railways in the Gobi area of Xinjiang, China. Atmospheric Environment, 102: 344-354.
doi: 10.1016/j.atmosenv.2014.12.018
|
|
|
| [12] |
Claude N, Rodrigues S, Bustillo V, et al. 2012. Estimating bedload transport in a large sand-gravel bed river from direct sampling, dune tracking and empirical formulas. Geomorphology, 179: 40-57.
doi: 10.1016/j.geomorph.2012.07.030
|
|
|
| [13] |
Clayton C R I, Abbireddy C O R, Schiebel R. 2009. A method of estimating the form of coarse particulates. Géotechnique, 59(6): 493-501.
doi: 10.1680/geot.2007.00195
|
|
|
| [14] |
Diplas P, Sutherland A J. 1988. Sampling techniques for gravel sized sediments. Journal of Hydraulic Engineering, 114(5): 484-501.
doi: 10.1061/(ASCE)0733-9429(1988)114:5(484)
|
|
|
| [15] |
Dong Z B, Lyu P. 2020. Development of aeolian geomorphology in China in the past 70 years. Acta Geographica Sinica, 75(3): 509-528. (in Chinese)
|
|
|
| [16] |
Elskamp F, Kruggel-Emden H, Hennig M, et al. 2017. A strategy to determine DEM parameters for spherical and non-spherical particles. Granular Matter, 19(3): 46, doi: 10.1007/s10035-017-0710-0.
|
|
|
| [17] |
Ester M, Kriegel H P, Sander J, et al. 1996. A density-based algorithm for discovering clusters in large spatial databases with noise. In: Proceedingsof the Second International Conference on Knowledge Discovery and Data Mining (KDD'96). Washington, DC: Association for the Advancement of Artificial Intelligence (AAAI) Press, 226-231.
|
|
|
| [18] |
Feng Y M, Wu B, Zhou N, et al. 2013. Gobi classification system based on remote sensing image recognition. Journal of Desert Research, 33(3): 635-641. (in Chinese)
|
|
|
| [19] |
Feng Y M, Wu B, Yao A D, et al. 2014. A study on classification system and inventory of Gobi. Acta Geographica Sinica, 69(3): 391-398. (in Chinese)
doi: 10.11821/dlxb201403010
|
|
|
| [20] |
Fischler M A, Bolles R C. 1981. Random sample consensus: a paradigm for model fitting with applications to image analysis and automated cartography. Communications of the ACM, 24(6): 381-395.
doi: 10.1145/358669.358692
|
|
|
| [21] |
Fouinat L, Sabatier P, Poulenard J, et al. 2017. A new CT scan methodology to characterize a small aggregation gravel clast contained in a soft sediment matrix. Earth Surface Dynamics, 5(1): 199-209.
doi: 10.5194/esurf-5-199-2017
|
|
|
| [22] |
Gao J L. 2019. Characteristics of surface sediments of the alluvial fan Gobi in arid area. PhD Dissertation. Beijing: Chinese Academy of Forestry. (in Chinese)
|
|
|
| [23] |
Gao J L, Wu B, Pang Y J, et al. 2020. Grain-size characteristics of surface sediments of the accumulation formed Gobi in eastern piedmont of Langshan Mountain, Inner Mongolia. Journal of Arid Land Resources and Environment, 34(11): 97-103. (in Chinese)
|
|
|
| [24] |
Han X F, Jin J S, Wang M J, et al. 2017. A review of algorithms for filtering the 3D point cloud. Signal Processing: Image Communication, 57: 103-112.
doi: 10.1016/j.image.2017.05.009
|
|
|
| [25] |
Jia G P. 2022. Morphological characteristics and dynamic evolution process of crescent-shaped sand dunes in the Alashan Gobi region. PhD Dissertation. Hohhot: Inner Mongolia Agricultural University. (in Chinese)
|
|
|
| [26] |
Li H S, Wang W F, Wu F S, et al. 2014. A new sand-wedge-forming mechanism in an extra-arid area. Geomorphology, 211: 43-51.
doi: 10.1016/j.geomorph.2013.12.028
|
|
|
| [27] |
Liang A M, Zhang Z C, Lizaga I, et al. 2023. Which is the dominant source for the aeolian sand in the Badain Jaran Sand Sea, Northwest China: Fluvial or gobi sediments? Catena, 225: 107011, doi: 10.1016/j.catena.2023.107011.
|
|
|
| [28] |
Liu K, Boehm J. 2015. Classification of big point cloud data using cloud computing. The International Archives of the Photogrammetry, Remote Sensing and Spatial Information Sciences, XL-3/W3: 553-557.
doi: 10.5194/isprsarchives-XL-3-W3-553-2015
|
|
|
| [29] |
Liu X Y, Wang H B, Zuo H J, et al. 2022. Fractal of the Gobi surface sediment components and its variability characteristics. Catena, 218: 106525, doi: 10.1016/j.catena.2022.106525.
|
|
|
| [30] |
Masson F X, Beaudoin G, Laurendeau D. 2023. Multi-method 2D and 3D reconstruction of gold grain morphology in alluvial deposits: a review and application to the Rivière du Moulin (Québec, Canada). Geological Society, London, Special Publications, 516: 337-352.
doi: 10.1144/SP516-2020-186
|
|
|
| [31] |
Mu Y. 2017. Research on multi-scale quantitative estimation and spatial distribution analysis of the characteristics of Gobi surficial gravel. PhD Dissertation. Beijing: Chinese Academy of Forestry. (in Chinese)
|
|
|
| [32] |
Obanawa H, Hayakawa Y S. 2018. Variations in volumetric erosion rates of bedrock cliffs on a small inaccessible coastal island determined using measurements by an unmanned aerial vehicle with Structure-from-motion and terrestrial laser Scanning. Progress in Earth and Planetary Science, 5(1): 33, doi: 10.1186/s40645-018-0191-8.
|
|
|
| [33] |
Pan D D, Xu Z H, Lu X M, et al. 2020. 3D scene and geological modeling using integrated multi-source spatial data: Methodology, challenges, and suggestions. Tunnelling and Underground Space Technology, 100: 103393, doi: 10.1016/j.tust.2020.103393.
|
|
|
| [34] |
Qian G Q, Dong Z B, Luo W Y, et al. 2014. Gravel morphometric analysis based on digital images of different Gobi surfaces in northwestern China. Journal of Desert Research, 34(3): 625-633. (in Chinese)
doi: 10.7522/j.issn.1000-694X.2013.00365
|
|
|
| [35] |
Ojeda-Magaña B, Ruelas R, Quintanilla-Domínguez J, et al. 2020. Detection and quantification of pore, solid and gravel spaces in CT images of a 3D soil sample. Applied Mathematical Modelling, 85: 360-377.
doi: 10.1016/j.apm.2020.04.021
|
|
|
| [36] |
Rahmani H, Scanlan C, Nadeem U, et al. 2019. Automated segmentation of gravel particles from depth images of gravel-soil mixtures. Computers & Geosciences, 128: 1-10.
doi: 10.1016/j.cageo.2019.03.005
|
|
|
| [37] |
Schonberger J L, Frahm J M. 2016. Structure-from-motion revisited. Proceedings of the IEEE conference on computer vision and pattern recognition. [2023-11-01]. Schonberger_Structure-From-Motion_Revisited_CVPR_2016_paper.pdf (cv-foundation.org).
|
|
|
| [38] |
Shen Y C, Wang X H, Cheng W M, et al. 2016. Integrated physical regionalization of stony deserts in China. Progress in Geography. 35(1): 57-66. (in Chinese)
doi: 10.18306/dlkxjz.2016.01.007
|
|
|
| [39] |
Shrivastava S, Deb D, Bhattacharjee S. 2022. Prediction of particle size distribution curves of dump materials using convolutional neural networks. Rock Mechanics and Rock Engineering, 55(1): 471-479.
doi: 10.1007/s00603-021-02657-y
|
|
|
| [40] |
Stahl M, Konietzky H. 2011. Discrete element simulation of ballast and gravel under special consideration of grain-shape, grain-size and relative density. Granular Matter, 13(4): 417-428.
doi: 10.1007/s10035-010-0239-y
|
|
|
| [41] |
Ta W Q, Xiao Z, Qu J J, et al. 2003. Characteristics of dust particles from the desert/Gobi area of northwestern China during dust-storm periods. Environmental Geology, 43(6): 667-679.
doi: 10.1007/s00254-002-0673-1
|
|
|
| [42] |
Tao J Y, Zhang C M, Zhu Y. 2015. A Review of Methods for Measuring the Roundness of Gravel Grinding. 2015 National Sedimentology Conference on Sedimentology and Unconventional Resources Abstracts Collection. College of Geosciences, Wuhan: Changjiang University, 522-523. (in Chinese)
|
|
|
| [43] |
Thurley M J. 2011. Automated online measurement of limestone particle size distributions using 3D range data. Journal of Process Control, 21(2): 254-262.
doi: 10.1016/j.jprocont.2010.11.011
|
|
|
| [44] |
Tonina D, McKean J A, Benjankar R M, et al. 2020. Evaluating the performance of topobathymetric LiDAR to support multi-dimensional flow modelling in a gravel-bed mountain stream. Earth Surface Processes and Landforms, 45(12): 2850-2868.
doi: 10.1002/esp.v45.12
|
|
|
| [45] |
Vázquez-Tarrío D, Borgniet L, Liébault F, et al. 2017. Using UAS optical imagery and SfM photogrammetry to characterize the surface grain size of gravel bars in a braided river (Vénéon River, French Alps). Geomorphology, 285: 94-105.
doi: 10.1016/j.geomorph.2017.01.039
|
|
|
| [46] |
Wang H L. 2013. Study on the particle characteristics of wind erosion surface based on digital image processing. PhD Dissertation. Hohhot: Inner Mongolia Agricultural University. (in Chinese)
|
|
|
| [47] |
Wang L M. 2005. Particle size measurement based on image analysis method. Chemical Equipment Technology, 26(4): 65-67. (in Chinese)
|
|
|
| [48] |
Westoby M J, Brasington J, Glasser N F, et al. 2012. 'Structure-from-Motion' photogrammetry: A low-cost, effective tool for geoscience applications. Geomorphology, 179: 300-314.
doi: 10.1016/j.geomorph.2012.08.021
|
|
|
| [49] |
Williams R D, Lamy M L, Maniatis G, et al. 2020. Three-dimensional reconstruction of fluvial surface sedimentology and topography using personal mobile laser scanning. Earth Surface Processes and Landforms, 45(1): 251-261.
doi: 10.1002/esp.4747
|
|
|
| [50] |
Woodget A S, Austrums R. 2017. Subaerial gravel size measurement using topographic data derived from a UAV-SfM approach. Earth Surface Processes and Landforms, 42(9): 1434-1443.
doi: 10.1002/esp.v42.9
|
|
|
| [51] |
Wu Q, Xu H. 2014. Three-dimensional geological modeling and its application in digital mine. Science China Earth Sciences, 57: 491-502.
doi: 10.1007/s11430-013-4671-9
|
|
|
| [52] |
Yaghoobi H, Mansouri H, Farsangi M A E, et al. 2019. Determining the fragmented rock size distribution using textural feature extraction of images. Powder technology, 342: 630-641.
doi: 10.1016/j.powtec.2018.10.006
|
|
|
| [53] |
Yao A D. 2014. Extraction of Gobi information and quantitative inversion of surface gravel grain size based size on TM images. MSc Thesis. Beijing: Chinese Academy of Forestry. (in Chinese)
|
|
|
| [54] |
Zamani P, Mohajeri S H, Samadi A. 2019. Application of Structure from Motion (SFM) method to determine the bed surface particles sizes in Gravel Bed Rivers. Iranian Journal of Soil and Water Research, 50(1): 215-230. (in Persian)
|
|
|
| [55] |
Zhang K. 2019. Study on the control engineering of wind-blown sand disasters along the Qinghai Section of Golmud-Korla Railway. PhD Dissertation. Lanzhou: Lanzhou Jiaotong University. (in Chinese)
|
|
|
| [56] |
Zhang L. 2022. Simulation and optimization of net primary productivity in arid area of Northwest Chine—A case study of Jiuquan City. MSc Thesis. Lanzhou: Lanzhou University. (in Chinese)
|
|
|
| [57] |
Zhao X S. 2021. The characteristic of surface radiation and energy variation with usability of multi-sources data over the Gobi region in Xinjiang. MSc Thesis. Urumqi: Xinjiang University. (in Chinese)
|
|
|
|
Viewed |
|
|
|
Full text
|
|
|
|
|
Abstract
|
|
|
|
|
Cited |
|
|
|
|
| |
Shared |
|
|
|
|
| |
Discussed |
|
|
|
|