| Research article |
|

|
|
|
| A hybrid ConvLSTM-Nudging model for predicting surface soil moisture in the Qilian Mountains, China |
FAN Manhong*( ), XIAO Qian, YU Qinghe, ZHAO Junhao ), XIAO Qian, YU Qinghe, ZHAO Junhao |
| College of Physics and Electronic Engineering, Northwest Normal University, Lanzhou 730070, China |
|
|
|
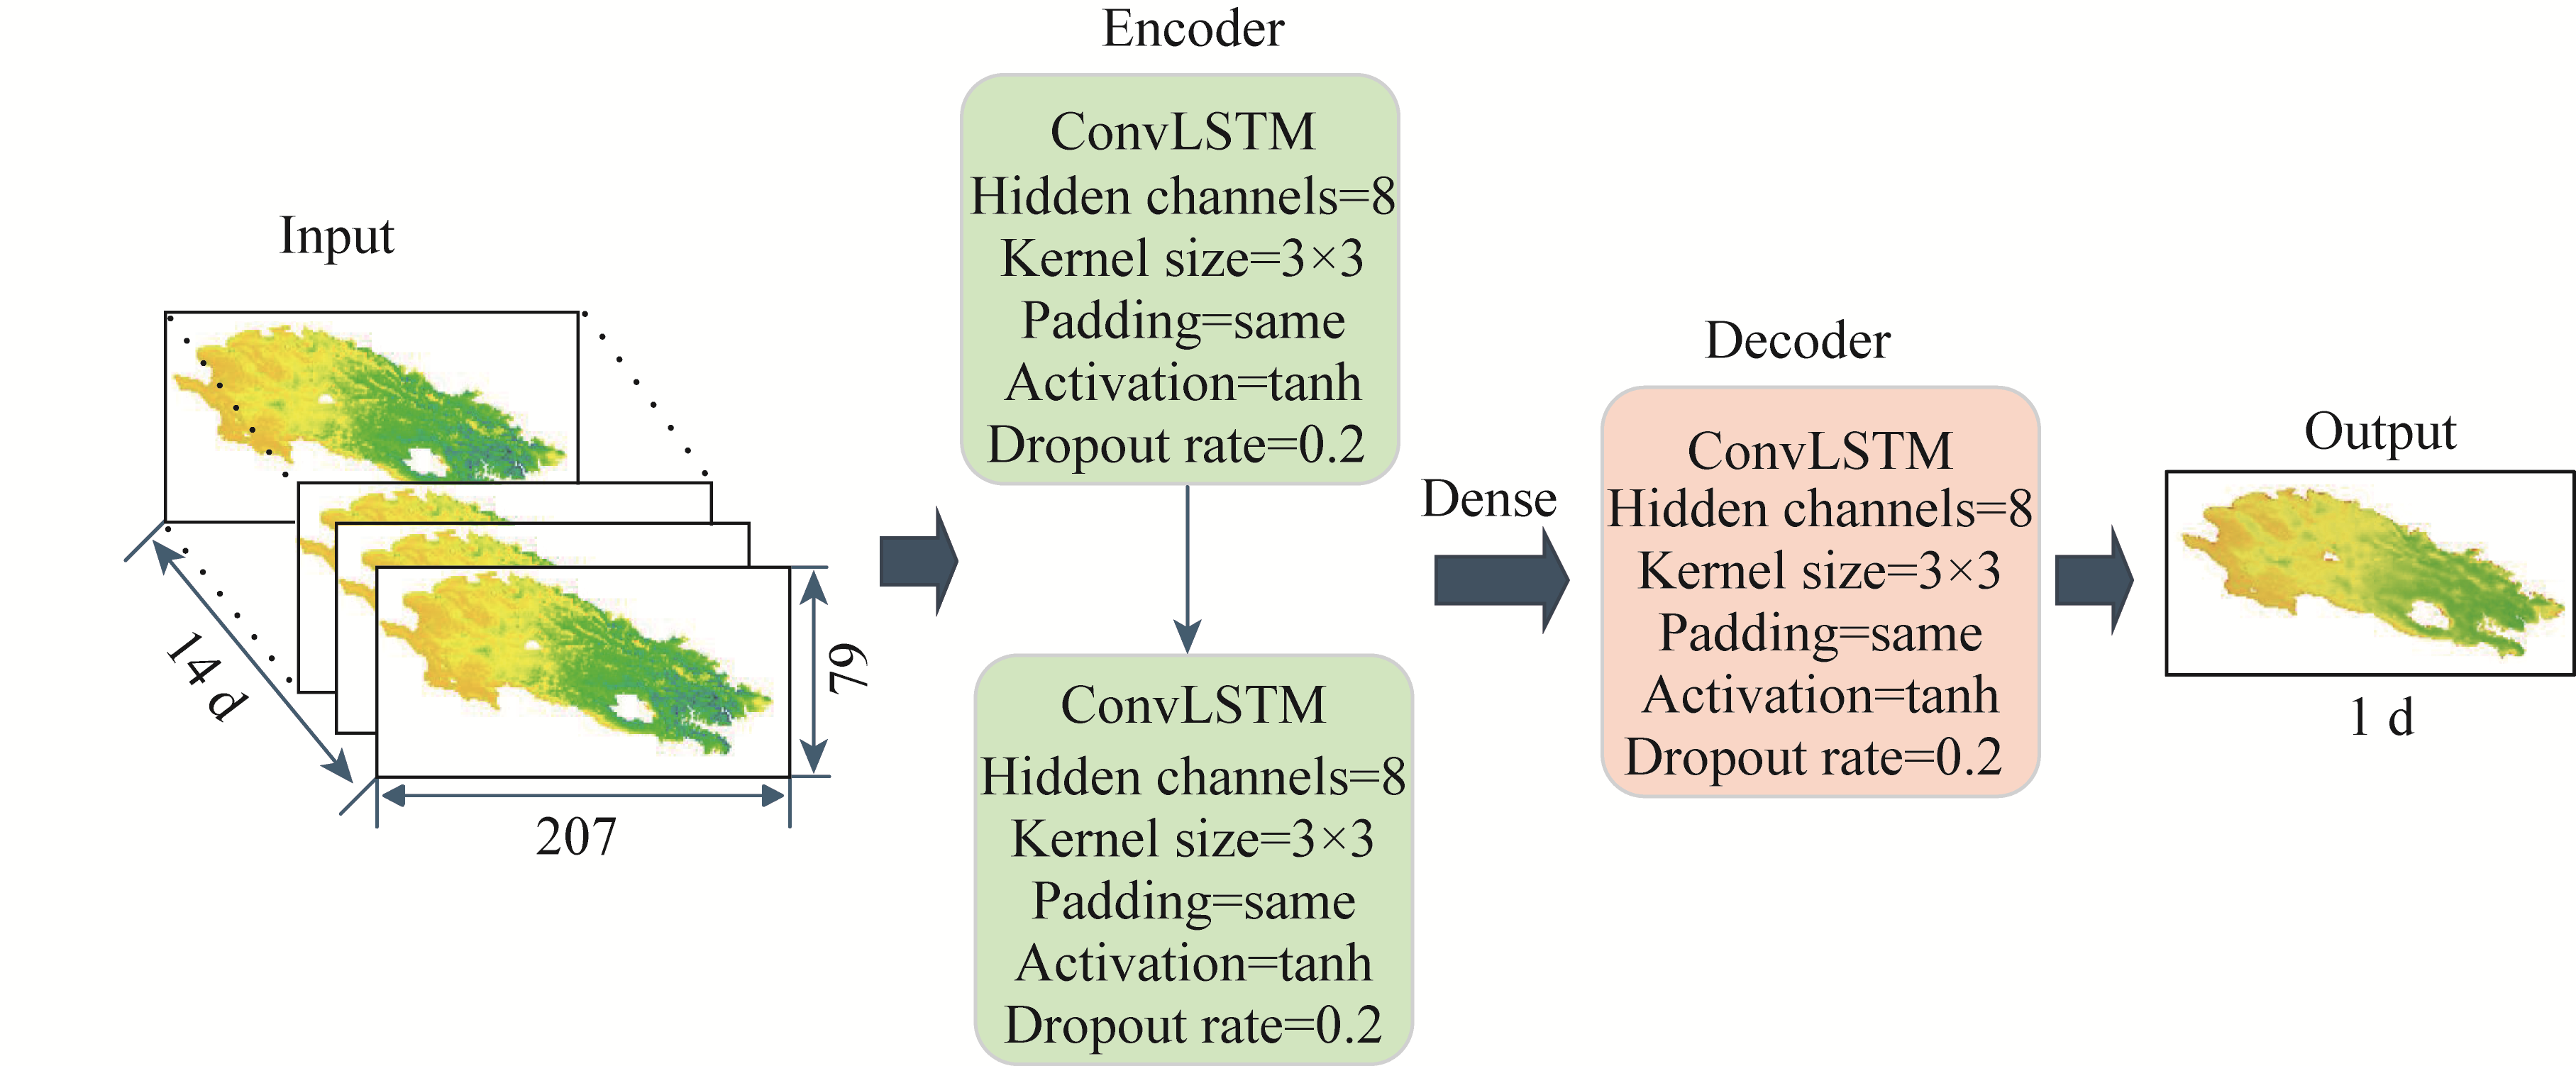
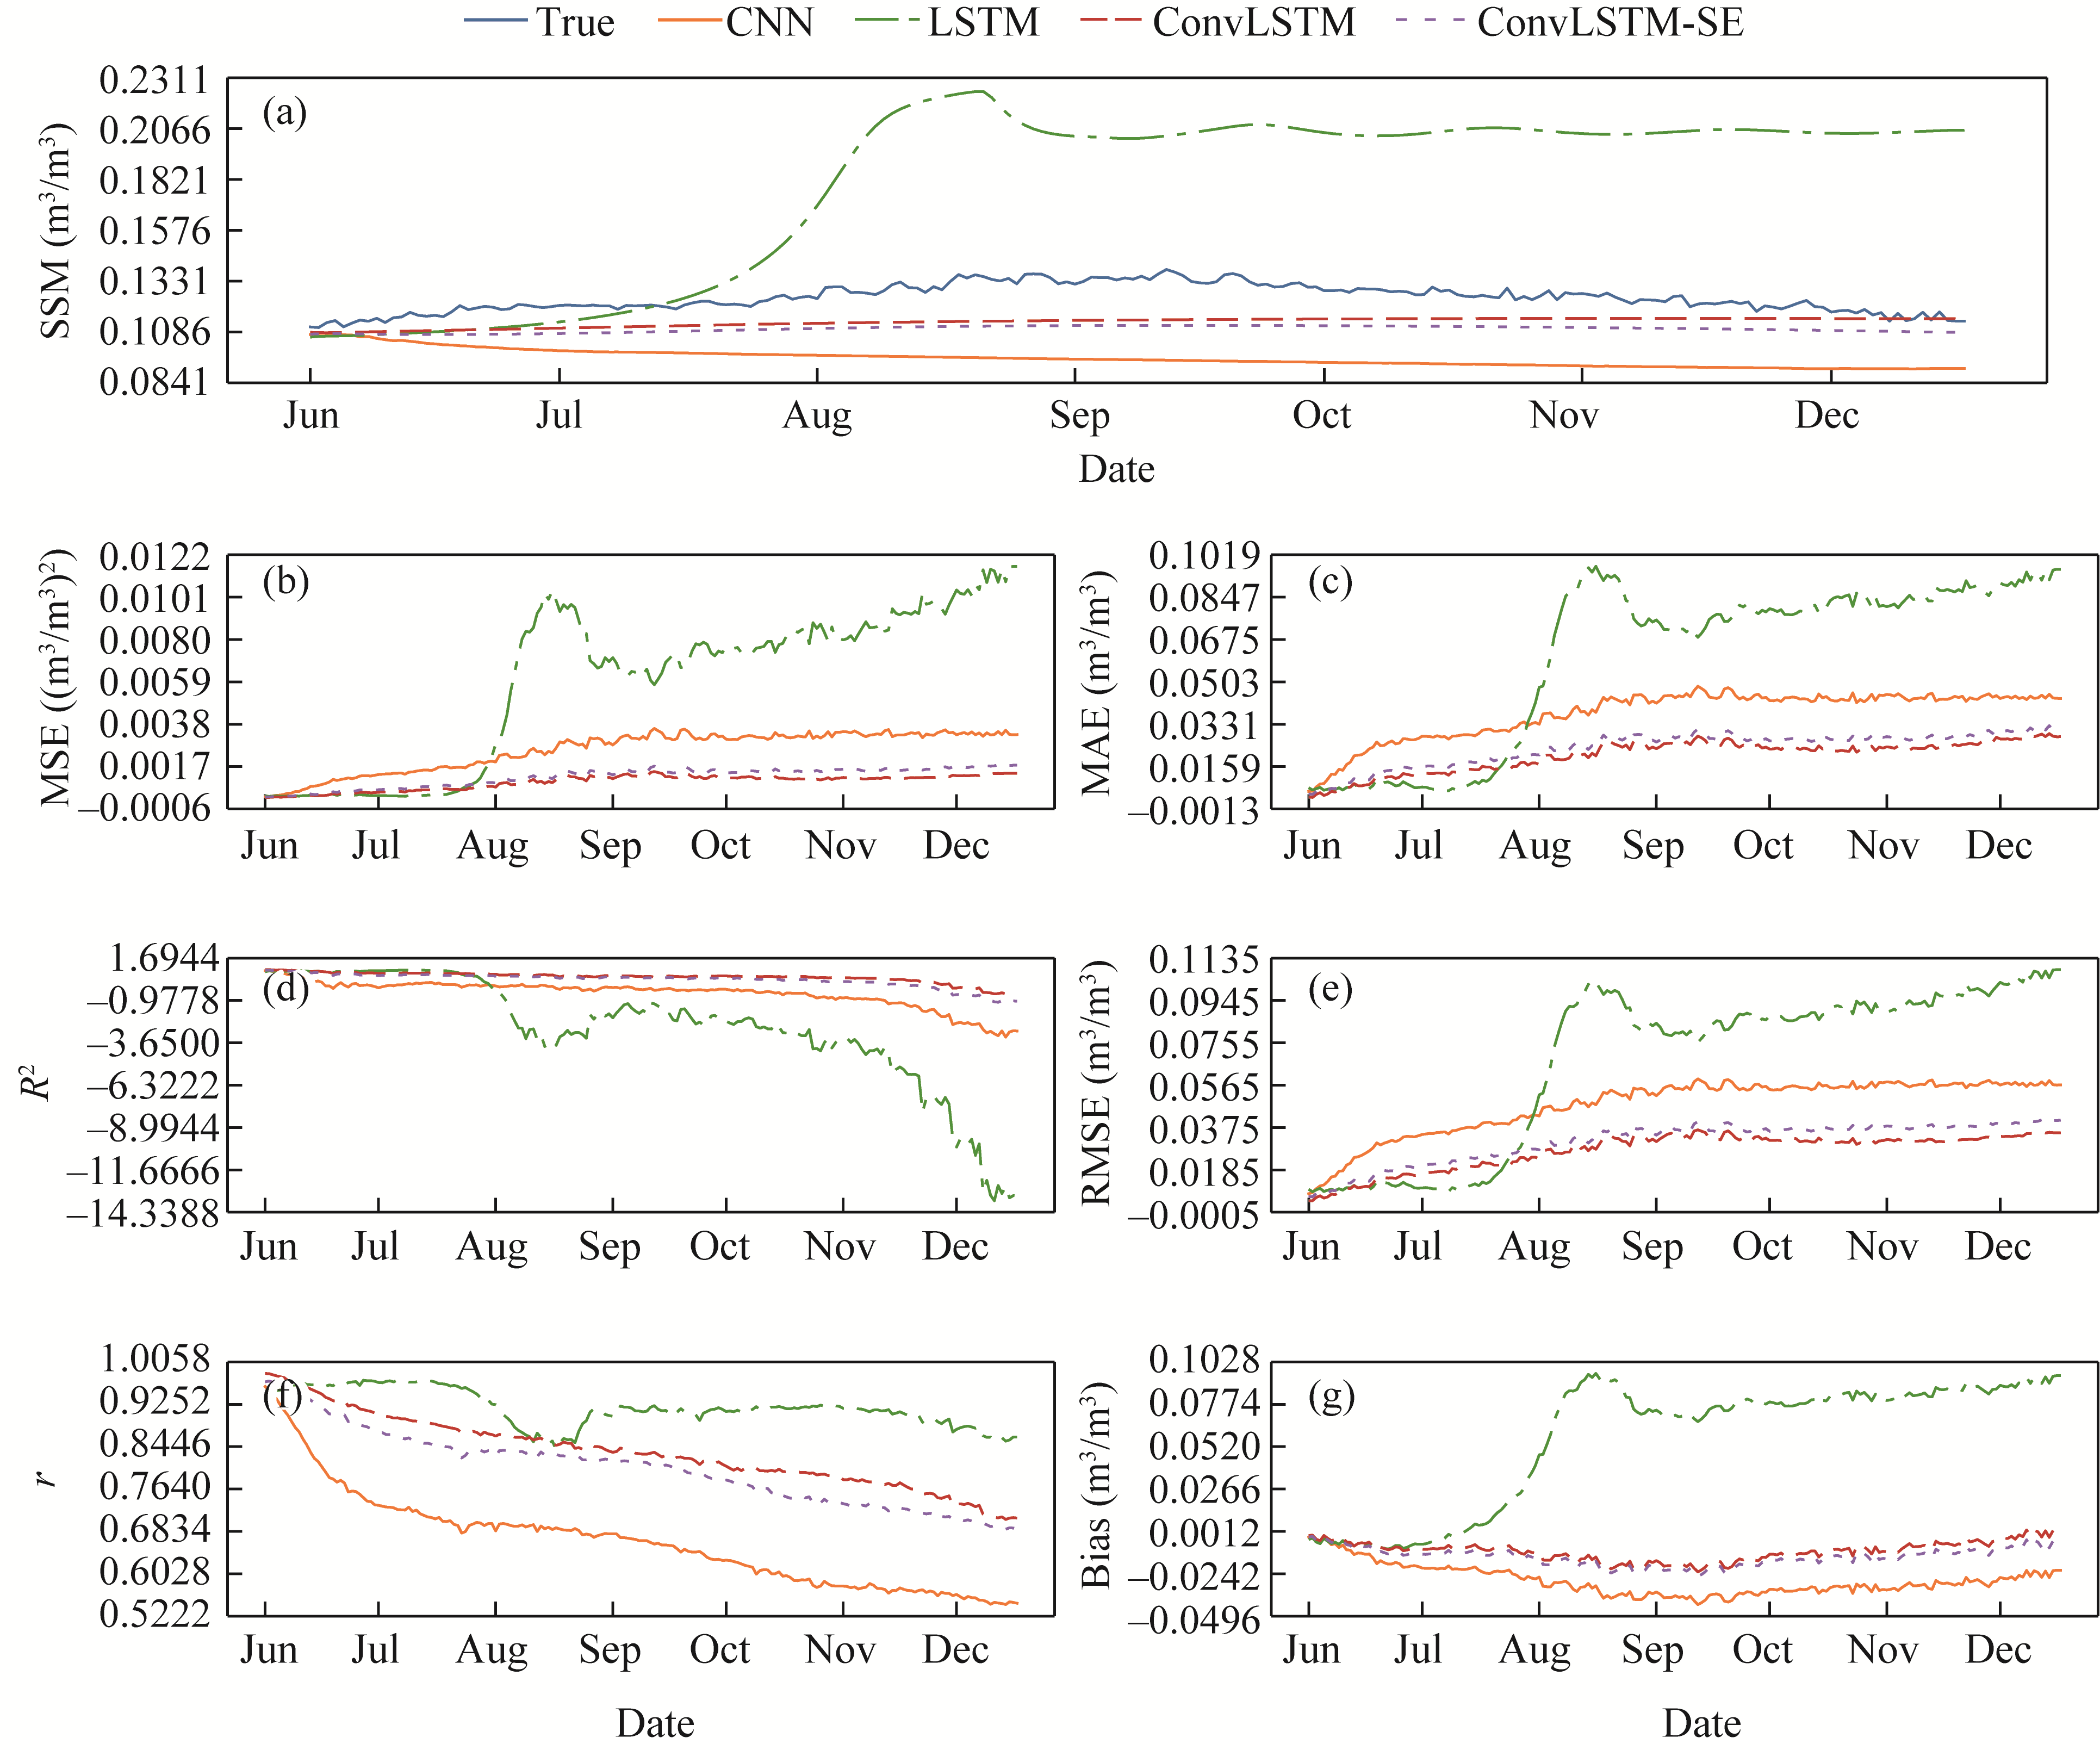
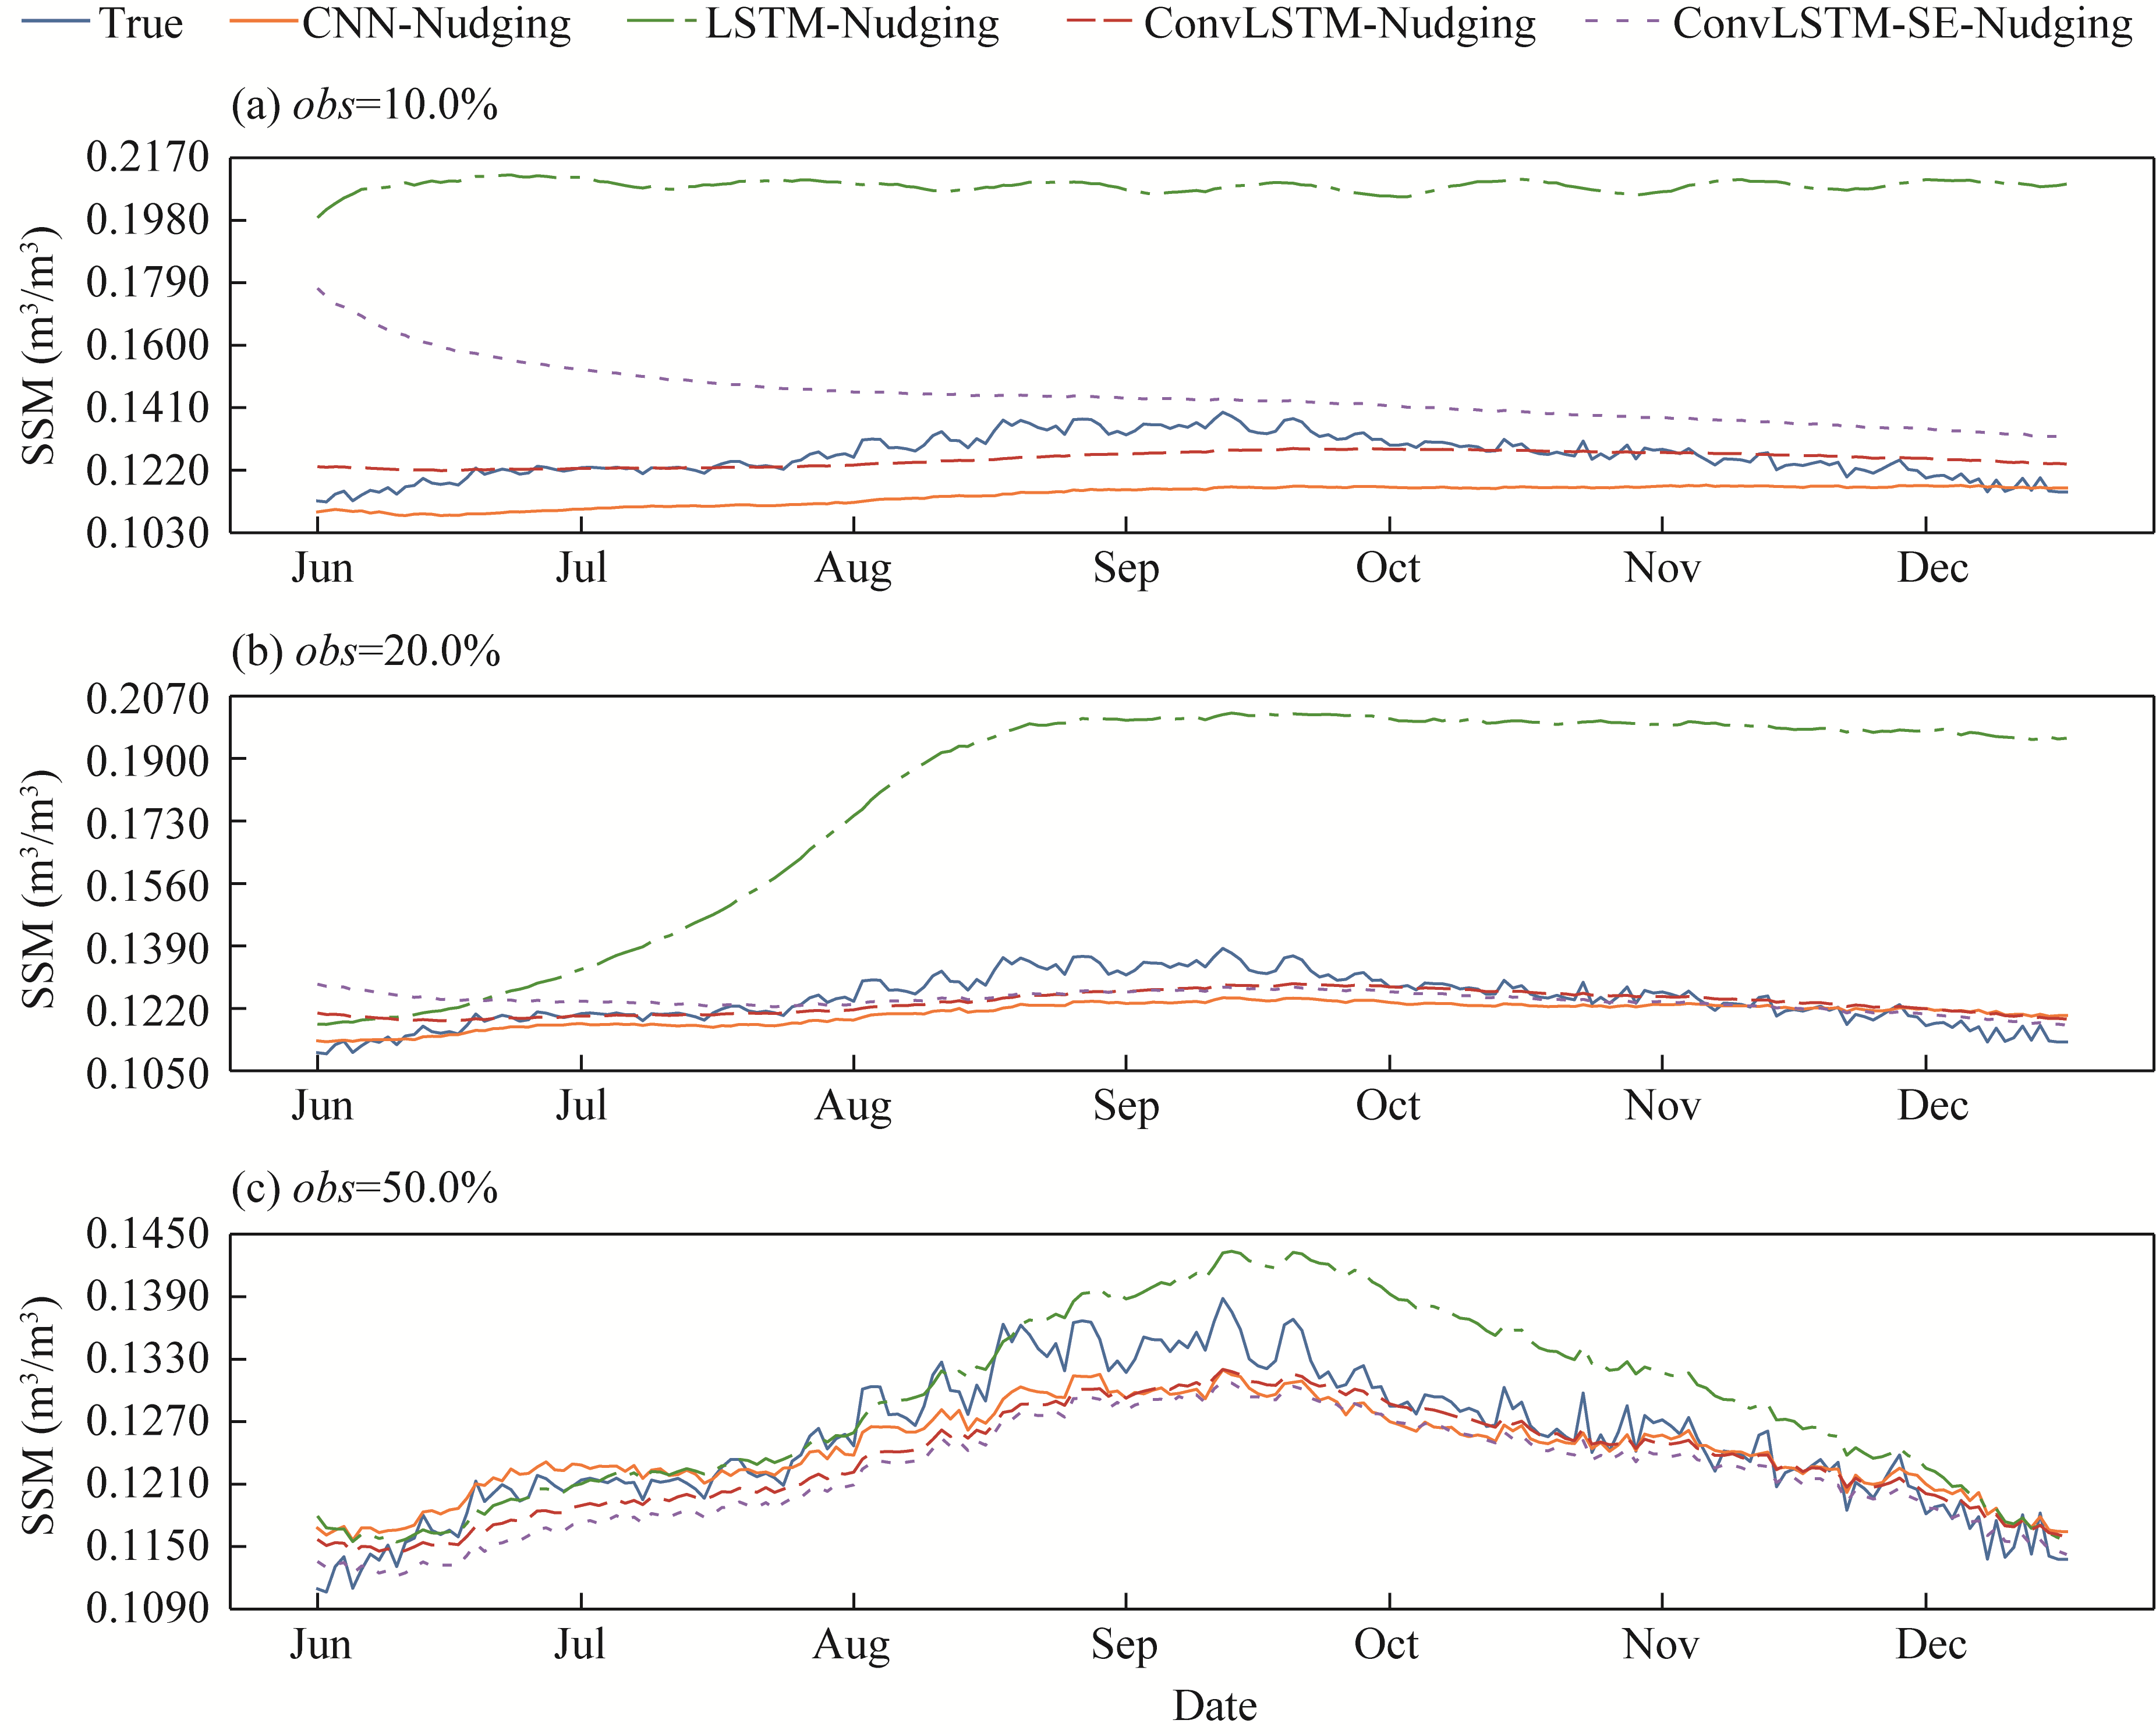
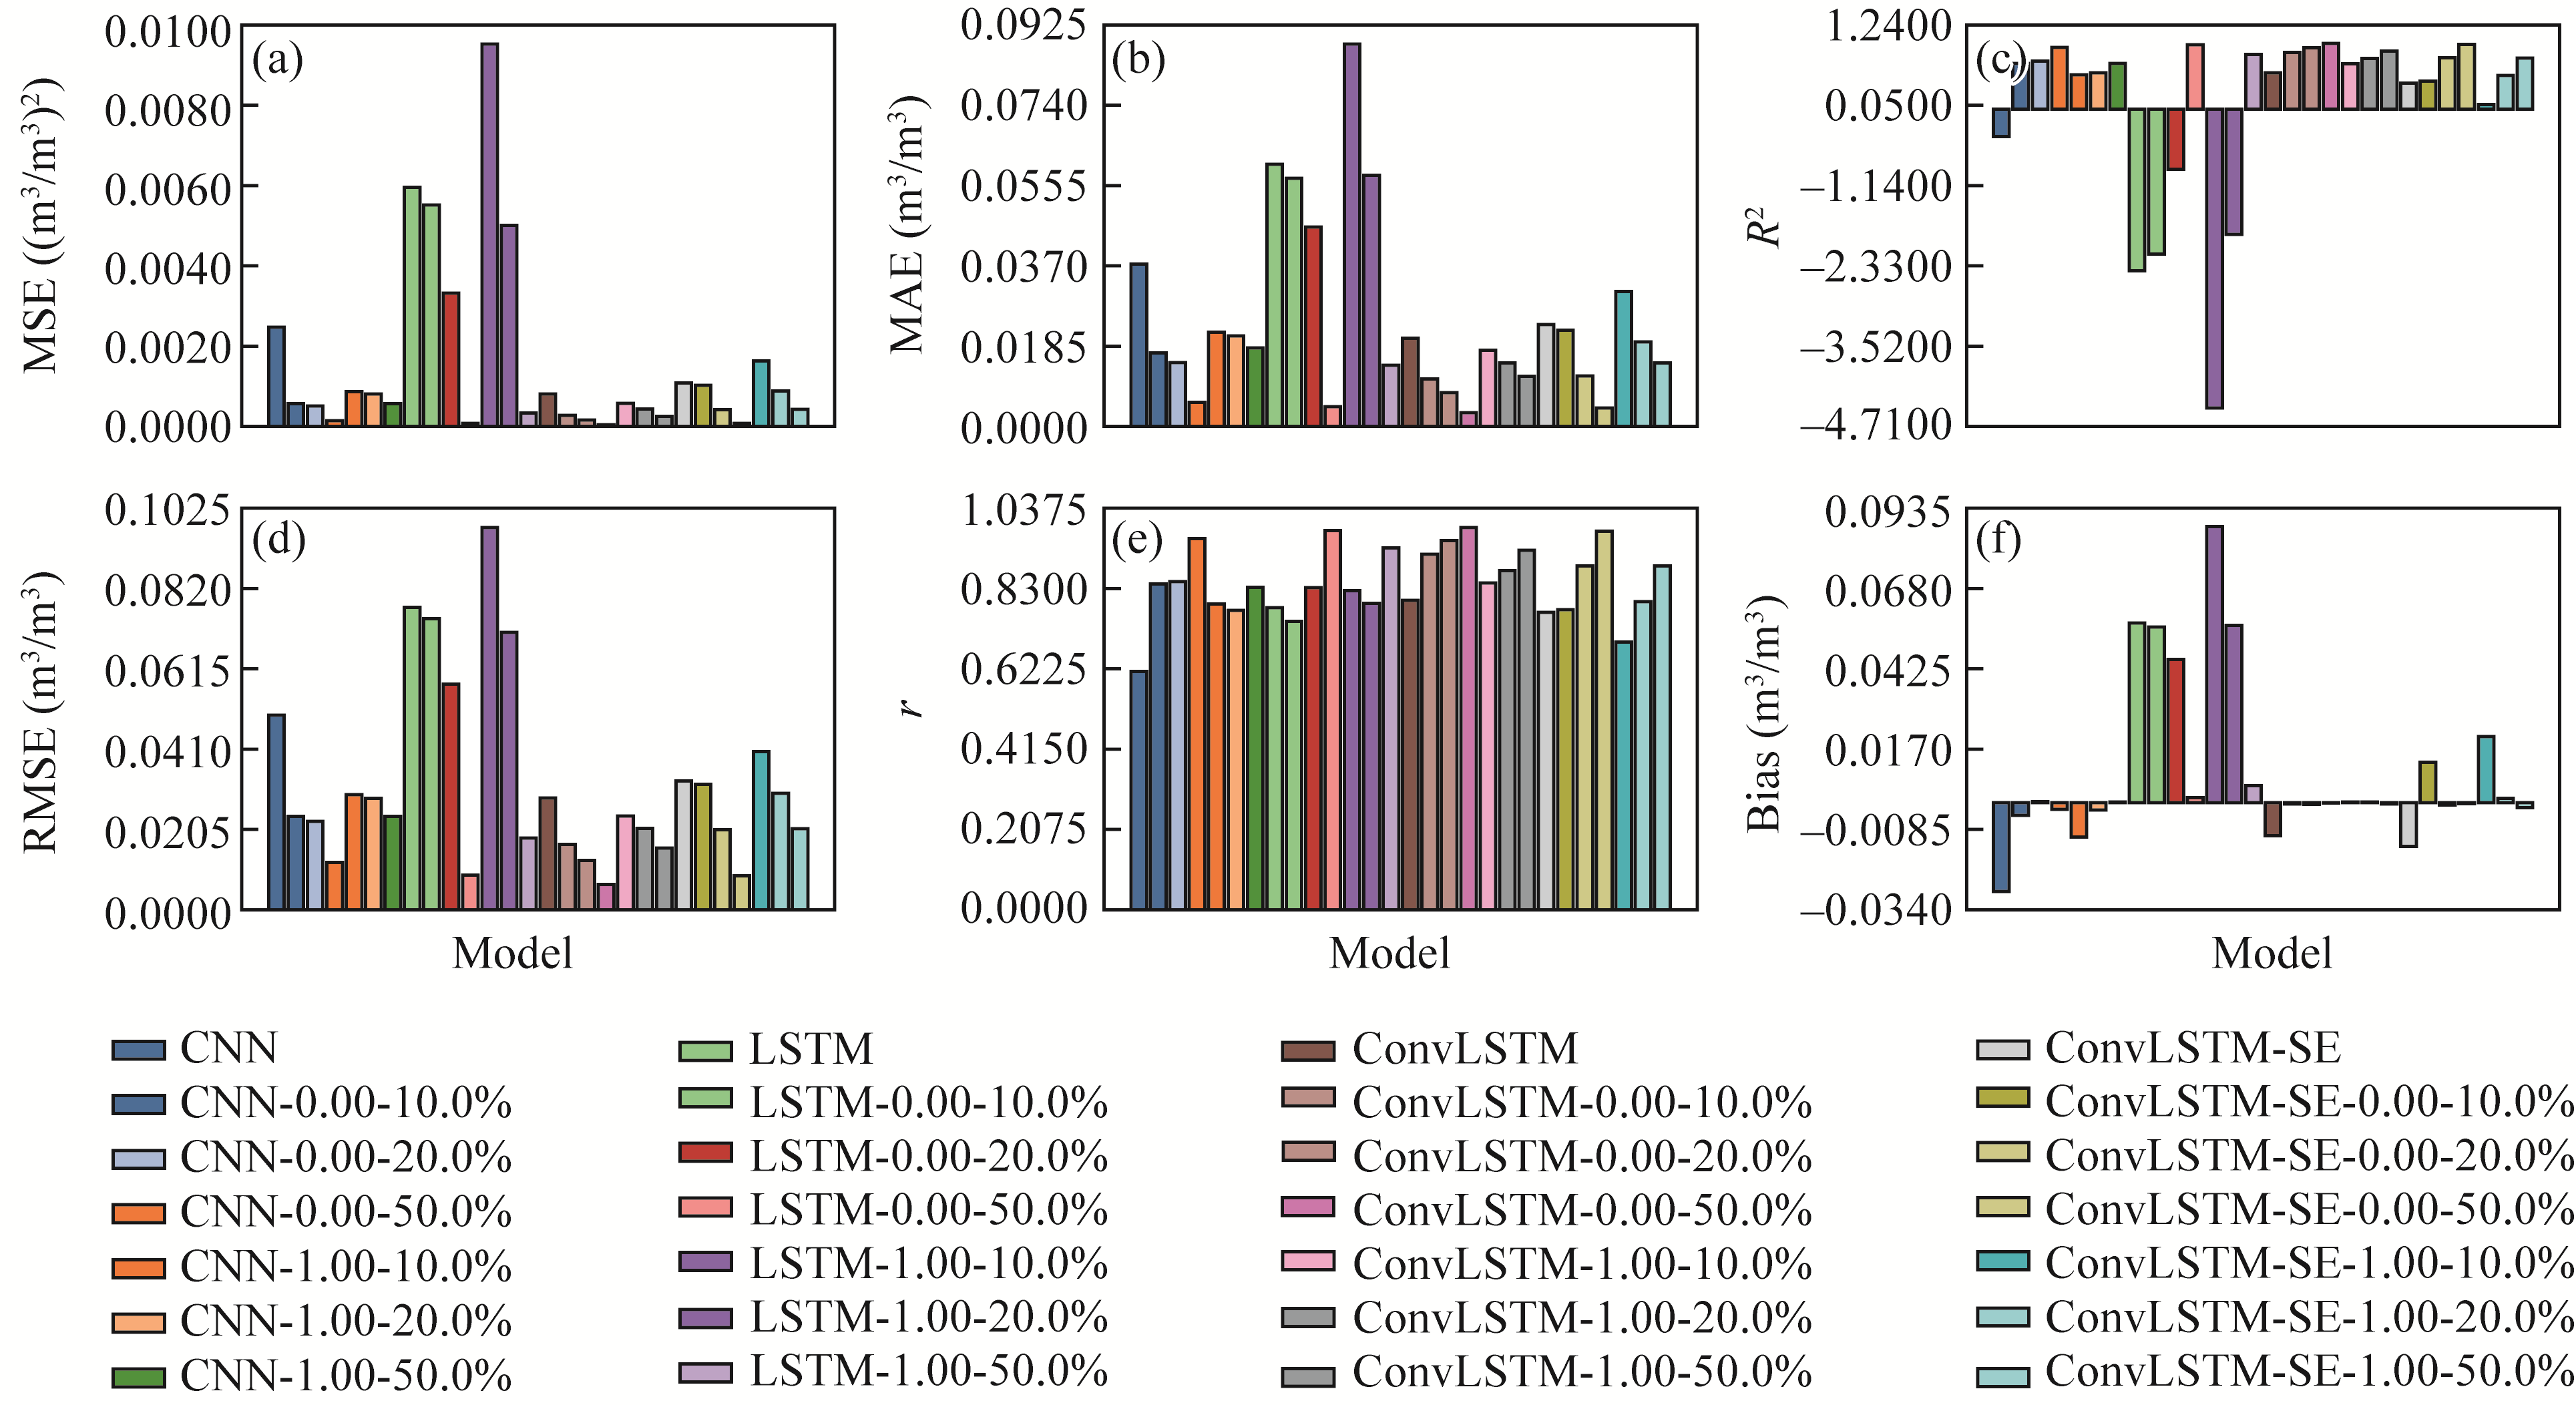
Abstract Spatiotemporal forecasting of surface soil moisture (SSM) is recognized as a critical scientific issue in precision agricultural irrigation, regional drought monitoring, and early warning systems for extreme precipitation. However, long-term forecasting continues to pose formidable challenges because of the complexity observed across both the spatial and temporal scales. In this study, we used a daily SSM dataset at a 0.05°×0.05° spatial resolution over the Qilian Mountains, China and proposed a hybrid Convolutional Long Short-Term Memory (ConvLSTM)-Nudging model, which combined deep neural networks with data assimilation to increase the accuracy of long-term SSM forecasting. We trained and evaluated the SSM predictive performance of four models (Convolutional Neural Network (CNN), Long Short-Term Memory (LSTM), ConvLSTM, and ConvLSTM with Squeeze-and-Excitation (SE) attention mechanism (ConvLSTM-SE)) in both short-term and long-term scenarios. The results showed that all the models perform well under short-term predictions, but the accuracy decrease substantially in long-term predictions. Therefore, we integrated Nudging technique during the long-term prediction phase to assimilate observational information and rectify model biases. Comprehensive evaluations demonstrate that Nudging significantly improves all the models, with ConvLSTM-Nudging achieving the best performance under the 200-d forecasting scenario. Relative to those of the best-performing ConvLSTM model for long-term forecasts, when observation noise δ=0.00 and observation fraction obs=50.0%, the coefficient of determination (R2) of ConvLSTM-Nudging increases by approximately 82.1%, while its mean absolute error (MAE) and root mean squared error (RMSE) decrease by approximately 84.8% and 77.3%, respectively; the average Pearson correlation coefficient (r) improves by approximately 23.6%, and Bias is reduced by 98.1%. These results demonstrated that although pure deep learning models achieve high accuracy in the short-term predictions, they are prone to error accumulation and systematic drift in long-term autoregressive predictions. Integrating data assimilation with deep learning and continuously correcting the state through observation can effectively suppress long-term biases, thereby achieving robust long-term SSM forecasting.
|
|
Received: 07 June 2025
Published: 30 November 2025
|
|
Corresponding Authors:
*FAN Manhong (E-mail: fanmanhong@nwnu.edu.cn)
|
|
|
| [1] |
Adewole A O, Eludoyin A O, Chirima G J, et al. 2024. Field-scale variability and dynamics of soil moisture in southwestern Nigeria. Discover Soil, 25(4): 1827-1847.
|
|
|
| [2] |
Anthes R A. 1974. Data assimilation and initialization of hurricane prediction models. Journal of Atmospheric Sciences, 31(3): 702-719.
doi: 10.1175/1520-0469(1974)031<0702:DAAIOH>2.0.CO;2
|
|
|
| [3] |
Antil H, Löhner R, Price R. 2024. Data assimilation with deep neural nets informed by Nudging. In: Rozza G, Stabile G, Gunzburger M, et al. Reduction, Approximation, Machine Learning, Surrogates, Emulators and Simulators: RAMSES. Cham: Springer Nature, 17-41.
|
|
|
| [4] |
Brigato L, Morand R, Strømmen K, et al. 2025. Position: There are no champions in long-term time series forecasting. [2025-01-22]. https://arxiv.org/pdf/2502.14045.
|
|
|
| [5] |
Carlson E, Farhat A, Martinez V R, et al. 2024. On the Infinite-Nudging Limit of the Nudging Filter for Continuous Data Assimilation. [2025-01-22]. https://arxiv.org/pdf/2408.02646.
|
|
|
| [6] |
Celik E, Olson E. 2023. Data assimilation using time-delay Nudging in the presence of gaussian noise. Journal of Nonlinear Science, 33: 110, doi: 10.1007/s00332-023-09967-1.
|
|
|
| [7] |
Chai L N, Zhu Z L, Liu S M. 2020. Daily 0.05×0.05 Land Surface Soil Moisture Dataset of Qilian Mountain Area (2018, SMHiRes, V1). National Tibetan Plateau Data Center. [2025-01-20]. https://doi.org/10.11888/Soil.tpdc.270408.
|
|
|
| [8] |
Charney J G, Fjörtoft R, Neumann J V. 1950. Numerical integration of the barotropic vorticity equation. Tellus, 2(4): 237-254.
|
|
|
| [9] |
Cheng S H, Engel B A, Liu R, et al. 2023. Impedance factor of hydraulic conductivity for frozen soil based on ice segregation theory and its application. Water Resources Research, 59(6): e2022WR033876, doi: 10.1029/2022WR033876.
|
|
|
| [10] |
Çıbık A, Fang R, Layton W, et al. 2025. Adaptive parameter selection in Nudging based data assimilation. Computer Methods in Applied Mechanics and Engineering, 433: 117526, doi: 10.1016/j.cma.2024.117526.
|
|
|
| [11] |
Cohen A, Davenport M A, Leviatan D. 2013. On the stability and accuracy of least squares approximations. Foundations of Computational Mathematics, 13(5): 819-834.
doi: 10.1007/s10208-013-9142-3
|
|
|
| [12] |
Connor J T, Martin R D, Atlas L E. 1994. Recurrent neural networks and robust time series prediction. IEEE Transactions on Neural Networks, 5(2): 240-254.
doi: 10.1109/72.279188
pmid: 18267794
|
|
|
| [13] |
Conti G, Aydoğdu A, Gualdi S, et al. 2022. On the physical nudging equations. Climate Dynamics, 58(5): 1459-1476.
doi: 10.1007/s00382-021-05972-w
|
|
|
| [14] |
Ding L, Bai Y, Fan M H, et al. 2024. Using a snow ablation optimizer in an autonomous echo state network for the model-free prediction of chaotic systems. Nonlinear Dynamics, 112(13): 11483-11500.
doi: 10.1007/s11071-024-09656-y
|
|
|
| [15] |
Ding L, Bai Y L, Zheng D H, et al. 2025. Chaotic climate system forecasting using an improved echo state network with sparse observations. Science China Earth Sciences, 68(7): 2346-2360.
doi: 10.1007/s11430-024-1593-9
|
|
|
| [16] |
Ek M B, Mitchell K E, Lin Y, et al. 2003. Implementation of Noah land surface model advances in the National Centers for Environmental Prediction operational mesoscale Eta model. Journal of Geophysical Research: Atmospheres, 108(D22): 8851, doi: 10.1029/2002JD003296.
|
|
|
| [17] |
Entin J K, Robock A, Vinnikov K Y, et al. 2000. Temporal and spatial scales of observed soil moisture variations in the extratropics. Journal of Geophysical Research: Atmospheres, 105(D9): 11865-11877.
doi: 10.1029/2000JD900051
|
|
|
| [18] |
Feng T, Ni J, Gleichgerrcht E, et al. 2025. SeizureFormer: A Transformer Model for IEA-Based Seizure Risk Forecasting. [2025-01-22]. https://arxiv.org/pdf/2504.16098v1.
|
|
|
| [19] |
Fu E, Zhang Y N, Yang F, et al. 2022. Temporal self-attention-based Conv-LSTM network for multivariate time series prediction. Neurocomputing, 501: 162-173.
doi: 10.1016/j.neucom.2022.06.014
|
|
|
| [20] |
Gamboa-Villafruela C J, Fernández-Alvarez J C, Márquez-Mijares M, et al. 2021. Convolutional LSTM Architecture for Precipitation Nowcasting Using Satellite Data. Environmental Sciences Proceedings, 8(1): 33, doi: 10.3390/ecas2021-10340.
|
|
|
| [21] |
Ge M Y, Gao W, Zhu M, et al. 2023. Sea ice classification of SAR images based on SE-ConvLSTM spatial-temporal feature fusion. Remote Sensing Technology and Application, 38(6): 1306-1316. (in Chinese)
|
|
|
| [22] |
Goux O, Weaver A T, Gürol S, et al. 2025. On the Impact of Observation Error Correlations in Data Assimilation, with Application to along-Track Altimeter Data. Quarterly Journal of the Royal Meteorological Society. [2025-01-12]. https://arxiv.org/pdf/2503.09140.
|
|
|
| [23] |
Gruber A, Lannoy G D, Crow W. 2019. A Monte Carlo based adaptive Kalman filtering framework for soil moisture data assimilation. Remote Sensing of Environment, 228(2019): 105-114.
doi: 10.1016/j.rse.2019.04.003
|
|
|
| [24] |
Habiboullah A, Louly M A. 2023. Soil moisture prediction using NDVI and NSMI satellite data: Vit-based models and ConvLSTM-based model. SN Computer Science, 4: 140, doi: 10.1007/s42979-022-01554-7.
|
|
|
| [25] |
Hochreiter S, Schmidhuber J. 1997. Long short-term memory. Neural Computation, 9(8): 1735-1780.
doi: 10.1162/neco.1997.9.8.1735
pmid: 9377276
|
|
|
| [26] |
Hu J, Shen L, Sun G. 2018. Squeeze-and-excitation networks. In: Proceedings of the IEEE/CVF Conference on Computer Vision and Pattern Recognition (CVPR). IEEE Computer Society/Computer Vision Foundation. Salt Lake City, USA, 7132-7141.
|
|
|
| [27] |
Hu Z X, Chai L N, Crow W T, et al. 2022. Applying a wavelet transform technique to optimize general fitting models for SM analysis: a case study in downscaling over the Qinghai-Tibet Plateau. Remote Sensing, 14(13): 3063, doi: 10.3390/rs14133063.
|
|
|
| [28] |
Huang F N, Zhang Y K, Zhang Y, et al. 2023. Interpreting Conv-LSTM for spatio-temporal soil moisture prediction in China. Agriculture, 13(5): 971, doi: 10.3390/agriculture13050971.
|
|
|
| [29] |
Jin X, Xie Y, Wei X S, et al. 2022. Delving deep into spatial pooling for squeeze-and-excitation networks. Pattern Recognition, 121(2022): 108159, doi: 10.1016/j.patcog.2021.108159.
|
|
|
| [30] |
Koster R D, Dirmeyer P A, Guo Z C, et al. 2004. Regions of strong coupling between soil moisture and precipitation. Science, 305(5687): 1138-1140.
pmid: 15326351
|
|
|
| [31] |
Kozhushko O, Boiko M, Kovbasa M Y, et al. 2022. Field scale computer modeling of soil moisture with dynamic Nudging assimilation algorithm. Mathematical Modeling and Computing, 9(2): 203-216.
doi: 10.23939/mmc
|
|
|
| [32] |
LeCun Y. 1989. Generalization and Network Design Strategies. [2025-01-18]. https://masters.donntu.ru/2012/fknt/umiarov/library/lecun.pdf.
|
|
|
| [33] |
Li L, Dai Y J, Wei Z W, et al. 2024a. Enhancing deep learning soil moisture forecasting models by integrating physics-based models. Advances in Atmospheric Sciences, 41(7): 1326-1341.
doi: 10.1007/s00376-023-3181-8
|
|
|
| [34] |
Li Q L, Li Z Y, Shangguan W, et al. 2022a. Improving soil moisture prediction using a novel encoder-decoder model with residual learning. Computers and Electronics in Agriculture, 195: 106816, doi: 10.1016/j.compag.2022.106816.
|
|
|
| [35] |
Li Q L, Zhu Y H, Shangguan W, et al. 2022b. An attention-aware LSTM model for soil moisture and soil temperature prediction. Geoderma, 409: 115651, doi: 10.1016/j.geoderma.2021.115651.
|
|
|
| [36] |
Li S L, Han Y, Li C X, et al. 2024b. A novel framework for multi-layer soil moisture estimation with high spatio-temporal resolution based on data fusion and automated machine learning. Agricultural Water Management, 306: 109173, doi: 10.1016/j.agwat.2024.109173.
|
|
|
| [37] |
Liang D J, Zhang H X, Yuan D F, et al. 2023. Does Long-Term Series Forecasting Need Complex Attention and Extra Long Inputs? [2025-01-22]. https://arxiv.org/pdf/2306.05035.
|
|
|
| [38] |
Lin P F, He Z B, Du J, et al. 2017. Recent changes in daily climate extremes in an arid mountain region, a case study in northwestern China's Qilian Mountains. Scientific Reports, 7(1): 2245, doi: 10.1038/s41598-017-02345-4.
pmid: 28533540
|
|
|
| [39] |
Liu L Y, Gou X H, Wang X J, et al. 2024. Relationship between extreme climate and vegetation in arid and semi-arid mountains in China: A case study of the Qilian Mountains. Agricultural and Forest Meteorology, 348: 109938, doi: 10.1016/j.agrformet.2024.109938.
|
|
|
| [40] |
Lü X B, Nurmemet I, Xiao S T, et al. 2024. Spatial-temporal simulation and prediction of root zone soil moisture based on Hydrus-1D and CNN-LSTM-attention models in the Yutian Oasis, southern Xinjiang, China. Pedosphere, 35(5): 846-857.
doi: 10.1016/j.pedsph.2024.10.008
|
|
|
| [41] |
Margulis S A, McLaughlin D, Entekhabi D, et al. 2002. Land data assimilation and estimation of soil moisture using measurements from the Southern Great Plains 1997 Field Experiment. Water Resources Research, 38(12): 1299, doi: 10.1029/2001WR001114.
|
|
|
| [42] |
Meng X J, Mao K B, Meng F, et al. 2021. A fine-resolution soil moisture dataset for China in 2002-2018. Earth System Science Data, 13(7): 3239-3261.
doi: 10.5194/essd-13-3239-2021
|
|
|
| [43] |
Menut L, Bessagnet B, Cholakian A, et al. 2024. What is the relative impact of nudging and online coupling on meteorological variables, pollutant concentrations and aerosol optical properties? Geoscientific Model Development, 17(9): 3645-3665.
doi: 10.5194/gmd-17-3645-2024
|
|
|
| [44] |
Mikolov T, Kombrink S, Burget L, et al. 2011. Extensions of recurrent neural network language model. In: 2011 IEEE International Conference on Acoustics, Speech and Signal Processing (ICASSP). IEEE Signal Processing Society. Prague, Czech Republic, 5528-5531.
|
|
|
| [45] |
Niu J Q, Liu Z J, Chen F Y, et al. 2025. Variations of soil moisture and its influencing factors in arid and semi-arid areas, China. Journal of Arid Land, 17(5): 624-643.
doi: 10.1007/s40333-025-0014-x
|
|
|
| [46] |
Pawar S, Ahmed S E, San O, et al. 2020. Long short-term memory embedded nudging schemes for nonlinear data assimilation of geophysical flows. Physics of Fluids, 32(7): 076606, doi: 10.1063/5.0012853.
|
|
|
| [47] |
Qu Y Q, Zhu Z L, Chai L N, et al. 2019. Rebuilding a microwave soil moisture product using random forest adopting AMSR-E/AMSR2 brightness temperature and SMAP over the Qinghai-Tibet Plateau, China. Remote Sensing, 11(6): 683, doi: 10.3390/rs11060683.
|
|
|
| [48] |
Qu Y Q, Zhu Z L, Montzka C, et al. 2021. Inter-comparison of several soil moisture downscaling methods over the Qinghai-Tibet Plateau, China. Journal of Hydrology, 592: 125616, doi: 10.1016/j.jhydrol.2020.125616.
|
|
|
| [49] |
Richards L A. 1931. Capillary conduction of liquids through porous mediums. Physics, 1(5): 318-333.
doi: 10.1063/1.1745010
|
|
|
| [50] |
Shi X J, Chen Z R, Wang H, et al. 2015. Convolutional LSTM Network: A Machine Learning Approach for Precipitation Forecasting. [2025-01-22]. https://arxiv.org/pdf/1506.04214.
|
|
|
| [51] |
Šimůnek J, van Genuchten M T, Šejna M. 2008. Development and applications of the HYDRUS and STANMOD software packages and related codes. Vadose Zone Journal, 7(2): 587-600.
doi: 10.2136/vzj2007.0077
|
|
|
| [52] |
Song X Y, Liu Y T, Xue L, et al. 2020. Time-series well performance prediction based on Long Short-Term Memory (LSTM) neural network model. Journal of Petroleum Science and Engineering, 186: 106682, doi: 10.1016/j.petrol.2019.106682.
|
|
|
| [53] |
Stauffer D R, Seaman N L. 1990. Use of four-dimensional data assimilation in a limited-area mesoscale model. Part I: experiments with synoptic-scale data. Monthly Weather Review, 118(6): 1250-1277.
doi: 10.1175/1520-0493(1990)118<1250:UOFDDA>2.0.CO;2
|
|
|
| [54] |
van Dam J C, Groenendijk P, Hendriks R F A, et al. 2008. Advances of modeling water flow in variably saturated soils with SWAP. Vadose Zone Journal, 7(2): 640-653.
doi: 10.2136/vzj2007.0060
|
|
|
| [55] |
Vereecken H, Huisman J A, Bogena H, et al. 2008. On the value of soil moisture measurements in vadose zone hydrology: A review. Water Resources Research, 44(4): W00D06, doi: 10.1029/2008WR006829.
|
|
|
| [56] |
Wang C J, Liu Q M, Yin C S, et al. 2023. Simulation of soil moisture based on ensemble Kalman filter assimilation method and HYDRUS-1D model. Agricultural Research in the Arid Areas, 41(2): 141-149. (in Chinese)
|
|
|
| [57] |
Wang Y K, Shi L S, Lin L, et al. 2020. A robust data-worth analysis framework for soil moisture flow by hybridizing sequential data assimilation and machine learning. Vadose Zone Journal, 19(1): e20026, doi: 10.1002/vzj2.20026.
|
|
|
| [58] |
Wang Y L, Shi L S, Hu Y A, et al. 2024. A comprehensive study of deep learning for soil moisture prediction. Hydrology and Earth System Sciences, 28(4): 917-943.
doi: 10.5194/hess-28-917-2024
|
|
|
| [59] |
Xu L, Abbaszadeh P, Moradkhani H, et al. 2020. Continental drought monitoring using satellite soil moisture, data assimilation and an integrated drought index. Remote Sensing of Environment, 250: 112028, doi: 10.1016/j.rse.2020.112028.
|
|
|
| [60] |
Xu L, Chen N C, Chen Z Q, et al. 2021a. Spatiotemporal forecasting in earth system science: Methods, uncertainties, predictability and future directions. Earth-Science Reviews, 222: 103828, doi: 10.1016/j.earscirev.2021.103828.
|
|
|
| [61] |
Xu L, Chen N C, Zhang X, et al. 2021b. In-situ and triple-collocation based evaluations of eight global root zone soil moisture products. Remote Sensing of Environment, 254: 112248, doi: 10.1016/j.rse.2020.112248.
|
|
|
| [62] |
Yu J X, Zhang X, Xu L L, et al. 2021. A hybrid CNN-GRU model for predicting soil moisture in maize root zone. Agricultural Water Management, 245: 106649, doi: 10.1016/j.agwat.2020.106649.
|
|
|
| [63] |
Zhang J T, Zhang C Q, Feng Q. 2020. Digital Elevation Model (DEM) Data with the Spatial Resolution of 30 m in the Qilian Mountains. National Cryosphere Desert Data Center. [2025-01-12]. https://doi.org/10.12072/ncdc.qlsst.db0007.2020.
|
|
|
| [64] |
Zhang S Y, Deng Y S, Niu Q R, et al. 2023. Multivariate temporal self-attention network for subsurface thermohaline structure reconstruction. IEEE Transactions on Geoscience and Remote Sensing, 61: 4507116, doi: 10.1109/TGRS.2023.3320350.
|
|
|
| [65] |
Zhou X R, Li Y. 2022. Response of dry-wet change to millennial and centennial warm periods in the Qilian Mountains. Acta Geographica Sinica, 77(5): 1138-1152. (in Chinese)
doi: 10.11821/dlxb202205007
|
|
|
| [66] |
Zhu P H, Shi L S, Zhu Y, et al. 2017. Data assimilation of soil water flow via ensemble Kalman filter: Infusing soil moisture data at different scales. Journal of Hydrology, 555(2017): 912-925.
doi: 10.1016/j.jhydrol.2017.10.078
|
|
|
|
Viewed |
|
|
|
Full text
|
|
|
|
|
Abstract
|
|
|
|
|
Cited |
|
|
|
|
| |
Shared |
|
|
|
|
| |
Discussed |
|
|
|
|