Please wait a minute...
Journal of Arid Land  2026, Vol. 18 Issue (1): 101-130    DOI: 10.1016/j.jaridl.2026.01.008     CSTR: 32276.14.JAL.20250402
Research article     
Quantifying the impact of dust retention on maize canopy spectral reflectance and vegetation indices in dust belt regions: A case study in southern Xinjiang, China
MA Baodong*(), GAO Shuxian, KANG Ting, CHE Defu, SHU Yang
School of Resources and Civil Engineering, Northeastern University, Shenyang 110819, China
Download: HTML     PDF(4209KB)
Export: BibTeX | EndNote (RIS)      

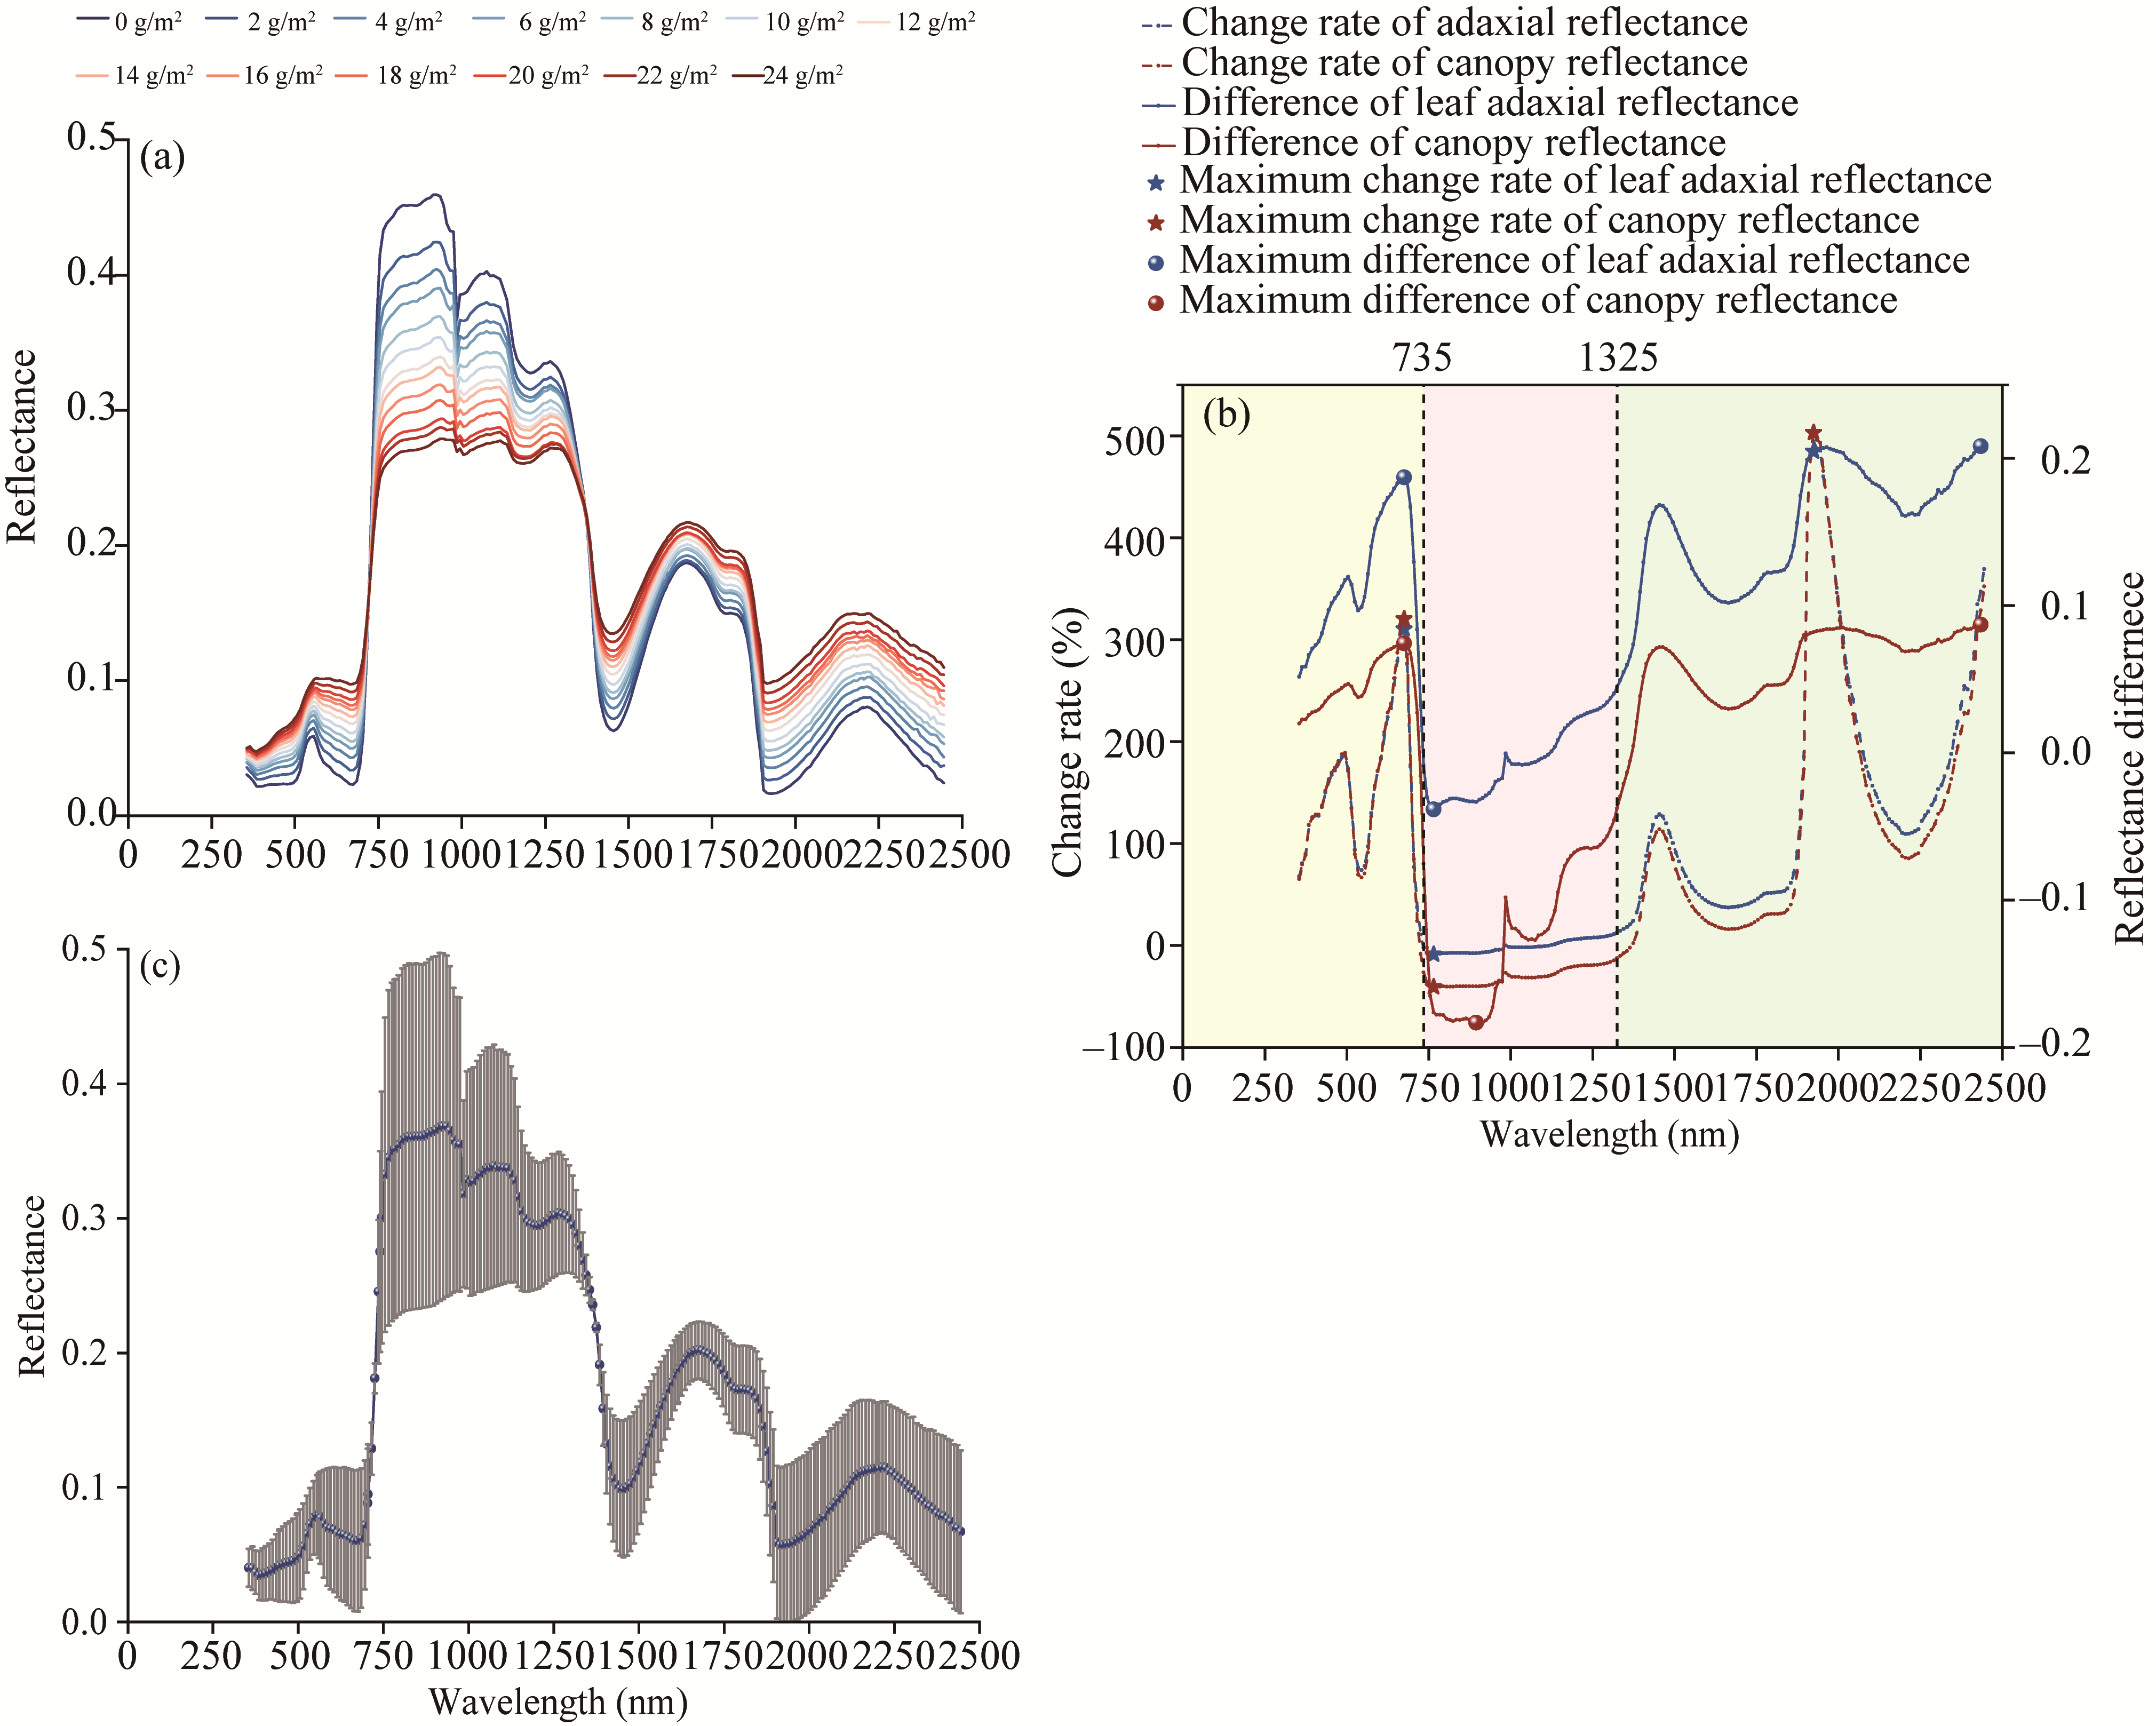
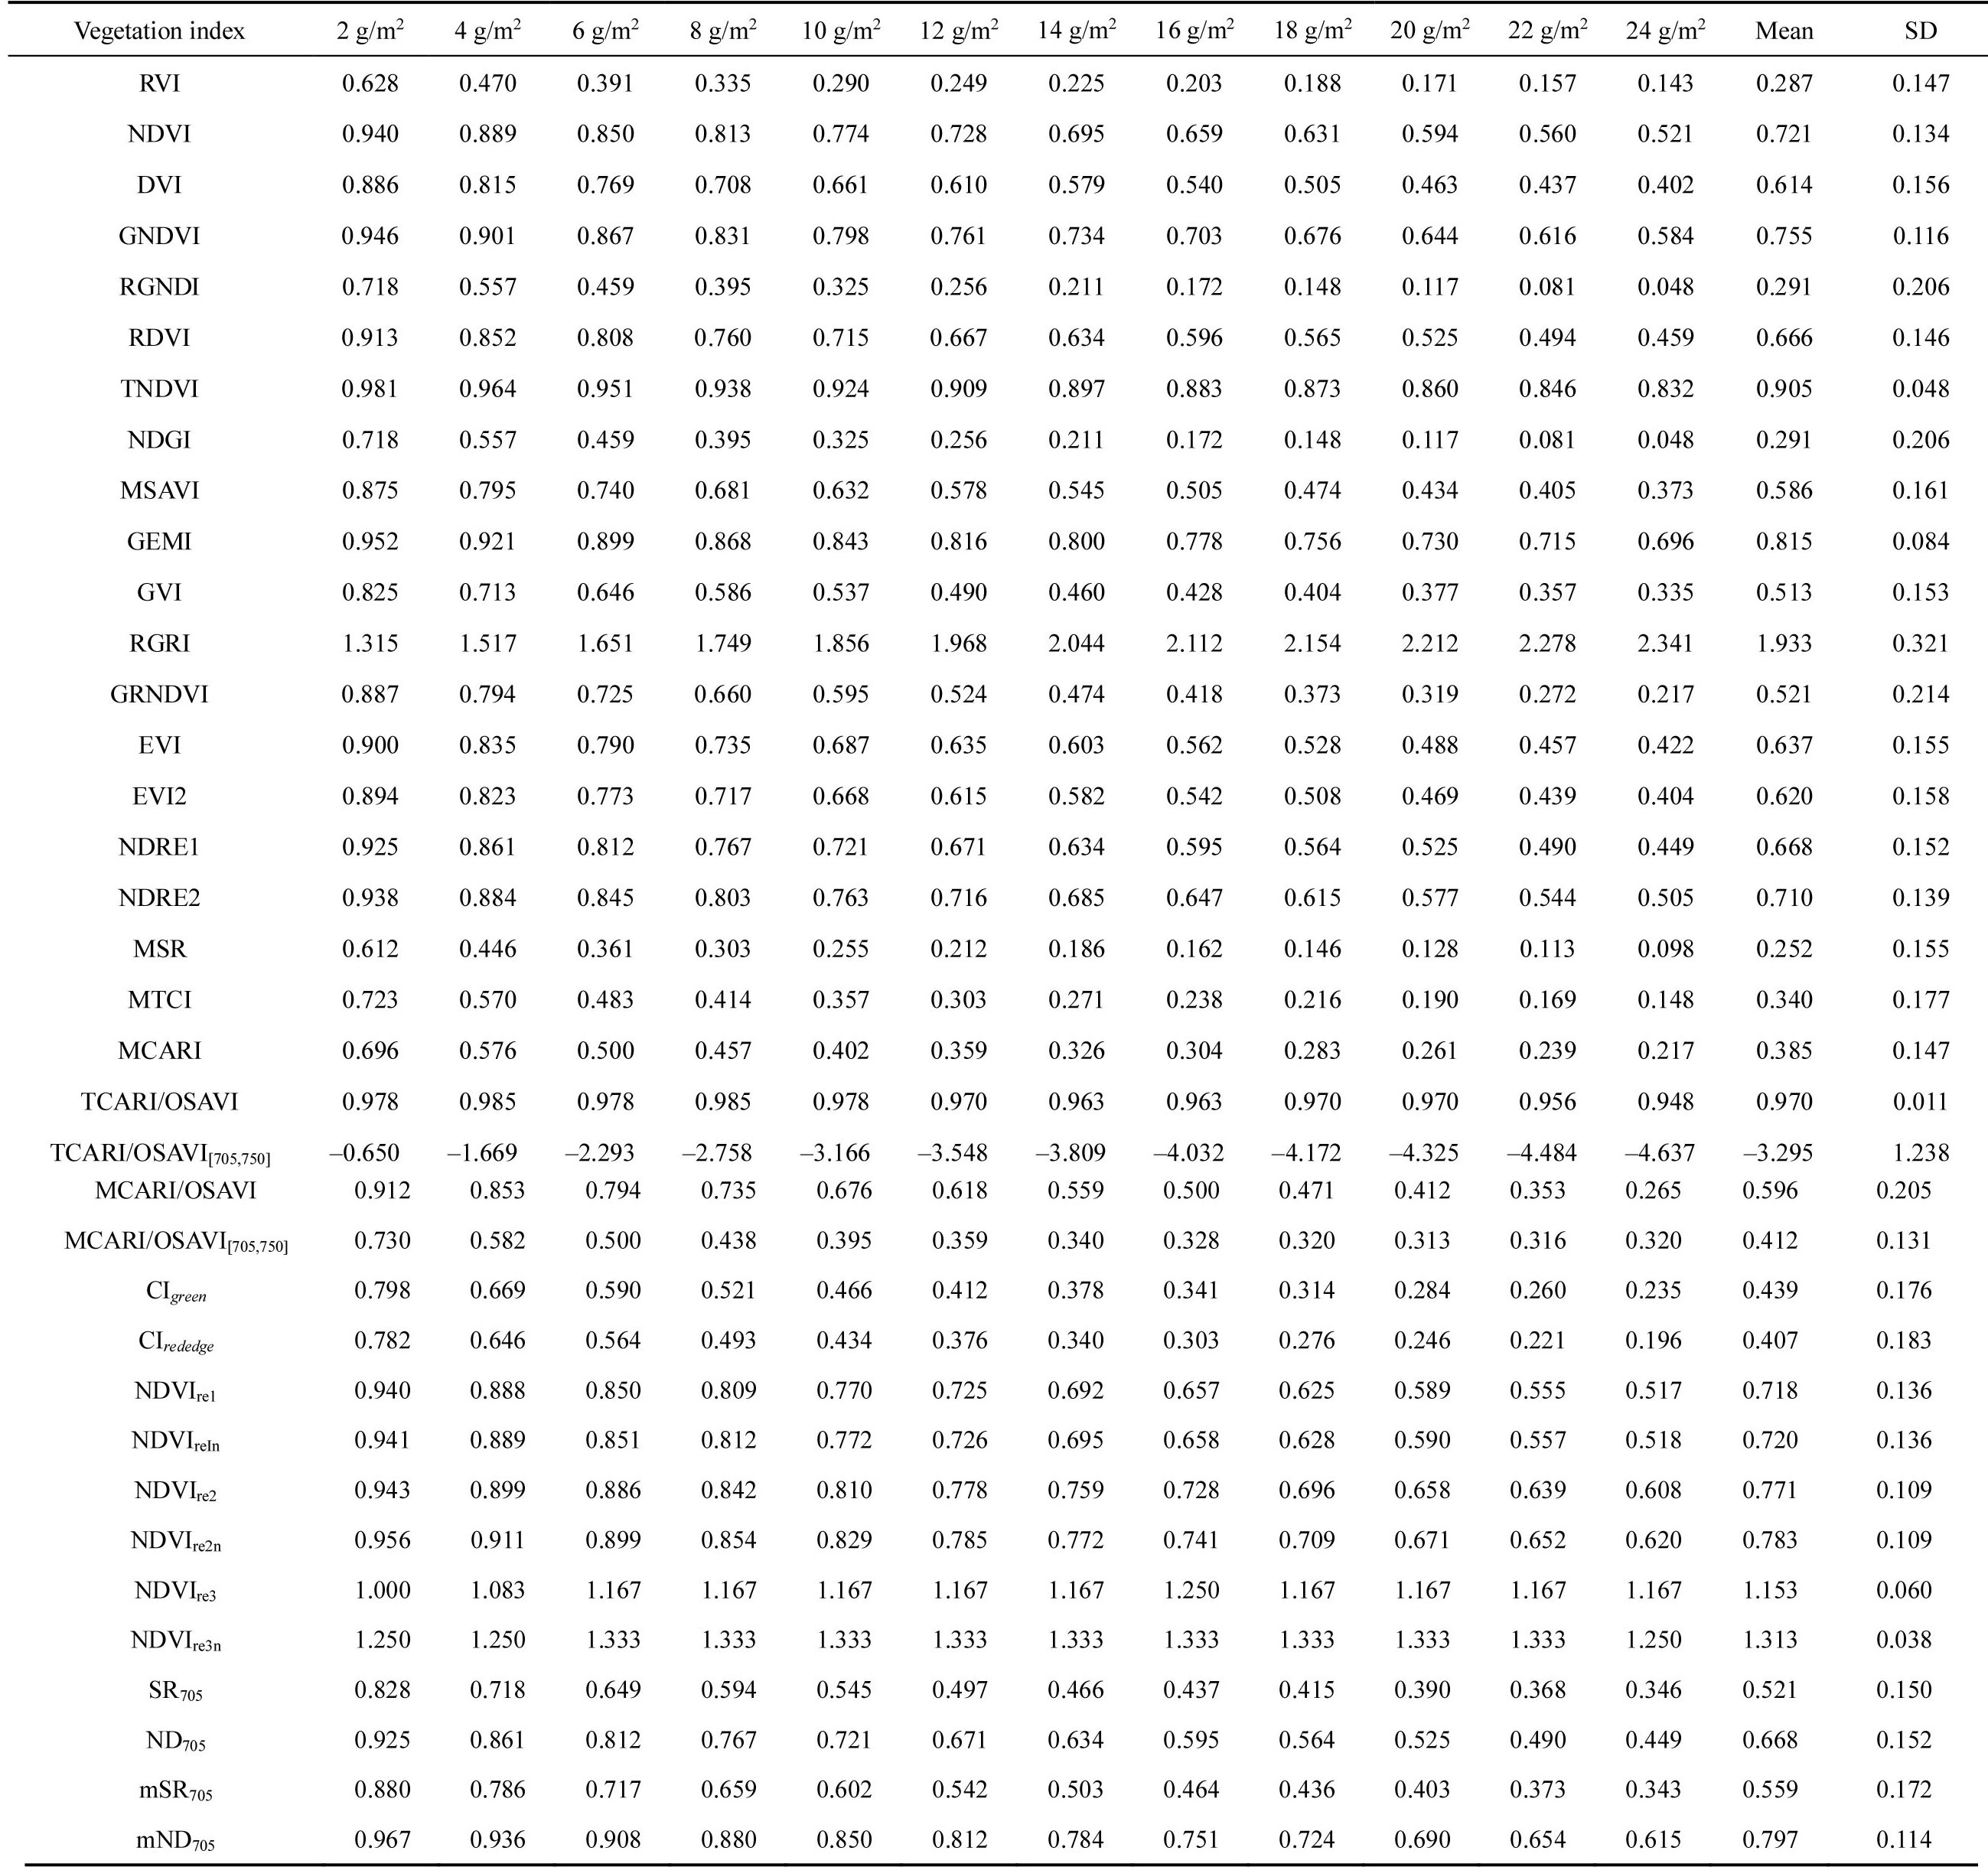
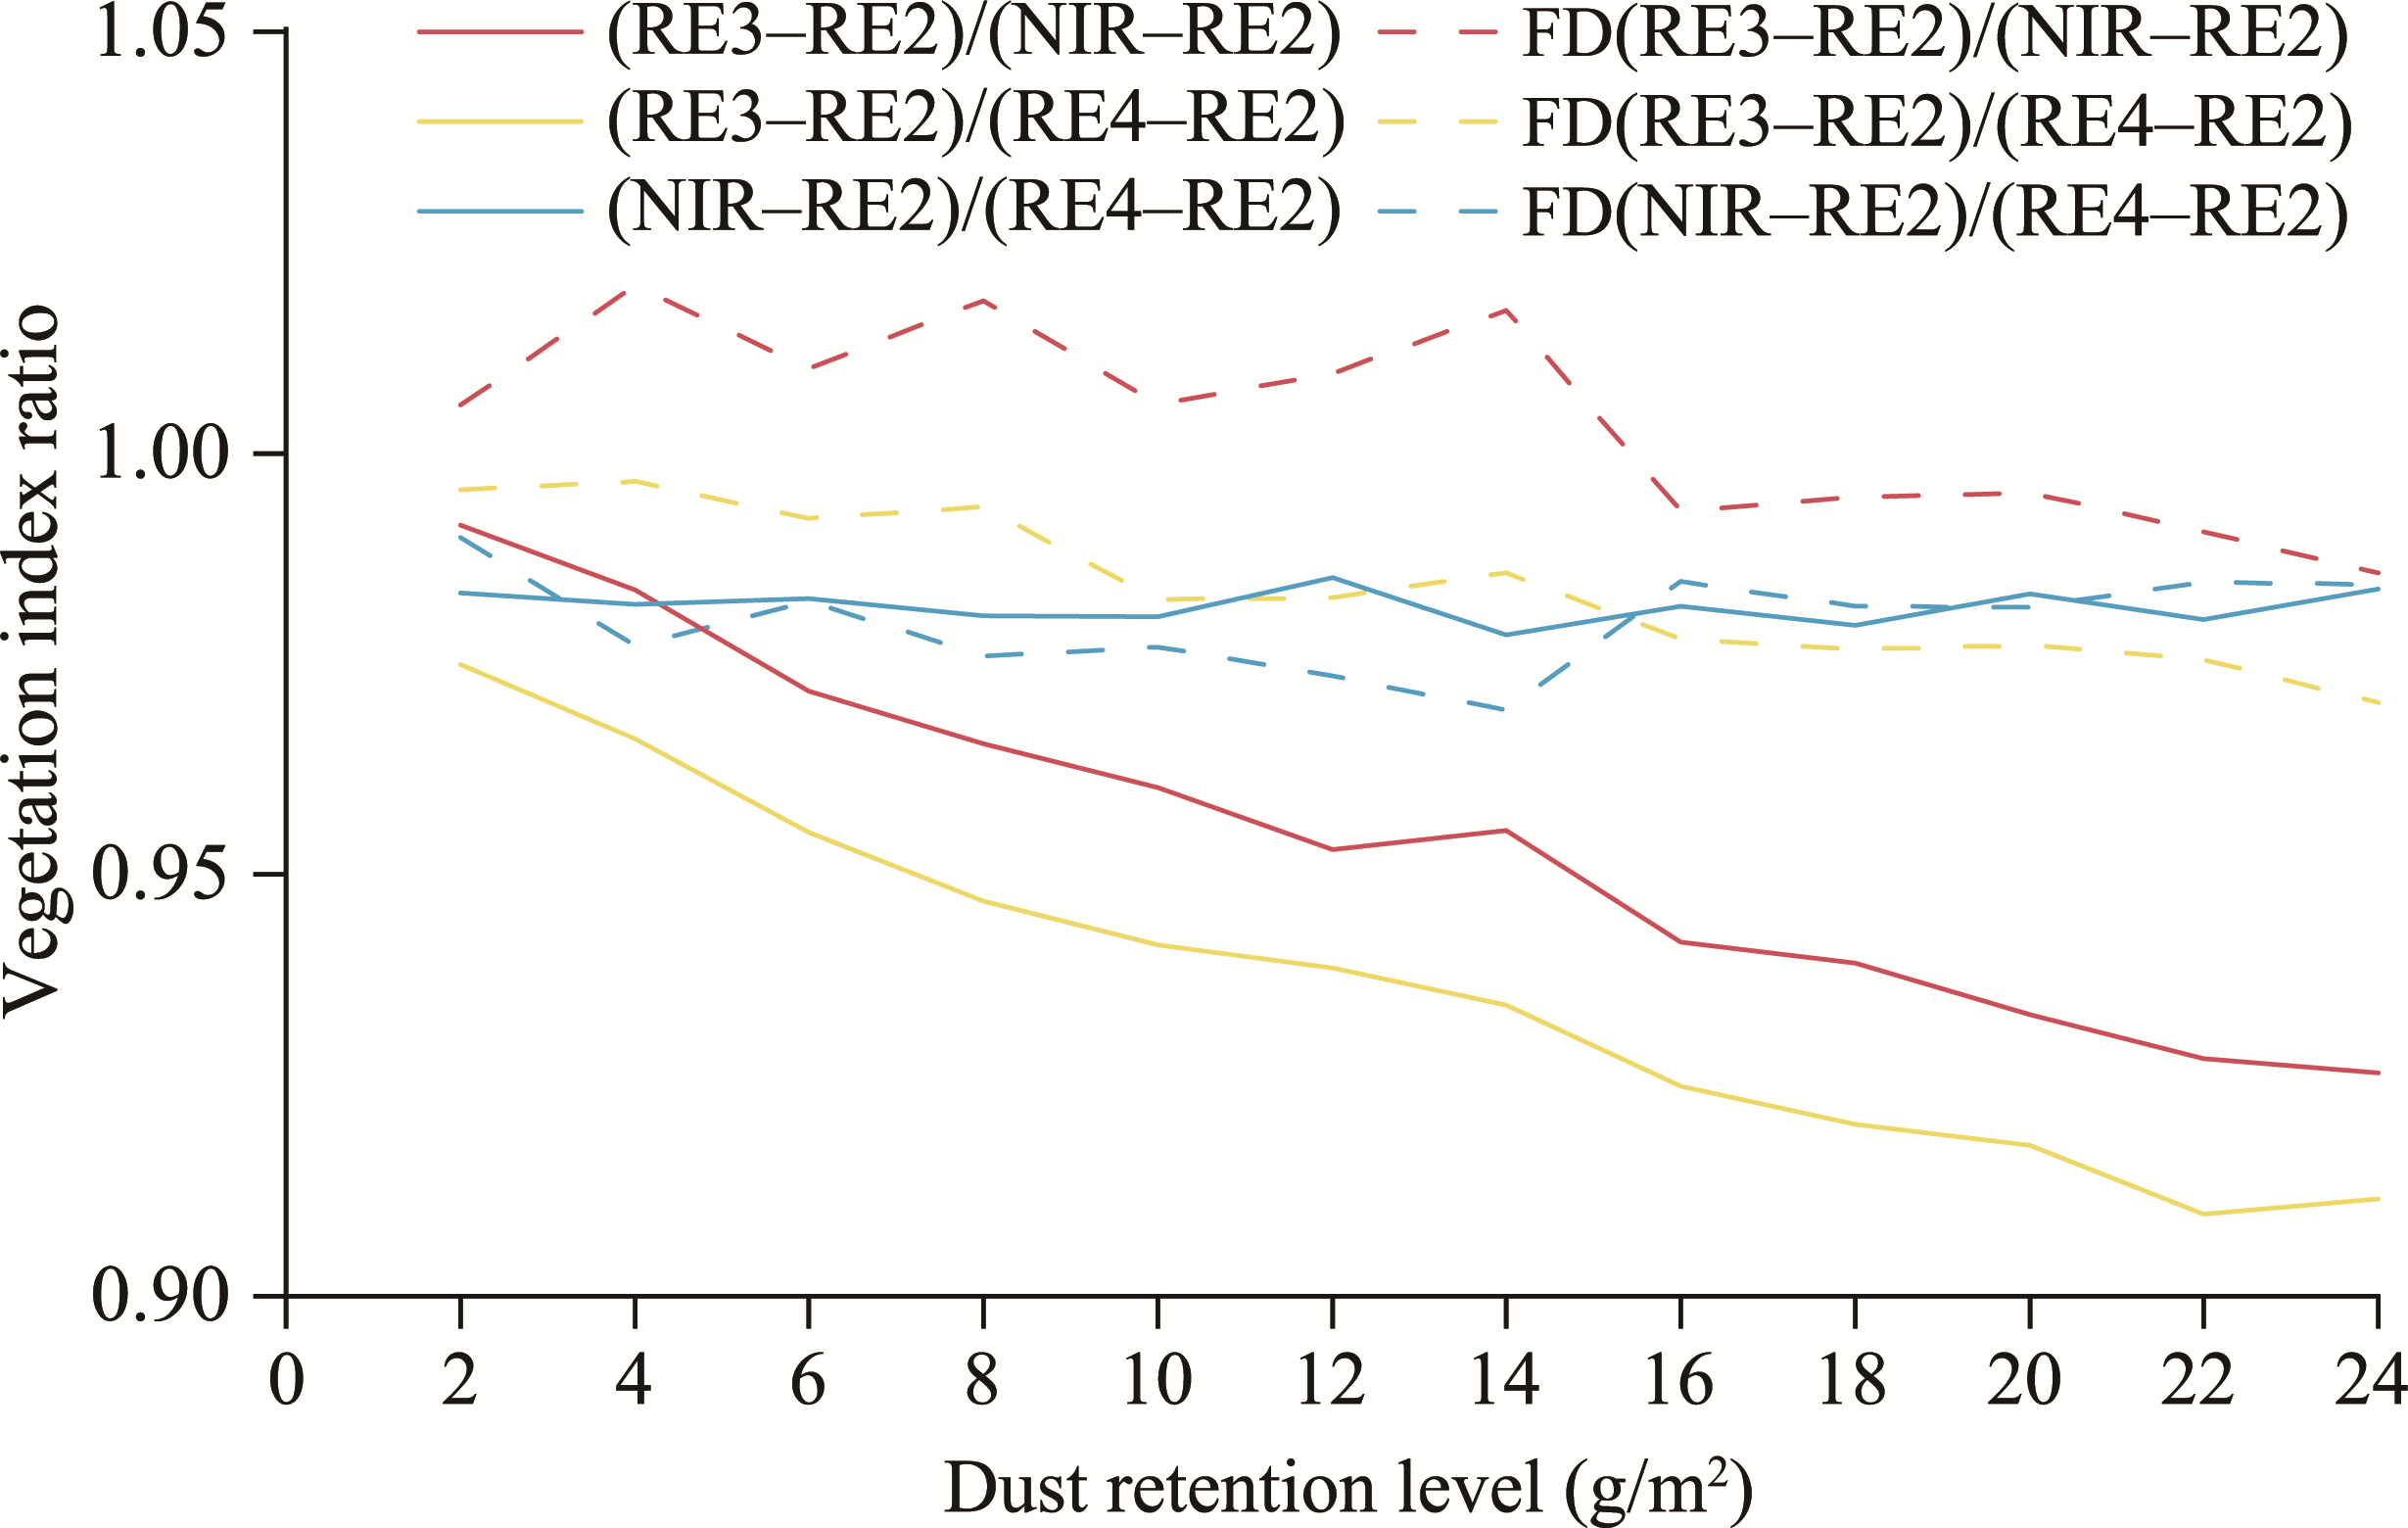
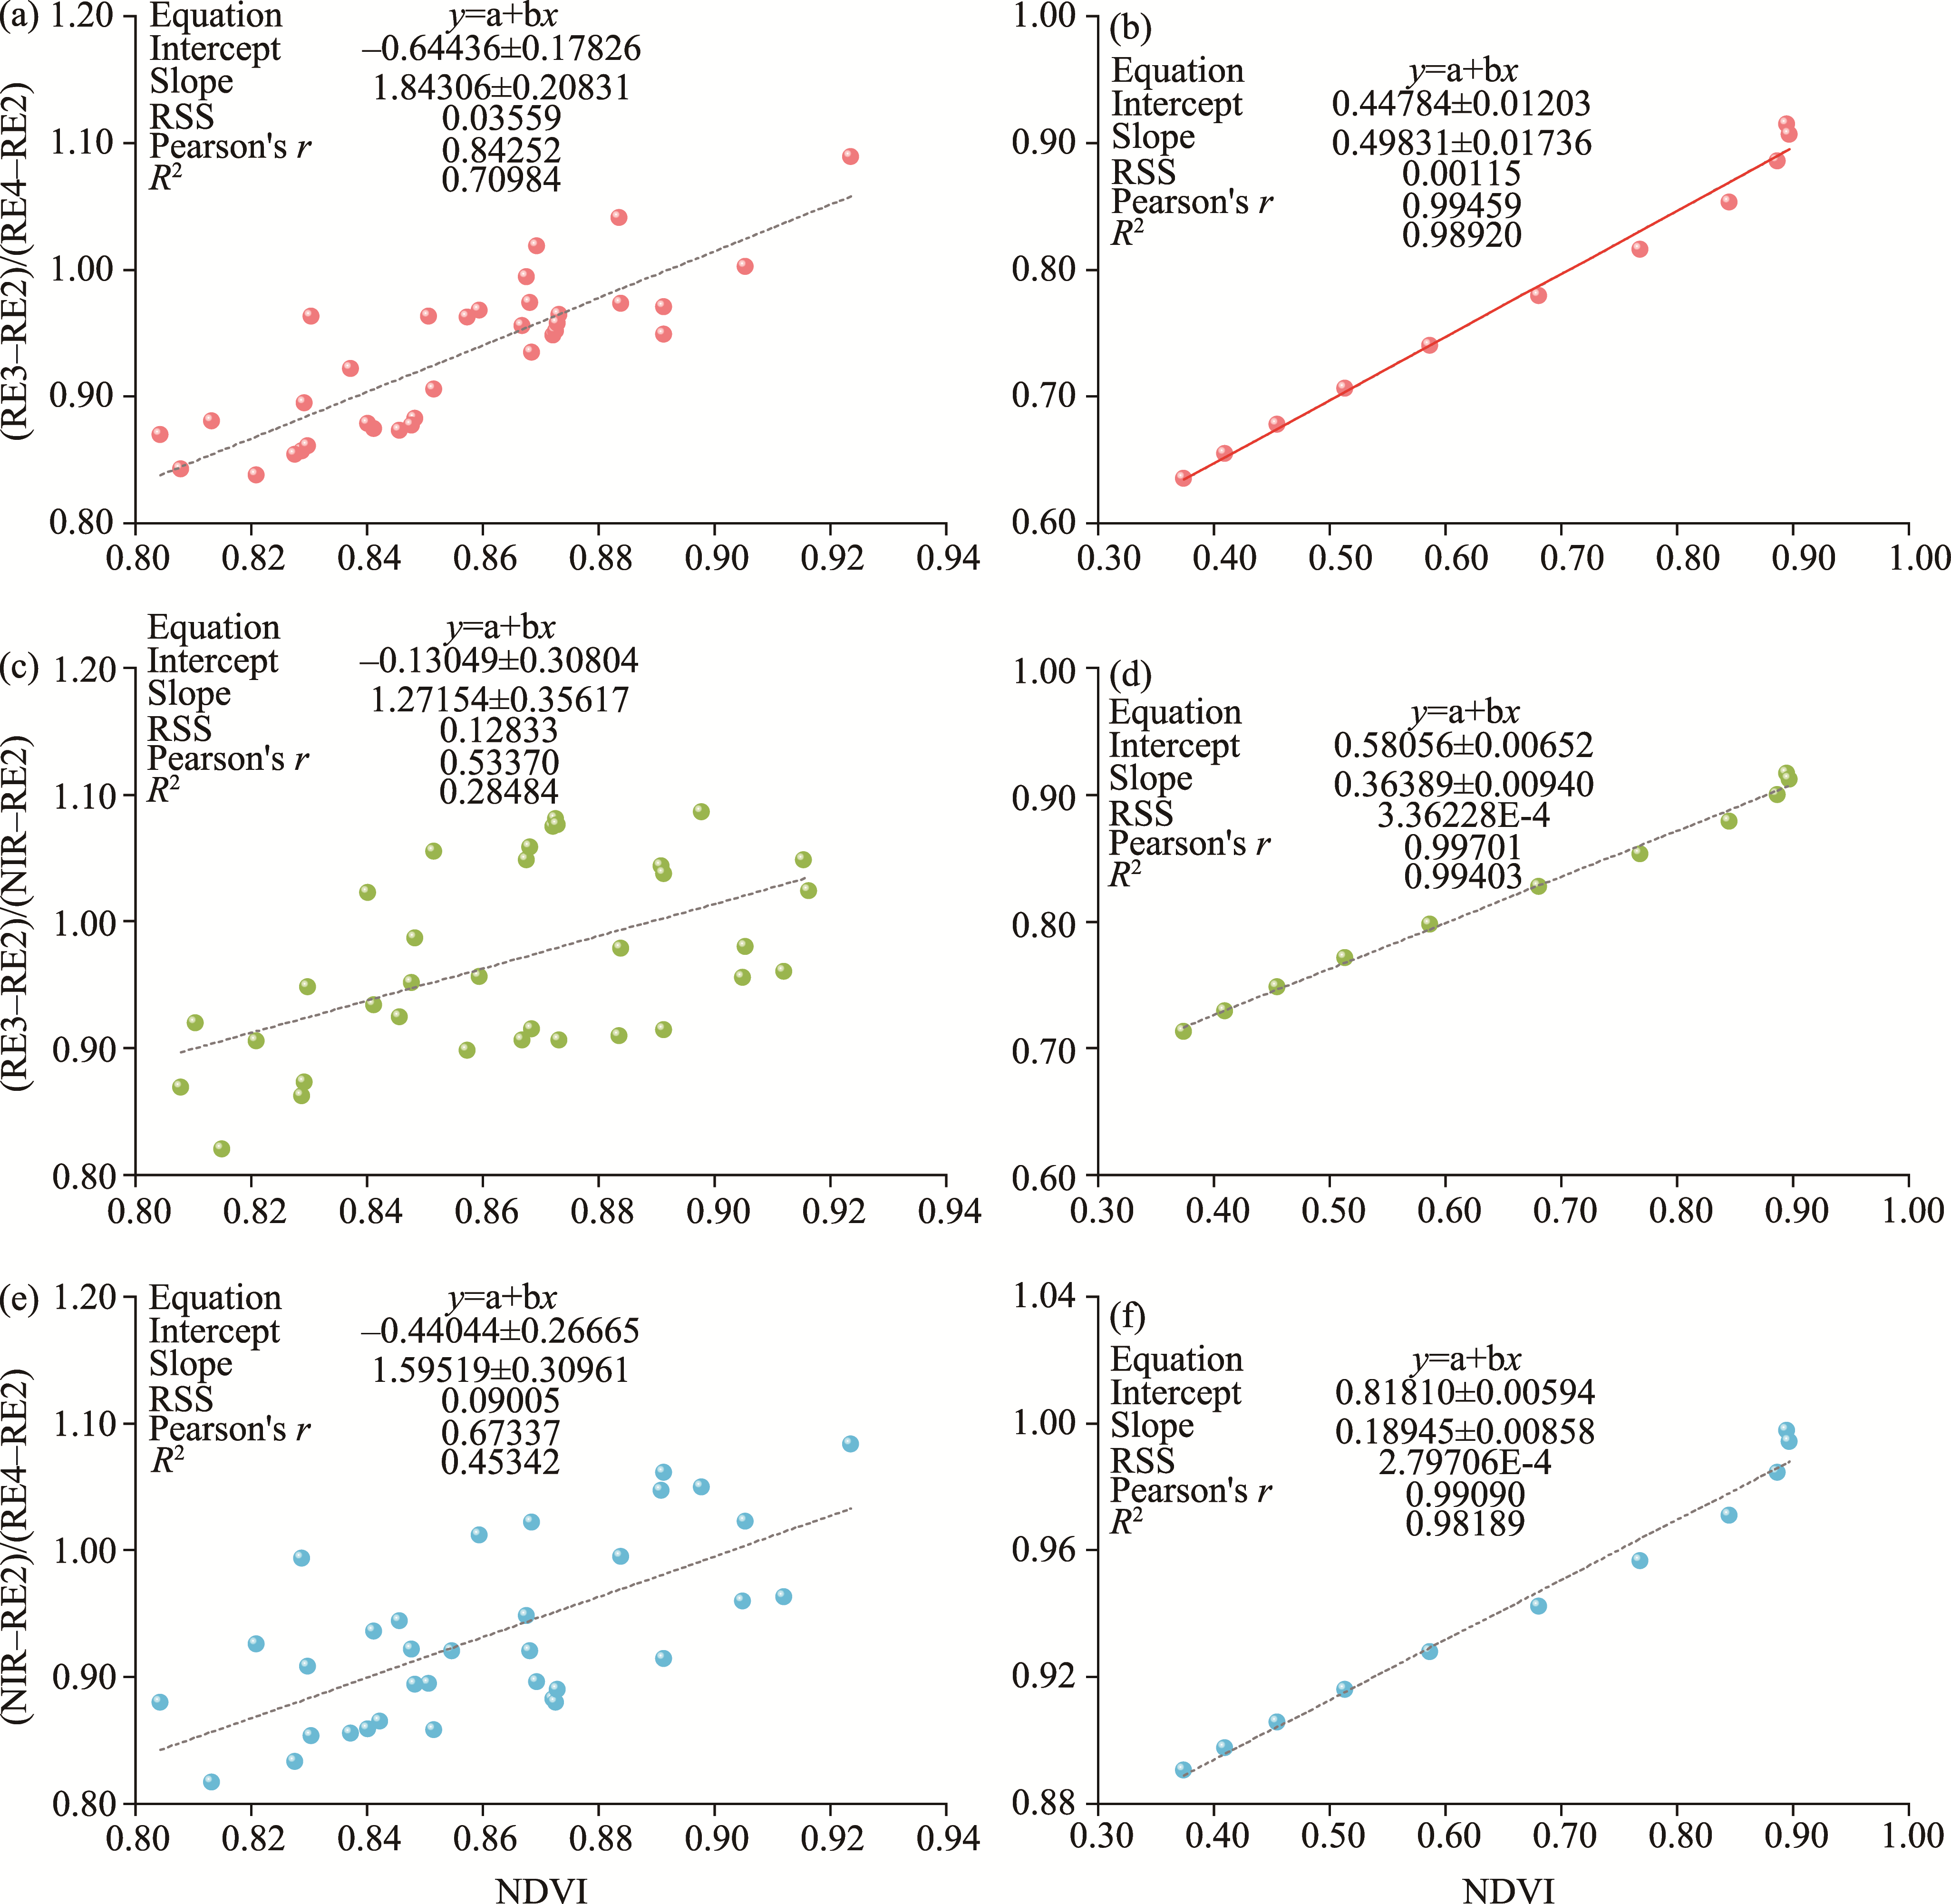
Abstract  

Sand dust belts span approximately one-fifth of the global land surface. In these regions, dust tends to settle on vegetation surfaces, altering the observed reflectance and affecting remote sensing detections. To enhance the accuracy of maize growth monitoring in dust-affected regions, this study aims to quantify the effect of sand dust retention on maize during the tasseling stage in the Kashgar Prefecture, Xinjiang Uygur Autonomous Region, China, by analyzing changes in canopy reflectance and vegetation indices. First, field sampling was conducted to measure the key canopy structure parameters and dust retention levels of maize, and laboratory spectral measurements were performed on leaf spectral properties under gradient dust retention. The measured data were then used to drive the LargE-Scale remote sensing data and image Simulation framework (LESS) model for simulating realistic maize canopy spectra across different dust levels, with validation against Sentinel-2 imagery. Second, on the basis of the simulated and satellite-derived spectra, the dust resistance of 36 common vegetation indices was systematically evaluated, and new robust dust-resistant indices were developed. The results showed that compared with dust-free maize, the canopy reflectance of dust-retained maize followed an increase-decrease-increase pattern, with critical turning points at 735 and 1325 nm. The maximum reflectance difference of -0.11755 (change rate: 29.002%) occurred within the 735-1325 nm range at 24 g/m2 dust retention, and the minimum reflectance difference of 0.04285 (change rate: 148.950%) was observed in the 350-735 nm range under the same dust retention level. Among the 36 vegetation indices, only the global environment monitoring index (GEMI) and the ratio of transformed chlorophyll absorption in reflectance index to optimized soil-adjusted vegetation index (TCARI/OSAVI) exhibited dust resistance, with GEMI being effective below 6 g/m2 and TCARI/OSAVI remaining stable across all levels (average ratio: 0.970). The newly developed indices in this study, (RE3-RE2)/(NIR-RE2), (RE3-RE2)/(RE4-RE2), and (NIR-RE2)/(RE4-RE2), retained values within the predefined dust-resistant range over the full dust retention levels of 0-24 g/m2, thus showing a more stable dust resistance compared with the commonly used 36 vegetation indices. Specially, (RE3-RE2)/(RE4-RE2) performed the most robustly in Sentinel-2 imagery, that is, 58.020% of pixels were within the dust-resistant range, and an average ratio of 0.937 was obtained for the original-spectra index. This study provides a scientific basis for crop monitoring and management in dust-affected regions.


Key wordssand dust retention      canopy spectral reflectance      LargE-Scale remote sensing data and image Simulation framework (LESS) model      dust-resistant      vegetation indices      tasseling-stage maize      Sentinel-2 imagery     
Received: 26 August 2025      Published: 31 January 2026
Corresponding Authors: *MA Baodong (E-mail: mabaodong@mail.neu.edu.cn)
Cite this article:

MA Baodong, GAO Shuxian, KANG Ting, CHE Defu, SHU Yang. Quantifying the impact of dust retention on maize canopy spectral reflectance and vegetation indices in dust belt regions: A case study in southern Xinjiang, China. Journal of Arid Land, 2026, 18(1): 101-130.

URL:

http://jal.xjegi.com/10.1016/j.jaridl.2026.01.008     OR     http://jal.xjegi.com/Y2026/V18/I1/101

Fig. 1 Geographical location of the study area. (a), dust belt over the northern hemisphere (from World Imagery Wayback on 31 July 2025; https://livingatlas.arcgis.com/wayback); (b), Kashgar Prefecture (from World Imagery Wayback on 31 July 2025); (c), photo of dust-retained maize plant in the study area; (d)-(e), photos of dust-retained maize leaves in the study area.
Fig. 2 Research flow of this research. LESS, LargE-Scale remote sensing data and image Simulation framework.
Fig. 3 Experimental maize leaves under varying dust retention levels. (a), 0 g/m2; (b), 8 g/m2; (c), 16 g/m2; (d), 24 g/m2.
Fig. 4 Spectral measurements of dust-retained leaves under various dust retention levels. (a), adaxial reflectance; (b), abaxial reflectance; (c), transmittance. The SVC HR-1024 spectrometer used in this study is fabricated by the Spectra Vista Corporation (Poughkeepsie, USA).
Parameter Value Source
Plant height (m) 2.284 Field measurement
Leaf number (per plant) 10-13 Field measurement
Leaf area index (LAI) 4.168 Field measurement
Row spacing (cm) 50 Field measurement
Plant spacing (cm) 25 Field measurement
Satellite azimuth angle (°) 104.158 (30 July 2024)/263.917 (7 August 2024) Sentinel-2 metadata (Copernicus Data Space Ecosystem; https://dataspace.copernicus.eu/)
Satellite zenith angle (°) 10.123 (30 July 2024)/4.559 (7 August 2024) Sentinel-2 metadata (Copernicus Data Space Ecosystem; https://dataspace.copernicus.eu/)
Sun azimuth angle (°) 136.464 (30 July 2024)/143.722 (7 August 2024) Sentinel-2 metadata (Copernicus Data Space Ecosystem; https://dataspace.copernicus.eu/)
Sun zenith angle (°) 26.540 (30 July 2024)/27.022 (7 August 2024) Sentinel-2 metadata (Copernicus Data Space Ecosystem; https://dataspace.copernicus.eu/)
Soil reflectance (%) Measured spectrum Lab measurement
Leaf reflectance/transmittance (%) Measured spectrum Lab measurement
Table 1 Input parameters used in the LargE-Scale remote sensing data and image Simulation framework (LESS) simulations
No. Vegetation index Formula Definition
1 Ratio vegetation index (RVI) $ \mathrm{RVI}=\frac{\mathrm{NIR}}{\mathrm{Red}}$ NIR is the reflectance of wavelength at 833 nm (i.e., Band 8 in Sentinel-2); Red is the reflectance of wavelength at 665 nm (i.e., Band 4 in Sentinel-2); Green is the reflectance of wavelength at 560 nm (i.e., Band 3 in Sentinel-2); η is a nonlinear combination parameter of near-infrared (NIR) and Red band reflectance; Blue is the reflectance of wavelength at 490 nm (i.e., Band 2 in Sentinel-2); L is a canopy background adjustment parameter; C1 is a coefficient for correcting aerosol scattering effects in the red band; C2 is a coefficient for correcting aerosol scattering effects in the blue band; G is a gain factor; c is a coefficient related to aerosol correction; RE1 is the reflectance of wavelength at 705 nm (i.e., Band 5 in Sentinel-2); RE2 is the reflectance of wavelength at 740 nm (i.e., Band 6 in Sentinel-2); RE3 is the reflectance of wavelength at 783 nm (i.e., Band 7 in Sentinel-2); RE is an abbreviation of Red Edge, which refers to the sharp transition zone in vegetation reflectance spectra; B705 is the reflectance of wavelength at 705 nm (corresponding Band 5 in Sentinel-2); B750 is the reflectance of wavelength at 750 nm (corresponding Band 6 in Sentinel-2); RE4 is the reflectance of wavelength at 865 nm (Band 8a in Sentinel-2); and B445 is the reflectance of wavelength at 445 nm (i.e., Band 1, the aerosol band of Sentinel-2).
2 Normalized difference vegetation index (NDVI) $ \mathrm{NDVI}=\frac{\mathrm{NIR}-\mathrm{Red}}{\mathrm{NIR}+\mathrm{Red}}$
3 Difference vegetation index (DVI) $\mathrm{DVI}=\mathrm{NIR}-\mathrm{Red}$
4 Green normalized difference vegetation index (GNDVI) $\mathrm{GNDVI}=\frac{\mathrm{NIR}-\text { Green }}{\mathrm{NIR}+\text { Green }}$
5 Red-green normalized difference index (RGNDI) $ \text { RGNDI }=\frac{\text { Red }- \text { Green }}{\text { Red }+ \text { Green }}$
6 Renormalized difference vegetation index (RDVI) $ \mathrm{RDVI}=\frac{\mathrm{NIR}-\mathrm{Red}}{\sqrt{\mathrm{NIR}+\mathrm{Red}}}$
7 Transformed normalized difference vegetation index (TNDVI) $ \mathrm{TNDVI}=\sqrt{\frac{\mathrm{NIR}-\mathrm{Red}}{\mathrm{NIR}+\mathrm{Red}}+0.5}$
8 Normalized difference green index (NDGI) $ \mathrm{NDGI}=\frac{\text { Green }- \text { Red }}{\text { Green }+ \text { Red }}$
9 Modified soil-adjusted vegetation index (MSAVI) $ \mathrm{MSAVI}=\frac{2 \times \mathrm{NIR}+1-\sqrt{(2 \times \mathrm{NIR}+1)^{2}-8 \times(\mathrm{NIR}-\mathrm{Red})}}{2}$
10 Global environment monitoring index (GEMI) $ \begin{array}{l} \text { GEMI }=\frac{\eta \times(1-0.25 \times \eta)-(\text { Red }-0.125)}{1-\text { Red }} \\ \eta=\frac{2 \times\left(\mathrm{NIR}^{2}-R^{2}\right)+1.5 \times \mathrm{NIR}+0.5 \times \text { Red }}{\mathrm{NIR}+\text { Red }+0.5} \end{array}$
11 Green vegetation index (GVI) $ \mathrm{GVI}=\frac{\mathrm{NIR}}{\text { Green }}$
12 Red-green ratio index (RGRI) $ \mathrm{RGRI}=\frac{\text { Red }}{\text { Green }}$
13 Green-red normalized difference vegetation index (GRNDVI) $ \text { GRNDVI }=\frac{\text { NIR }-(\text { Red }+ \text { Green })}{\text { NIR }+ \text { Red }+ \text { Green }}$
14 Enhanced vegetation index (EVI)错误!未找到引用源。 $ \begin{array}{l} \mathrm{EVI}=\frac{\mathrm{NIR}-\mathrm{Red}}{\mathrm{NIR}+C_{1} \times \mathrm{Red}-C_{2} \times \mathrm{Blue}+L} \\ \left(L=1.5, \quad C_{1}=6, \quad \text { and } C_{2}=7.5\right) \end{array}$
15 Enhanced vegetation index 2 (EVI2) $ \begin{array}{l} \mathrm{EVI} 2=G \frac{\mathrm{NIR}-\mathrm{Red}}{\mathrm{NIR}+(6-7.5 / c) \times \mathrm{Red}+1} \\ (G=2.5, \quad c=2.08) \end{array}$
16 Normalized difference red edge index 1 (NDRE1) $ \mathrm{NDRE} 1=\frac{\mathrm{RE} 1-\mathrm{RE} 2}{\mathrm{RE} 1+\mathrm{RE} 2}$
17 Normalized difference red edge index 2 (NDRE2) $ \mathrm{NDRE} 2=\frac{\mathrm{NIR}-\mathrm{RE}}{\mathrm{NIR}+R E}$
18 Modified simple ratio index (MSR) $ \mathrm{MSR}=\frac{\mathrm{NIR} / \mathrm{Red}-1}{\sqrt{\mathrm{NIR} / \mathrm{Red}+1}}$
19 Meris terrestrial chlorophyll index (MTCI) $ \mathrm{MTCI}=\frac{\mathrm{NIR}-\mathrm{RE}}{\mathrm{RE}+\mathrm{Red}}$
20 Modified chlorophyll absorption in reflectance index (MCARI) $ \mathrm{MCARI}=[(\mathrm{RE}-\mathrm{Red})-0.2(\mathrm{RE}-\text { Green })] \times \frac{\mathrm{RE}}{\text { Red }}$
21 Ratio of transformed chlorophyll absorption in reflectance index to optimized soil-adjusted vegetation index (TCARI/OSAVI) $ \text { TCARI/OSAVI }=\frac{3 \times[(\text { RE }- \text { Red })-0.2(\text { RE }- \text { Green })(\text { RE } / \text { Red })]}{(1+0.16)(\text { NIR }- \text { Red }) /(\text { NIR }+ \text { Red }+0.16)}$
22 Ratio of transformed chlorophyll absorption in reflectance index to optimized soil-adjusted vegetation index at 705 and 750 nm (TCARI/OSAVI[705,750]) $ \mathrm{TCARI} / \mathrm{OSAVI}_{[705,750]}=\frac{3 \times\left[\left(B_{750}-B_{705}\right)-0.2\left(B_{750}-B_{550}\right)\left(B_{750} / B_{705}\right)\right]}{(1+0.16)\left(B_{750}-B_{705}\right) /\left(B_{750}+B_{705}+0.16\right)}$
23 Ratio of modified chlorophyll absorption in reflectance index to optimized soil-adjusted vegetation index (MCARI/OSAVI) $ \mathrm{MCARI} / \mathrm{OSAVI}=\frac{(\mathrm{RE}-\mathrm{Red})-0.2(\mathrm{RE}-\mathrm{Green})(\mathrm{RE} / \mathrm{Red})}{(1+0.16)(\mathrm{NIR}-\mathrm{Red}) /(\mathrm{NIR}+\mathrm{Red}+0.16)}$
24 Ratio of modified chlorophyll absorption in reflectance index to optimized soil-adjusted vegetation index at 705 and 750 nm (MCARI/OSAVI[705,750]) $ \mathrm{MCARI} / \mathrm{OSAVI}_{[705,750]}=\frac{\left(B_{750}-B_{705}\right)-0.2\left(B_{750}-B_{550}\right)\left(B_{750} / B_{705}\right)}{(1+0.16)\left(B_{750}-B_{705}\right) /\left(B_{750}+B_{705}+0.16\right)}$
25 Chlorophyll index green (CIgreen) $ C I_{\text {green }}=\frac{\mathrm{NIR}}{\text { Green }}-1$
26 Chlorophyll index red edge (CIrededge) $ \mathrm{CI}_{\text {redegde }}=\frac{\mathrm{NIR}}{\mathrm{RE}}-1$
27 Normalized difference vegetation index red edge 1 (NDVIre1) $ \mathrm{NDVI}_{r e 1}=\frac{\mathrm{NIR}-\mathrm{RE} 1}{\mathrm{NIR}+\mathrm{RE} 1}$
28 Normalized difference vegetation index narrow red edge 1
(NDVIre1n)
$ \mathrm{NDVI}_{r e 1 n}=\frac{\mathrm{RE} 4-\mathrm{RE} 1}{\mathrm{RE} 4+\mathrm{RE} 1}$
29 Normalized difference vegetation index red edge 2 (NDVIre2) $ \mathrm{NDVI}_{r e 2}=\frac{\mathrm{NIR}-\mathrm{RE} 2}{\mathrm{NIR}+\mathrm{RE} 2}$
30 Normalized difference vegetation index narrow red edge 2
(NDVIre2n)
$ \mathrm{NDVI}_{r e 2 n}=\frac{\mathrm{RE} 4-\mathrm{RE} 2}{\mathrm{RE} 4+\mathrm{RE} 2}$
31 Normalized difference vegetation index red edge 3 (NDVIre3) $ \mathrm{NDVI}_{r e 3 n}=\frac{\mathrm{RE} 4-\mathrm{RE} 3}{\mathrm{RE} 4+\mathrm{RE} 3}$
32 Normalized difference vegetation index narrow red edge 3
(NDVIre3n)
$ \mathrm{NDVI}_{r e 3 n}=\frac{\mathrm{RE} 4-\mathrm{RE} 3}{\mathrm{RE} 4+\mathrm{RE} 3}$
33 Simple ratio index at 705 nm (SR705) $ \mathrm{SR}_{705}=\frac{B_{750}}{B_{705}}$
34 Normalized difference index at 705 nm (ND705) $ \mathrm{ND}_{705}=\frac{B_{750}-B_{705}}{B_{750}+B_{705}}$
35 Modified simple ratio index at 705 nm (mSR705) $ \mathrm{mSR}_{705}=\frac{B_{750}-B_{445}}{B_{705}-B_{445}}$
36 Modified normalized difference index at 705 nm (mND705) $ \mathrm{mND}_{705}=\frac{B_{750}-B_{705}}{B_{750}+B_{705}-2 \times B_{445}}$
Table 2 Vegetation index formula
Fig. 5 Spectra of dust and the adaxial reflectance, abaxial reflectance, and transmittance of dust-free maize leaf
Fig. 6 Adaxial (a) and abaxial (b) reflectance, and transmittance (c) of maize leaves under varying dust retention levels
Fig. 7 LESS-simulated maize canopy reflectance and comparisons between canopy and leaf scales. (a), LESS-simulated maize canopy reflectance; (b), the leaf-scale reflectance differences and change rates, as well as the canopy-scale counterparts simulated by LESS; (c), error bars of reflectance differences between dust-free and dust-retained conditions.
Fig. 8 Comparison of spectra from Sentinel-2 images and LESS simulation results. The error bars denote standard deviation of reflectance, reflecting the variability among the simulations and Sentinel-2 pixel samples.
Band 2 g/m2 4 g/m2 6 g/m2 8 g/m2 10 g/m2 Mean Standard deviation (SD)
Aerosol 0.00069 0.00043 0.00029 0.00020 0.00012 0.00035 0.00022
Blue 0.00089 0.00055 0.00035 0.00023 0.00013 0.00043 0.00030
Green 0.00048 0.00025 0.00013 0.00006 0.00002 0.00019 0.00019
Red 0.00157 0.00094 0.00056 0.00034 0.00015 0.00071 0.00056
RE1 0.00174 0.00118 0.00084 0.00063 0.00041 0.00096 0.00052
RE2 0.00086 0.00031 0.00008 0.00001 0.00013 0.00028 0.00034
RE3 0.00054 0.00001 0.00013 0.00098 0.00208 0.00075 0.00084
NIR 0.00161 0.00036 0.00003 0.00022 0.00086 0.00062 0.00063
RE4 0.00032 0.00001 0.00029 0.00139 0.00270 0.00094 0.00111
Water vapor 0.00142 0.00032 0.00002 0.00021 0.00086 0.00057 0.00057
SWIR1 0.00008 0.00002 0.00000 0.00000 0.00002 0.00003 0.00003
SWIR2 0.00048 0.00020 0.00006 0.00001 0.00001 0.00015 0.00020
Sum of
seven bands
0.00769 0.00360 0.00211 0.00247 0.00378 0.00393 0.00222
Table 3 Squared reflectance difference of Sentinel-2 and LESS-simulated spectra across bands under varying dust retention levels
Fig. 9 Normalized difference vegetation index (NDVI) (a and b) and ratio of transformed chlorophyll absorption in reflectance index to optimized soil-adjusted vegetation index (TCARI/OSAVI) (c and d) images of the study area under dust-free and dust-retained conditions
Table 4 Ratio of vegetation indices in the LESS simulation results under varying dust retention levels
Table 5 Ratio of GEMI and TCARI/OSAVI using Sentinel-2 images
Fig. 10 Change trend (a) and combination (b) of spectral bands under varying dust retention levels. The reflectance curves of near-infrared (NIR) and RedEdge-4 (RE4) are nearly identical and thus difficult to distinguish visually. Aerosol, reflectance of wavelength at 443 nm; Blue, reflectance of wavelength at 490 nm; Green, the reflectance of wavelength at 560 nm; Red, the reflectance of wavelength at 665 nm; RedEdge-1 (RE1), reflectance of wavelength at 705 nm; RedEdge-2 (RE2), reflectance of wavelength at 740 nm; RedEdge-3 (RE3), reflectance of wavelength at 783 nm; NIR, reflectance of wavelength at 842 nm; RE4, reflectance of wavelength at 865 nm; SWIR 1, shortwave infrared 1; SWIR 2, shortwave infrared 2.
Fig. 11 Ratio of new vegetation indices under varying dust retention levels. (RE3-RE2)/(NIR-RE2), (RE3-RE2)/(RE4-RE2), and (NIR-RE2)/(RE4-RE2) represent the original spectral reflectance calculation values; FD(RE3-RE2)/(NIR-RE2), FD(RE3-RE2)/(RE4-RE2), and FD(NIR-RE2)/(RE4-RE2) denote the differential spectral reflectance calculation values.
Fig. 12 Vegetation index ratio of three new constructed vegetation indices.
Fig. 13 Sensitivity analysis of dust retention to maize canopy reflectance
Fig. 14 Pattern of variations of Red, NIR, global environment monitoring index (GEMI), η, and GEMI ratio under varying dust retention levels. η is a nonlinear combination parameter of NIR and Red band reflectance; and GEMI ratio is the percentage ratio of the GEMI index value under a 24 g/m2 condition to that under a dust-free condition.
Fig. 15 Correlation between NDVI and new vegetation indices from original (a, c, and e) and differential (b, d, and f) spectra. RSS, residual sum of squares.
Year Date 1 Date 2 Interval (d) Mean NDVI difference SD
2024 30 July 7 August 8 0.121 0.035
2023 27 July 6 August 10 0.052 0.020
2021 28 July 5 August 8 0.007 0.019
2020 29 July 8 August 10 -0.071 0.027
Table 6 Multi-year NDVI difference analysis between late July and early August
Index Mean relative error (%) Max relative error (%) R2 (narrow vs. broad) P
SR705 13.515 18.843 0.99994 6.359×10⁻²³
ND705 10.995 13.152 0.99979 6.794×10⁻²⁰
mSR705 16.584 20.271 0.99992 3.844×10⁻²²
mND705 8.418 10.920 0.99987 5.054×10⁻²¹
TCARI/OSAVI[705,750] 356.251 4325.132 0.99950 7.192×10⁻¹⁸
MCARI/OSAVI[705,750] 20.288 28.764 0.99971 3.758×10⁻¹⁹
Table 7 Comparison between narrow- and broad-band vegetation indices obtained from LESS simulations
[1]   Abasl A, Hu S Q, Maimaitireyimu N. 2015. Effect of climate change on cotton growth period and yield in Kashgar City, Xinjiang Uygur Autonomous Region. Chinese Journal of Eco-Agriculture, 23(7): 919-930. (in Chinese)
[2]   Abudukade S, Yang F, Liu Y Q, et al. 2023. Effects of artificial green land on land-atmosphere interactions in the Taklamakan Desert. Land, 12(8): 1541, doi: 10.3390/land12081541.
[3]   Ackerman D E, Finlay J C. 2019. Road dust biases NDVI and alters edaphic properties in Alaskan arctic tundra. Scientific Reports, 9: 214, doi: 10.1038/s41598-018-36804-3.
pmid: 30659211
[4]   Ao D, Yang J H, Ding W T, et al. 2023. Review of 54 vegetation indices. Journal of Anhui Agricultural Sciences, 51(1): 13-21, 28. (in Chinese)
[5]   Bi R T, Bai Z K. 2007. Land characteristic information and classification in opencast coal mine based on remote sensing images. Transactions of the Chinese Society of Agricultural Engineering, 23(2): 77-82, 291. (in Chinese)
[6]   Chen S Y, Huang J P, Li J X, et al. 2017. Comparison of dust emissions, transport, and deposition between the Taklimakan Desert and Gobi Desert from 2007 to 2011. Science China Earth Sciences, 60(7): 1338-1355.
doi: 10.1007/s11430-016-9051-0
[7]   Fu Y Z, Wang X Q. 2010. Analysis of vegetation indices based on the CCD data of BJ-1. Science of Surveying and Mapping, 35(6): 37-40.
[8]   Haboudane D, Miller J R, Tremblay N, et al. 2002. Integrated narrow-band vegetation indices for prediction of crop chlorophyll content for application to precision agriculture. Remote Sensing of Environment, 81(2-3): 416-426.
doi: 10.1016/S0034-4257(02)00018-4
[9]   Jin Q J, Wang C E. 2018. The greening of Northwest Indian subcontinent and reduction of dust abundance resulting from Indian summer monsoon revival. Scientific Reports, 8: 4573, doi: 10.1038/s41598-018-23055-5.
pmid: 29545562
[10]   Kayet N, Pathak K, Singh C P, et al. 2024. Assessment and estimation of coal dust impact on vegetation using Vis difference model and PRISMA hyperspectral data in mining sites. Journal of Environmental Management, 367: 121935, doi: 10.1016/j.jenvman.2024.121935.
[11]   Le Page M, Jarlan L, El Hajj M M, et al. A. 2020. Potential for the detection of irrigation events on maize plots using Sentinel-1 soil moisture products. Remote Sensing, 12(10): 1621, doi: 10.3390/rs12101621.
[12]   Li Z P. 2022. Predicting above-ground biomass and yield of winter wheat based on UAV multi-source spectral remote sensing imagery MSc Thesis. Henan Agricultural University. (in Chinese)
[13]   Lin W P, Sun Y, Wang D, et al. 2021. Estimation model of dust deposition capacity of common vegetation based on spectral characteristics in Shanghai, China. Sustainable Cities and Society, 70: 102915, doi: 10.1016/j.scs.2021.102915.
[14]   Liu L C, Cao R Y, Shen M G, et al. 2019. How does scale effect influence spring vegetation phenology estimated from satellite-derived vegetation indexes? Remote Sensing, 11(18): 2137, doi: 10.3390/rs11182137.
[15]   Lyon R J P. 1996. The effects of weathering and other varnish-like coatings on high spectral resolution airborne imagery (Part two). National Remote Sensing Bulletin, 11(3): 186-194. (in Chinese)
[16]   Ma B D, Li X X, Jiang Z W, et al. 2020. Dust dispersion and its effect on vegetation spectra at canopy and pixel scales in an open-pit mining area. Remote Sensing, 12(22): 3759, doi: 10.3390/rs12223759.
[17]   Ma B D, Yang X R, Jiang Z W, et al. 2023. Influence and quantitative analysis of coal dust retention on reflectance spectra and vegetation index of leaves. Spectroscopy and Spectral Analysis, 43(6): 1947-1952. (in Chinese)
[18]   Nguy-Robertson A, Gitelson A, Peng Y, et al. 2012. Green leaf area index estimation in maize and soybean: combining vegetation indices to achieve maximal sensitivity. Agronomy Journal, 104(5): 1336-1347.
doi: 10.2134/agronj2012.0065
[19]   Prospero J M, Ginoux P, Torres O, et al. 2002. Environmental characterization of global sources of atmospheric soil dust identified with the Nimbus 7 Total Ozone Mapping Spectrometer (TOMS) absorbing aerosol product. Reviews of Geophysics, 40(1): 2-31.
[20]   Przybysz A, Sæbø A, Hanslin H M, et al. 2014. Accumulation of particulate matter and trace elements on vegetation as affected by pollution level, rainfall and the passage of time. Science of the Total Environment, 481: 360-369.
doi: 10.1016/j.scitotenv.2014.02.072
[21]   Qi J B, Xie D H, Yin T G, et al. 2019. LESS: LargE-Scale remote sensing data and image simulation framework over heterogeneous 3D scenes. Remote Sensing of Environment, 221: 695-706.
doi: 10.1016/j.rse.2018.11.036
[22]   Qu J J, Hao X J, Kafatos M, et al. 2006. Asian dust storm monitoring combining terra and aqua MODIS SRB measurements. IEEE Geoscience and Remote Sensing Letters, 3(4): 484-486.
doi: 10.1109/LGRS.2006.877752
[23]   Rondeaux G, Steven M, Baret F. 1996. Optimization of soil-adjusted vegetation indices. Remote Sensing of Environment, 55(2): 95-107.
doi: 10.1016/0034-4257(95)00186-7
[24]   Sawidis T, Breuste J, Mitrovic M, et al. 2011. Trees as bioindicator of heavy metal pollution in three European cities. Environmental Pollution, 159(12): 3560-3570.
doi: 10.1016/j.envpol.2011.08.008 pmid: 21907471
[25]   Serouart M, Lopez-Lozano R, Daubige G, et al. 2023. Analyzing changes in maize leaves orientation due to GxExM using an automatic method from RGB images. Plant Phenomics, 5: 0046, doi: 10.34133/plantphenomics.0046.
[26]   Shahid M, Dumat C, Khalid S, et al. 2017. Foliar heavy metal uptake, toxicity and detoxification in plants: A comparison of foliar and root metal uptake. Journal of Hazardous Materials, 325: 36-58.
doi: S0304-3894(16)31093-7 pmid: 27915099
[27]   Shang R, Liu R G, Xu M Z, et al. 2017. The relationship between threshold-based and inflexion-based approaches for extraction of land surface phenology. Remote Sensing of Environment, 199: 167-170.
doi: 10.1016/j.rse.2017.07.020
[28]   Sun Y D, Chen Q B, Li Y M, et al. 2019. Relationship between leaf structure and dust retention capacity of 6 greening tree species in Kunming. Journal of Southwest Forestry University, 39(3): 78-85. (in Chinese)
[29]   Wang G, Yu Q, Yang D, et al. 2022. Retrieval of dust retention distribution in Beijing urban green space based on spectral characteristics. Spectroscopy and Spectral Analysis, 42(8): 2572-2578. (in Chinese)
[30]   Wang X M, Zhou Z J, Dong Z B. 2006. Control of dust emissions by geomorphic conditions, wind environments and land use in northern China: An examination based on dust storm frequency from 1960 to 2003. Geomorphology, 81(3-4): 292-308.
doi: 10.1016/j.geomorph.2006.04.015
[31]   Wang Z M, Li G M, Li X, et al. 2012. Characteristics of moisture and salinity of soil in Taklimakan Desert, China. Water Science and Technology, 66(6): 1162-1170.
doi: 10.2166/wst.2012.270 pmid: 22828291
[32]   Weerakkody U, Dover J W, Mitchell P, et al. 2018. The impact of rainfall in remobilising particulate matter accumulated on leaves of four evergreen species grown on a green screen and a living wall. Urban Forestry & Urban Greening, 35: 21-31.
[33]   Xu X W, Zhang Z M, Bao L, et al. 2017. Influence of rainfall duration and intensity on particulate matter removal from plant leaves. Science of the Total Environment, 609: 11-16.
doi: 10.1016/j.scitotenv.2017.07.141
[34]   Xu X W, Yu X X, Bao L, et al. 2019. Size distribution of particulate matter in runoff from different leaf surfaces during controlled rainfall processes. Environmental Pollution, 255(Part 1): 113234, doi: 10.1016/j.envpol.2019.113234.
[35]   Yan X, Shi W, Zhao W, et al. 2014. Estimation of atmospheric dust deposition on plant leaves based on spectral features. Spectroscopy Letters, 47(7): 536-542.
doi: 10.1080/00387010.2013.820761
[36]   Yao X F, Ge B Z, Li A B, et al. 2023. Spatio-temporal variation of PM2.5 pollution in Xinjiang and its causes: The growing importance in air pollution situation in China. Frontiers in Environmental Science, 10: 1051610, doi: 10.3389/fenvs.2022.1051610.
[37]   Yumimoto K, Kajino M, Tanaka T Y, et al. 2019. Dust vortex in the Taklimakan Desert by Himawari-8 high frequency and resolution observation. Scientific Reports, 9: 1029, doi: 10.1038/s41598-018-37861-4.
[38]   Zeng F G, Ding Z Y, Song Q K, et al. 2023. MT-Det: A novel fast object detector of maize tassel from high-resolution imagery using single level feature. Computers and Electronics in Agriculture, 214: 108135, doi: 10.1016/j.compag.2023.108305.
[39]   Zhang C, Su X Y, Xia T, et al. 2023. Monitoring the degree of pollution in different varieties of maize under copper and lead stress. Spectroscopy and Spectral Analysis, 43(4): 1268-1274. (in Chinese)
[40]   Zhang L F, Yan H W, Qiu L S, et al. 2021. Spatial and temporal analyses of vegetation changes at multiple time scales in the Qilian Mountains. Remote Sensing, 13(24): 5046, doi: 10.3390/rs13245046.
[41]   Zhang X X, Sharratt B, Chen X, et al. 2017. Dust deposition and ambient PM10 concentration in Northwest China: spatial and temporal variability. Atmospheric Chemistry and Physics, 17(3): 1699-1711.
[42]   Zhang Y L, Wang X, Li C H, et al. 2018. NDVI dynamics under changing meteorological factors in a shallow lake in future metropolitan, semiarid area in North China. Scientific Reports, 8: 15971, doi: 10.1038/s41598-018-33968-w.
pmid: 30374106
[43]   Zhao Y B, Lei S G, Yang X C, et al. 2020. Study on spectral response and estimation of grassland plants dust retention based on hyperspectral data. Remote Sensing, 12(12): 2019, doi: 10.3390/rs12122019.
[44]   Zhou Y Q, Li Y M, Li W, et al. 2022. Ecological responses to climate change and human activities in the arid and semi-arid regions of Xinjiang in China. Remote Sensing, 14(16): 3911, doi: 10.3390/rs14163911.
[1] MA Yutao, GONG Jie, JIN Tiantian, XU Tianyu, KAN Guobin. Comparison of different vegetation indices for estimating vegetation changes and analyzing driving factors in a semi-arid area, China[J]. Journal of Arid Land, 2025, 17(12): 1785-1805.
[2] ZhengYang YAO, JianJun LIU, XiaoWen ZHAO, DongFeng LONG, Li WANG. Spatial dynamics of aboveground carbon stock in urban green space: a case study of Xi’an, China[J]. Journal of Arid Land, 2015, 7(3): 350-360.
[3] Feng YAN, Bo WU, YanJiao WANG. Estimating aboveground biomass in Mu Us Sandy Land using Landsat spectral derived vegetation indices over the past 30 years[J]. Journal of Arid Land, 2013, 5(4): 521-530.
[4] QiuXiang YI, AnMing BAO, Yi LUO, Jin ZHAO. Measuring cotton water status using water-related vegetation indices at leaf and canopy levels[J]. Journal of Arid Land, 2012, 4(3): 310-319.