Accelerated global climate change and intensified human activities profoundly alter landscape patterns and ecosystem services (ESs), making the quantitative evaluation of their dynamic interactions essential for advancing regional sustainable development. This study focused on Qilian Mountain National Park and employed FRAGSTATS 4.2 to analyze the landscape pattern evolution from 2000 to 2020. The Integrated Valuation of Ecosystem Services and Tradeoffs (InVEST) model was used to assess five key ESs: water yield (WY), carbon storage (CS), water quality purification (ND), soil retention (SR), and habitat quality (HQ). Ecosystem service bundles (ESBs) were identified using a self-organizing map (SOM) approach, and nonlinear relationships between landscape pattern indices and ESs were examined using the Boosted Regression Tree (BRT) model combined with spearman correlation and clustered heatmap analyses. The results indicated that the landscape pattern of Qilian Mountain National Park exhibits a clear east to west gradient. The spatiotemporal dynamics of ESs showed divergent trends, with CS and ND consistently improving, whereas WY exhibited pronounced nonlinear fluctuations. ESBs were classified into four types: ESB I (ecosystem transition bundle), ESB II (ecosystem regulation and protection bundle), ESB III (ecosystem degradation and protection bundle), and ESB IV (ecosystem restoration bundle), reflecting a shift from single function dominance toward multifunctional synergies. A nonlinear coupling relationship existed between landscape pattern indices and total ecosystem services (TES), characterized by a notable decline in TES and continued degradation of ES performance and stability. Together, this study provides a robust scientific foundation for developing differentiated zoning management strategies. The findings deliver valuable scientific insights for the management of ESs in the Qilian Mountain National Park and similar mountain ecosystems, while offering a reference for promoting sustainable development in fragile ecological regions worldwide.
PEI Ruian, MA Binbin, SU Jingjing, HOU Xiaohua, ZHANG Yike. Nonlinear effects and threshold regulation of landscape pattern indices on ecosystem services: a case study of Qilian Mountain National Park. Journal of Arid Land, 2026, 18(6): 968-993.
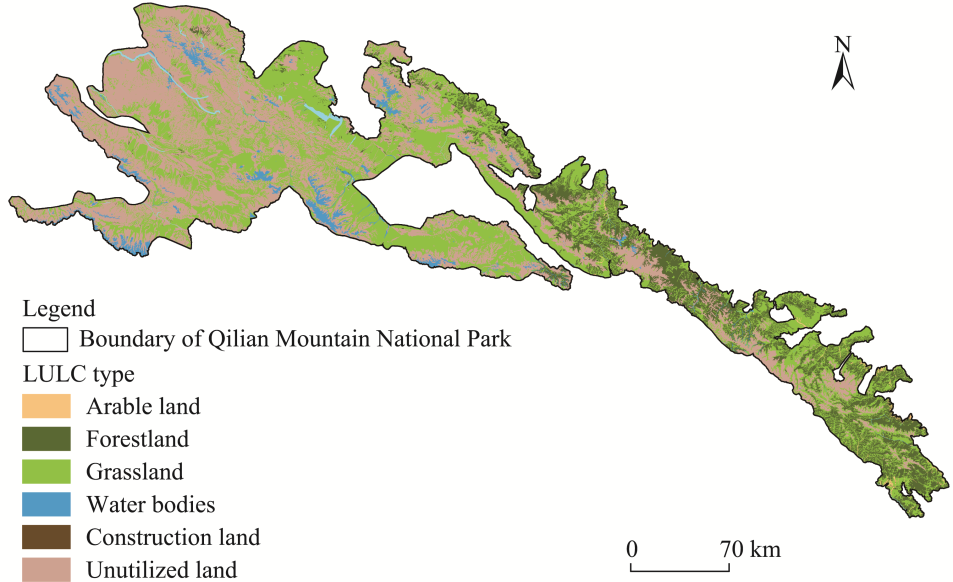
Fig. 1Spatial distribution of the land use/land cover (LULC) types in the Qilian Mountain National Park. The LULC data were obtained from the Resource and Environmental Science Data Platform (https://www.resdc.cn).
Data type
Period
Spatial resolution
Data source
Land use/land cover (LULC)
2000-2020
30 m
Resource and Environmental Science Data Platform (http://www.resdc.cn)
Landsat 5 TM
2000-2020
30 m
United States Geological Survey (https://www.usgs.oov)
Landsat 8 OLI
2000-2020
30 m
United States Geological Survey (https://www.usgs.oov)
Digital elevation model (DEM)
/
30 m
Geospatial Data Cloud (http://www.gscloud.cn)
Precipitation
2000-2020
1 km
National Earth System Science Data Center (http://www.geodata.cn)
Soid data
2009
1 km
Soil dataset for China Based on the World Soil Database (http://eco.gssdc.cn)
Potential evapotranspiration (PET)
2000-2020
1 km
National Earth System Science Data Center (http://www.geodata.cn )
Administrative boundaries
/
/
Resource and Environmental Science Data Platform (http://www.resdc.cn)
Basin data
2000-2020
1 km
Resource and Environmental Science Data Platform (http://www.resdc.cn)
Table 1 Description of data sources
Index
Definition
Formula
Formula notation
Patch density (PD; number/km2)
Number of patches per unit area
$\text{PD}=\text{N}/\text{A}$
N is the number of landscape patches; and A is the total area of the landscape (km2).
Largest Patch Index (LPI; %)
Maximum patch size as a proportion of total landscape area
Pi is the area share of patch type i; and m is the total number of patch types.
Table 2 Detials of the five landscape pattern metrics
Module
Parameter name
Arable land
Forestland
Grassland
Water bodies
Constructon Land
Unutilized Land
Water yield
Root_depth (mm)
2100
6000
2600
1
1
1500
Kc
0.65
1.00
0.85
1.00
0.30
0.50
LULC_veg
1
1
1
0
0
1
Carbon storage
Caboveground (t/hm2)
4.56
51.08
1.02
0.00
0.00
0.12
Cunderground (t/hm2)
7.45
37.51
6.15
0.00
0.00
1.57
Csoil (t/hm2)
106.30
174.95
128.51
170.27
0.00
1.57
Cdead (t/hm2)
3.67
6.71
3.30
0.00
0.00
0.00
Soil retention
C
0.31
0.05
0.14
1.00
1.00
0.90
P
0.5
1.0
1.0
0.6
1.0
0.0
Water quality purification
TN (kg/(hm2•a))
37
40
81
25
30
107
TP (kg/(hm2•a))
4.0
3.5
7.0
0.4
3.0
6.0
TN/TP retention efficiency
0.45
0.40
0.95
0.05
0.10
0.70
Table 3 Details of parameter settings for different LULC types in different modules
Threat factor
Maximum influence distance (km)
Weight
Attenuation type
Arable land
4
0.6
Linear
Construction land
6
0.6
Exponential
Unutilized land
7
0.7
Exponential
Table 4 Threat factors of habitat quality in this study
LULC type
Habitat suitability
Habitat sensitivity
Arable land
Construction land
Unutilized land
Arable land
0.50
0.30
0.40
0.40
Forestland
1.00
0.75
0.80
0.80
Grassland
0.80
0.50
0.50
0.50
Water bodies
1.00
0.70
0.80
0.80
Construction land
0.00
0.00
0.00
0.00
Unutilized land
0.30
0.30
0.30
0.30
Table 5 Habitat suitability and sensitivity to threat factors for different LULC types
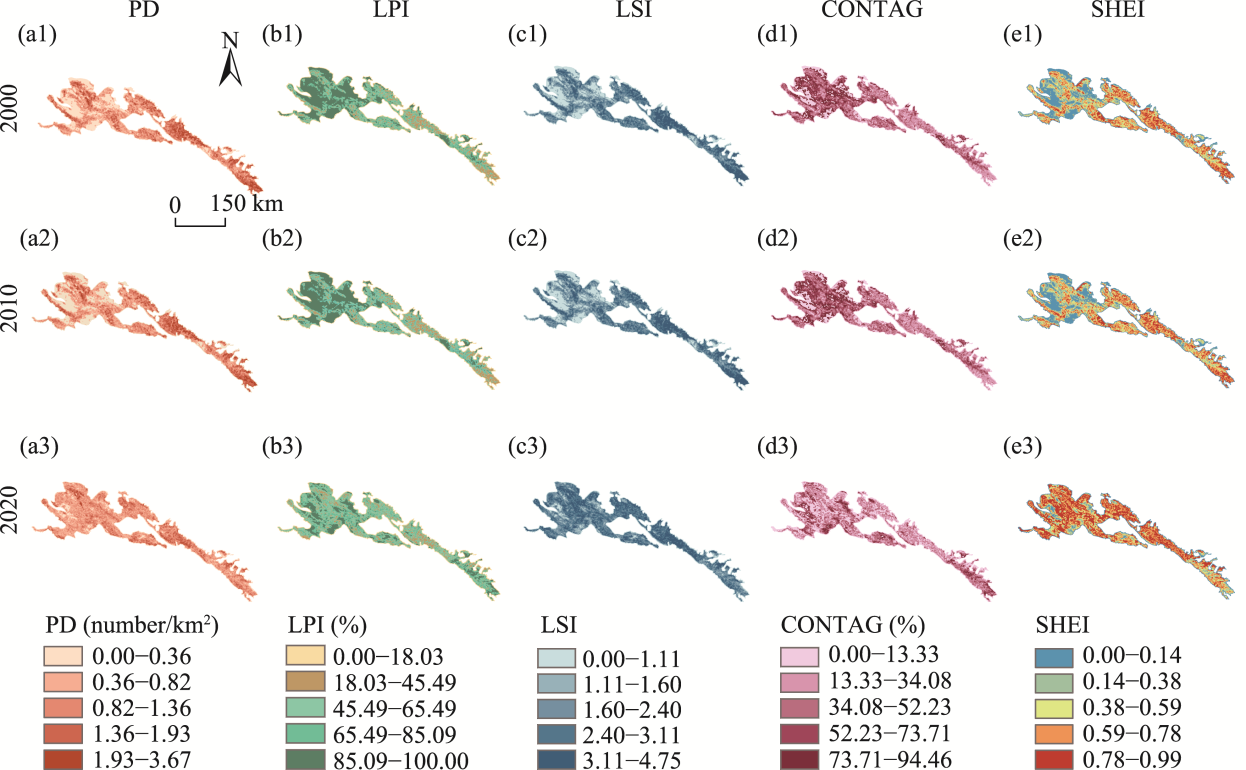
Fig. 2Spatial distributions of patch density (PD), Largest Patch Index (LPI), Landscape Shape Index (LSI), Contagion Index (CONTAG), and Shannon Evenness Index (SHEI) in the Qilian Mountain National Park in 2000 (a1-e1), 2010 (a2-e2), and 2020 (a3-e3)
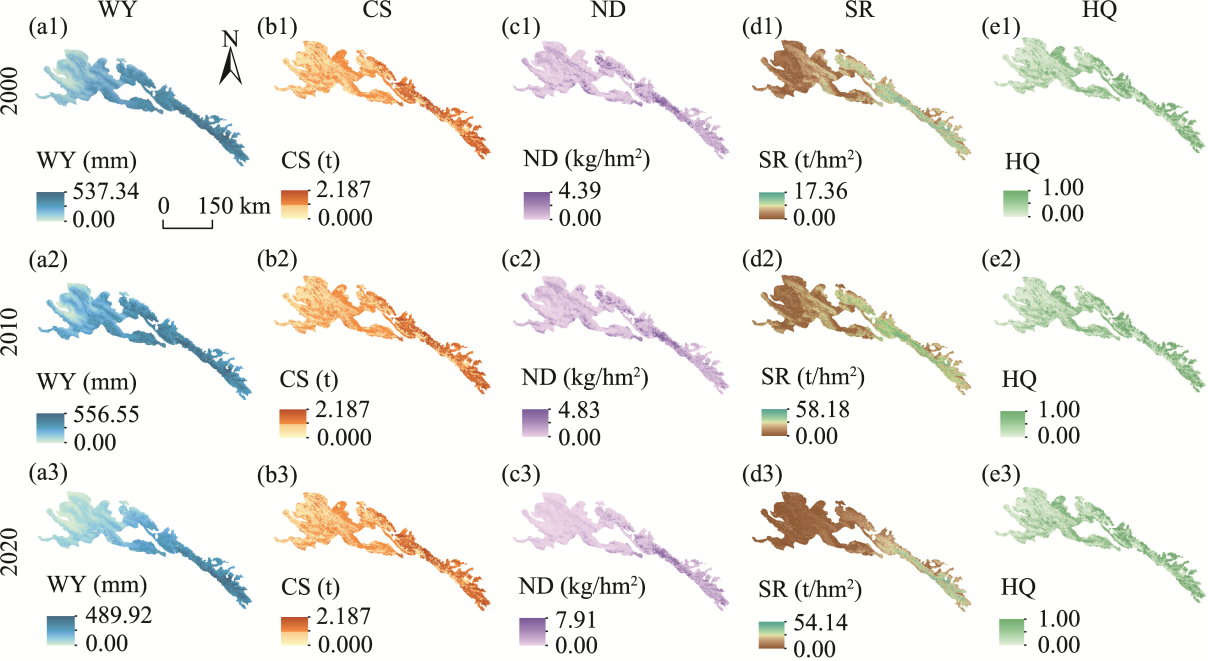
Fig. 3Spatial distributions of water yield (WY), carbon storage (CS), water quality purification (ND), soil retention (SR), and habitat quality (HQ) within the Qilian Mountain National Park in 2000 (a1-e1), 2010 (a2-e2), and 2020 (a3-e3)
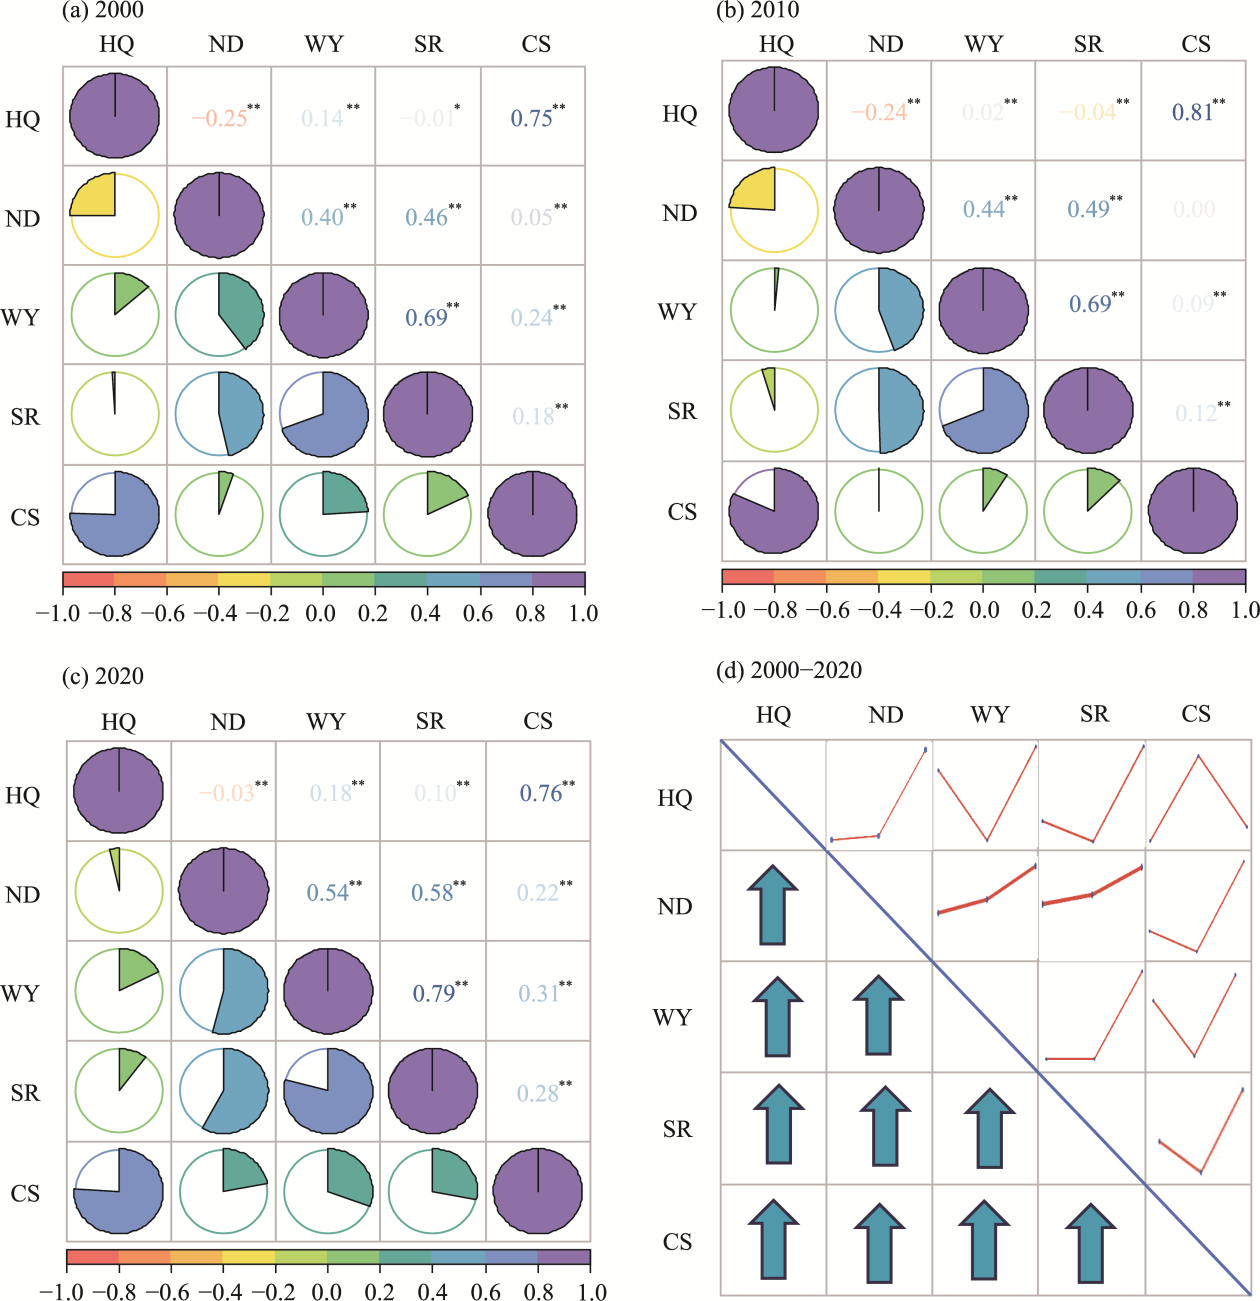
Fig. 4Quantitative relationships among ESs in the Qilian Mountain National Park in 2000 (a), 2010 (b), and 2020 (c), as well as the tendency from 2000 to 2020 (d). In the pie charts, larger sectors indicate stronger correlation strengths. Correlations with statistical significance are denoted by asterisks (*, P<0.050 level; **, P<0.010 level). Synergistic enhancements are depicted by blue vectors, while temporal dynamics are illustrated by red connecting elements.
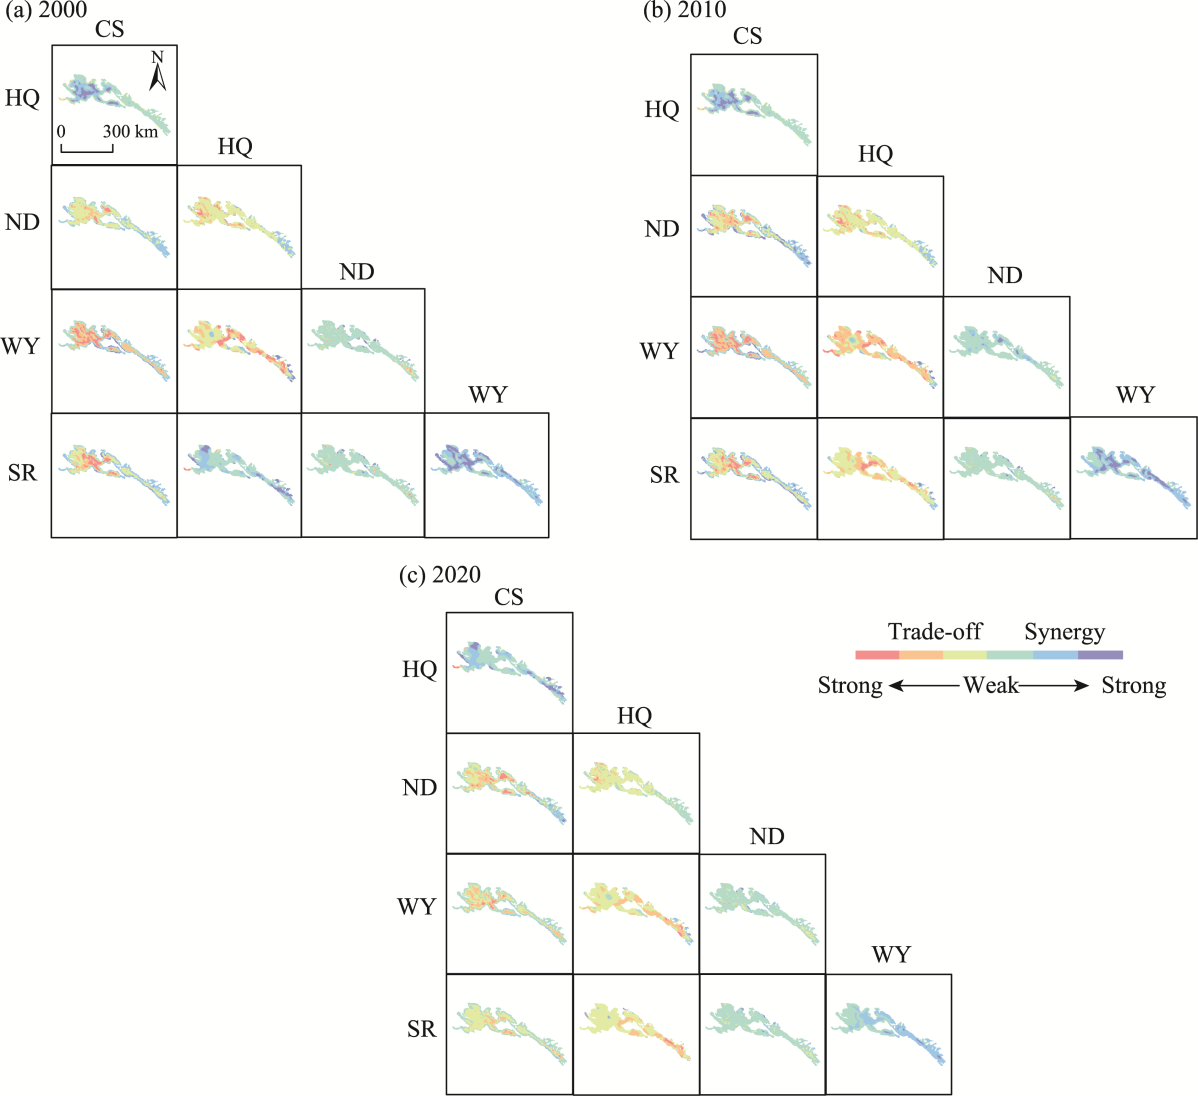
Fig. 5Spatial distributions of ES trade-offs and synergies in the Qilian Mountain National Park in 2000 (a), 2010 (b), and 2020 (c)
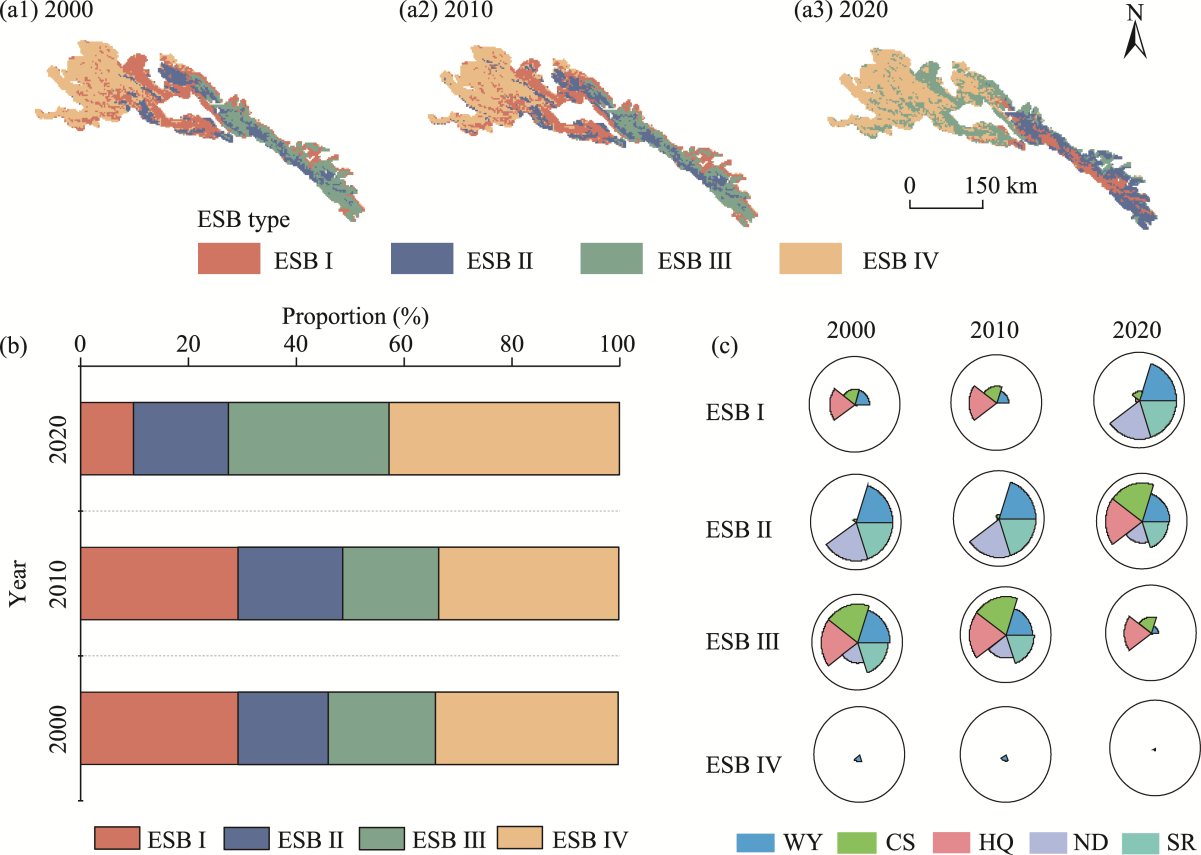
Fig. 6Spatiotemporal distributions of ecosystem service bundles (ESBs; a1-a3), proportions of each ESB type (b), and composition of ESs within each ESB type (c) in 2000, 2010, and 2020. ESB Ⅰ indicates the ecosystem transition bundle; ESB Ⅱ indiates the ecosystem regulation and protection bundle, ESB Ⅲ indicates the ecosystem degradation and protection bundle; and ESB Ⅳ indicates the ecosystem restoration bundle. The angular width of each sector denotes the relative contribution of the corresponding ES within the bundle, while the radial length represents the normalized mean supply level of that ES within the bundle.
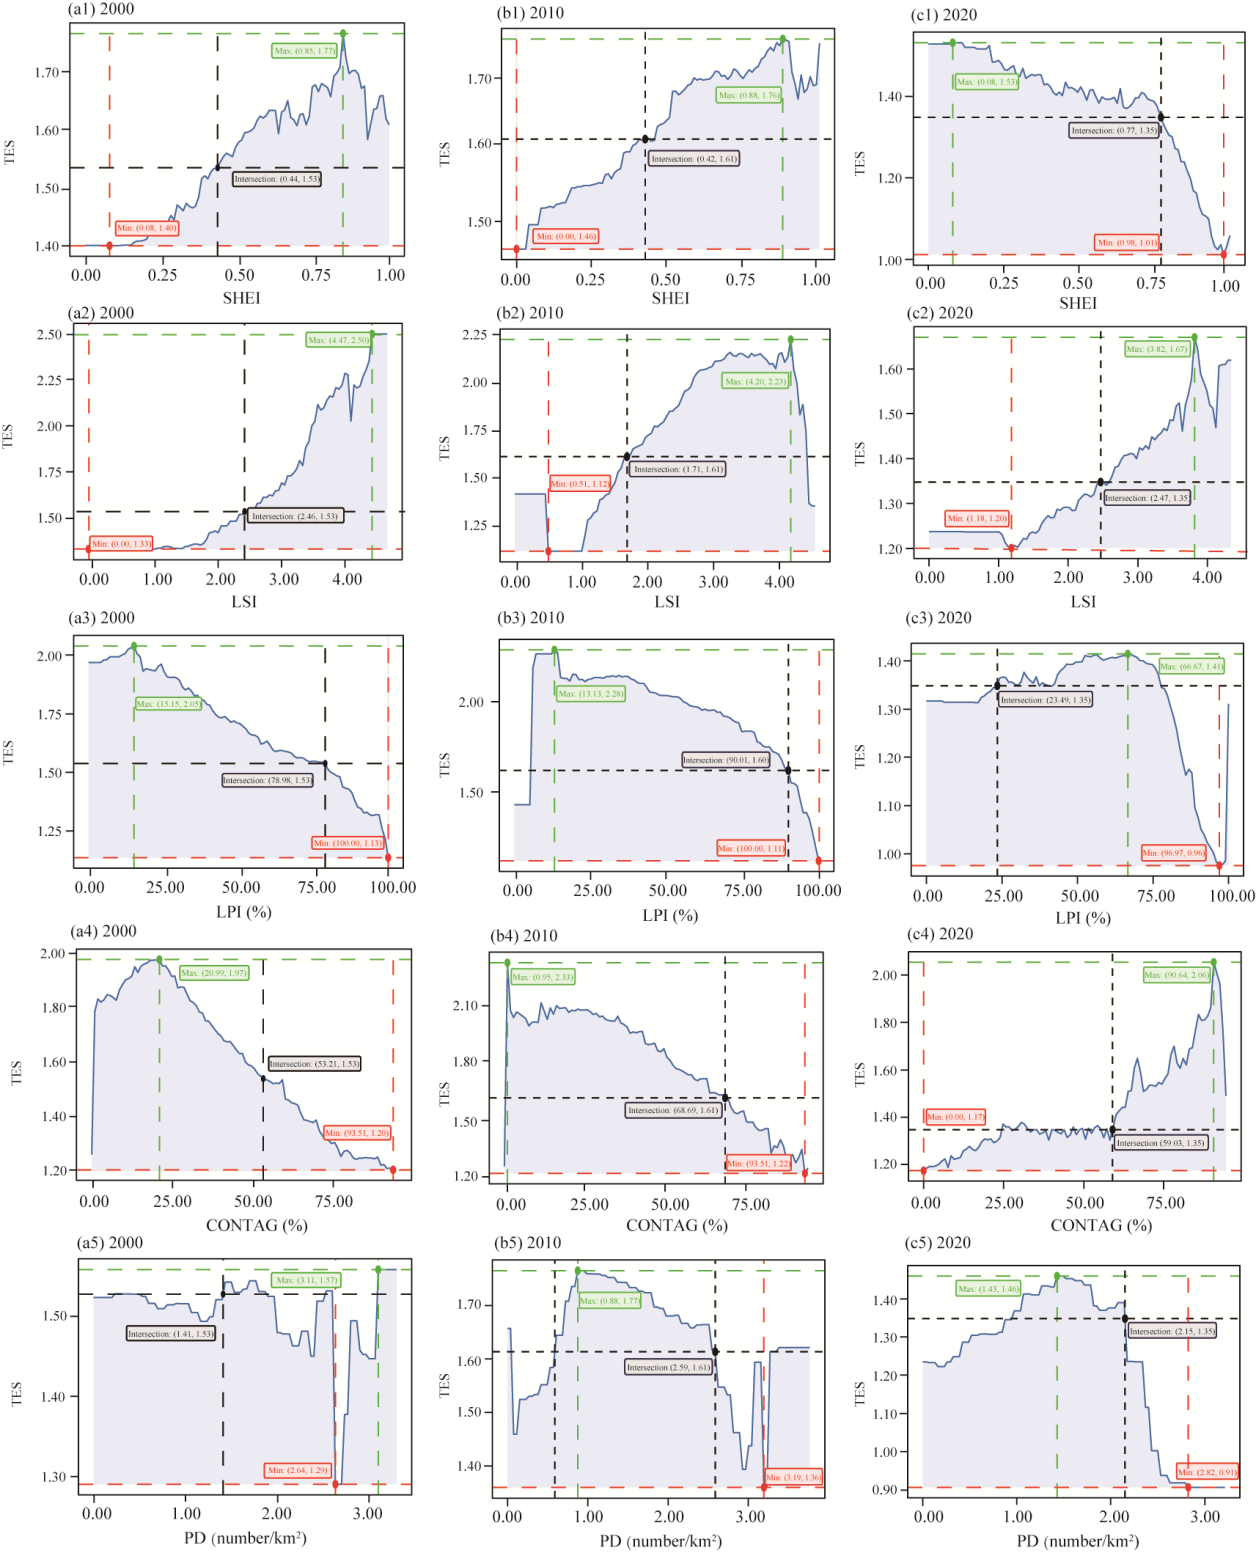
Fig. 7Nonlinear impacts of SHEI, LSI, LPI, CONTAG, and PD on total ecosystem services (TES) and identification of critical thresholds in the Qilian Mountain National Park in 2000 (a1-a5), 2010 (b1-b5), and 2020 (c1-c5). "Max" denotes the coordinates of the point where the maximum TES is located; "Min" denotes the coordinates of the point where the minimum TES is located; "Intersection" denotes the coordinates of the critical threshold point in the nonlinear response of TES to each landscape pattern index.
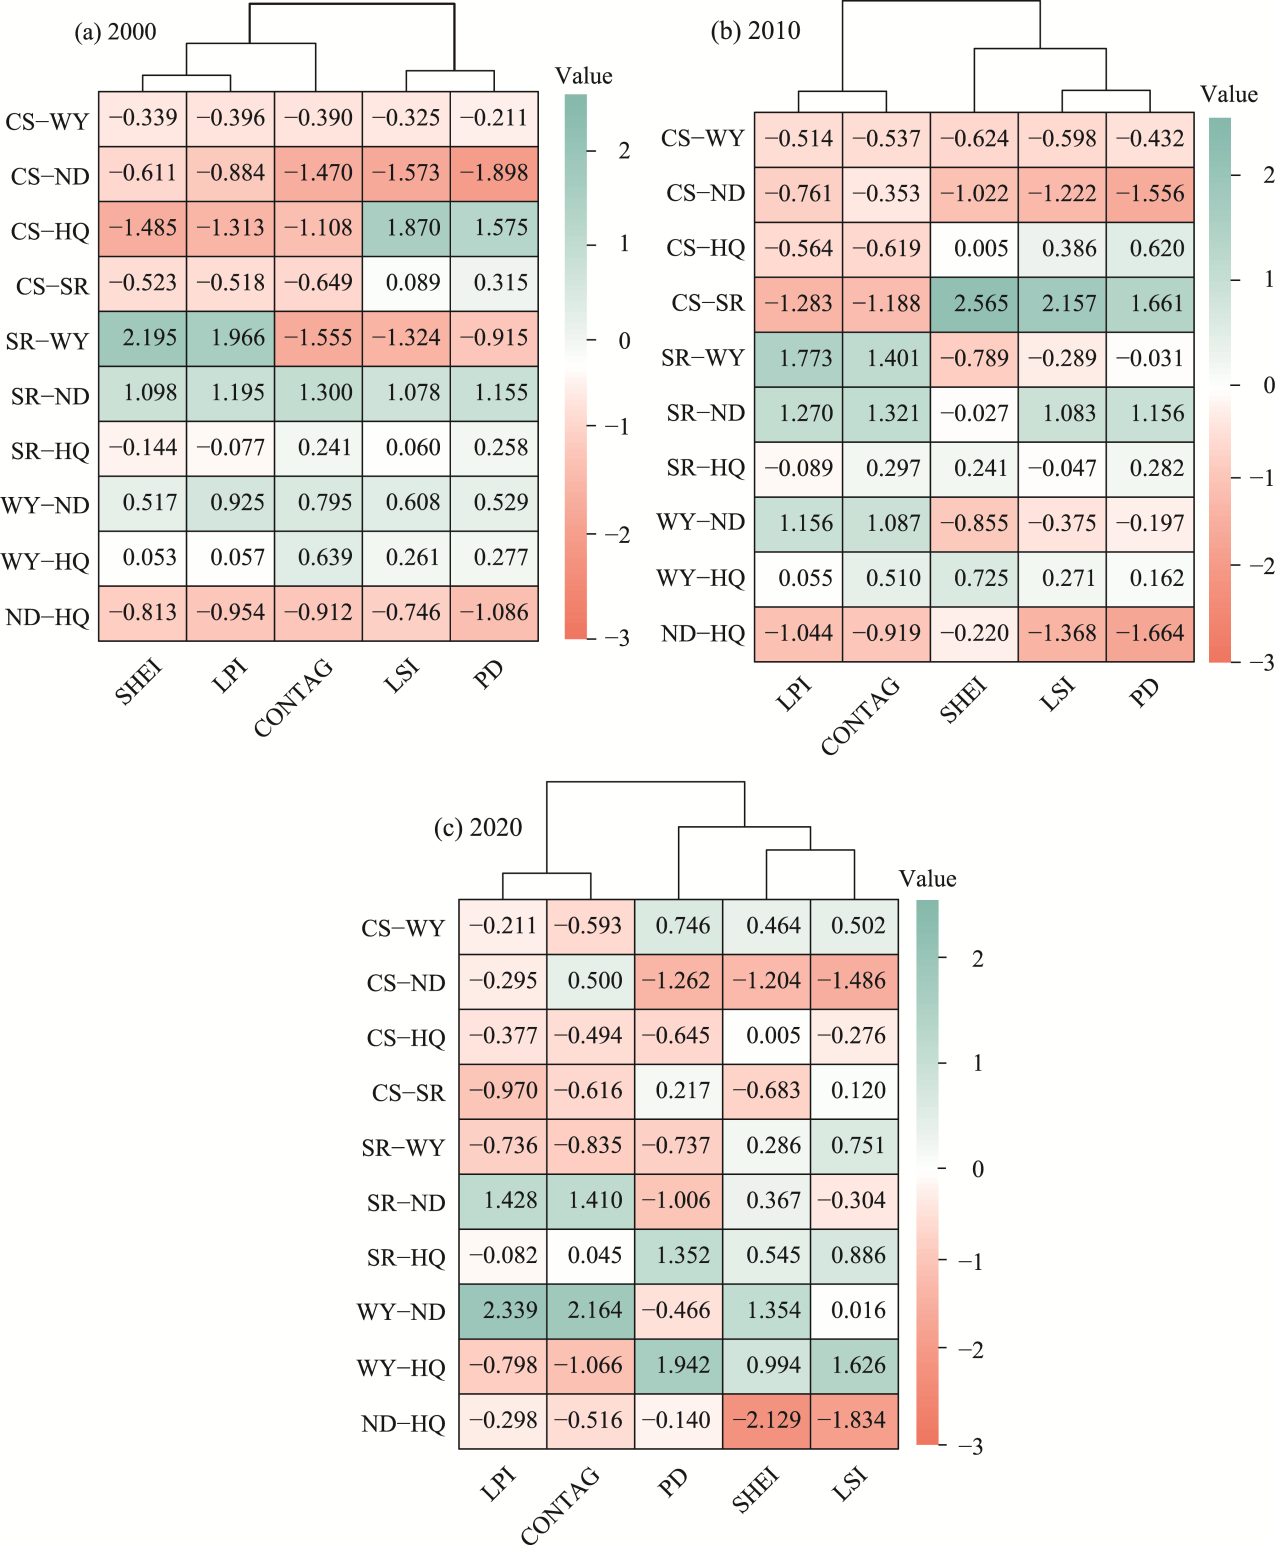
Fig. 8Clustered heatmap of the associations between ES trade-offs and synergies and landscape pattern indices in 2000 (a), 2010 (b), and 2020 (c). Hierarchical clustering tree represents similarity. The closer the branches are, the more similar the response patterns are.
[1]
Bai J, Wang X F, Tu Y, et al. 2025a. Integration of ecosystem service composite index and driving thresholds for ecological zoning management: A case study of Qinling-Daba Mountain, China. Journal of Environmental Management, 384: 125309, doi: 10.1016/j.jenvman.2025.125309.
[2]
Bai J H, Wang J L, Chen J, et al. 2025b. Spatiotemporal variations and driving mechanisms of flash droughts during 1981-2020 in the Qilian Mountains, China. Journal of Arid Land, 17(4): 481-499.
[3]
Bai L L, Wang W Y, De Q L M, et al. 2024. Elevational variations in ecological soil C, N, and pstoichiometry among five typical vegetation types in the Qilian Mountains. Arid Zone Research, 41(3): 445-455. (in Chinese)
[4]
Beer C, Reichstein M, Tomelleri E, et al. 2010. Terrestrial gross carbon dioxide uptake: global distribution and covariation with climate. Science, 329(5993): 834-838.
[5]
Bennett E M, Peterson G D, Gordon L J. 2009. Understanding relationships among multiple ecosystem services. Ecology Letters, 12(12): 1394-1404.
[6]
Chen J C, Qi Q, Wang B Y, et al. 2023. Response of ecosystem services to landscape patterns under socio-economic-natural factor zoning: A case study of Hubei Province, China. Ecological Indicators, 153: 110417, doi: 10.1016/j.ecolind.2023.110417.
[7]
Chen W X, Zeng J, Chu Y M, et al. 2021. Impacts of landscape patterns on ecosystem services value: A multiscale buffer gradient analysis approach. Remote Sensing, 13(13): 2551, doi: 10.3390/rs13132551.
[8]
Chen X T, Jia Y F, Wang J N, et al. 2020. Current situation and function of soil conservation in national nature reserves in the Qilian Mountains based on InVEST model. Arid Zone Research, 37(1): 151-159. (in Chinese)
[9]
Cheng K, Yang H T, Tao S L, et al. 2024. Carbon storage through China's planted forest expansion. Nature Communications, 15(1): 4106, doi: 10.1038/s41467-024-48546-0.
[10]
Chi Y, Shi H H, Wang E K, et al. 2017. Landscape pattern characteristics and ecological effects on five northern islands of Miaodao Archipelago. Acta Ecologica Sinica, 37(4): 1271-1285. (in Chinese)
[11]
Dou H S, Li X B, Li S K, et al. 2020. Mapping ecosystem services bundles for analyzing spatial trade-offs in inner Mongolia, China. Journal of Cleaner Production, 256: 120444, doi: 10.1016/j.jclepro.2020.120444.
[12]
Duan T L, Li N, Huang Z P, et al. 2024. Progress of China's national park construction and development prospects. Acta Ecologica Sinica, 44(12): 4964-4972. (in Chinese)
[13]
Duan X Y, Chen Y, Wang L Q, et al. 2023. The impact of land use and land cover changes on the landscape pattern and ecosystem service value in Sanjiangyuan region of the Qinghai-Tibet Plateau. Journal of Environmental Management, 325: 116539, doi: 10.1016/j.jenvman.2022.116539.
[14]
Deng Z. 2022. Spatial-temporal evolution and prediction of carbon storage in Qilian Mountain National Park based on land use change. MSc Thesis. Lanzhou: Lanzhou University. (in Chinese)
[15]
Fahrig L. 2003. Effects of habitat fragmentation on biodiversity. Annual Review of Ecology, Evolution, and Systematics, 34(1): 487-515.
[16]
Feld C K, Silva P M, Sousa J P, et al. 2009. Indicators of biodiversity and ecosystem services: a synthesis across ecosystems and spatial scales. Oikos, 118(12): 1862-1871.
[17]
Folke C, Carpenter S, Walker B, et al. 2004. Regime shifts, resilience, and biodiversity in ecosystem management. Annual Review of Ecology, Evolution, and Systematics, 35(1): 557-581.
[18]
Gao Y, Wang Z Y, Li C. 2024. Assessing spatio-temporal heterogeneity and drivers of ecosystem services to support zonal management in mountainous cities. Science of The Total Environment, 954: 176328, doi: 10.1016/j.scitotenv.2024.176328.
[19]
Guo S S, Wu C Y, Wang Y H, et al. 2022. Threshold effect of ecosystem services in response to climate change, human activity and landscape pattern in the upper and middle Yellow River of China. Ecological Indicators, 136: 108603, doi: 10.1016/j.ecolind.2022.108603.
[20]
Han W H. 2022. A study of ecosystem service functions and their drivers in Qilian Mountain National Park based on the InVEST model, Northwest Normal University, Lanzhou, 25-38. (in Chinese)
[21]
Hao R F, Yu D Y, Liu Y P, et al. 2017. Impacts of changes in climate and landscape pattern on ecosystem services. Science of The Total Environment, 579: 718-728.
[22]
Hao Y Q, Liu Y H, Dang H, et al. 2025. Optimizing zonal management framework suitable for mountain ecosystems by linking landscape, ecosystem service capacities and bundles nested. Journal of Environmental Management, 389: 125998, doi: 10.1016/j.jenvman.2025.125998.
[23]
Himes A, Muraca B. 2018. Relational values: the key to pluralistic valuation of ecosystem services. Current Opinion in Environmental Sustainability, 35: 1-7.
[24]
Hobbs R J, Harris J A. 2001. Restoration ecology: repairing the earth's ecosystems in the new millennium. Restoration Ecology, 9(2): 239-246.
[25]
Hou W J, Gao J B. 2020. Spatially variable relationships between karst landscape pattern and vegetation activities. Remote Sensing, 12(7): 1134, doi: 10.3390/rs12071134.
[26]
Huang X X. 2022. Study on the function of water conservation and soil conservation in Qilian Mountain National Park. MSc Thesis. Lanzhou: Lanzhou University, 30-45. (in Chinese)
[27]
Jia J, Wanf L, Yao Y L, et al. 2025. Nonlinear relationships between canopy structure and cooling effects in urban forests: Insights from 3D structural diversity at the single tree and community scales. Sustainable Cities and Society, 118: 106012, doi: 10.1016/j.scs.2024.106012.
[28]
Li M Y, Li X B, Liu S Y, et al. 2022. Analysis of the spatiotemporal variation of landscape patterns and their driving factors in inner Mongolia from 2000 to 2015. Land, 11(9): 1410, doi: 10.3390/land11091410.
[29]
Li N L, Zhao F K, Chen S S, et al. 2024. Indirect non-linear effects of landscape patterns on vegetation growth in Kunming City. npj Urban Sustainability, 4: 30, doi: 10.1038/s42949-024-00165-w.
[30]
Li X Z, Bu R C, Chang Y, et al. 2004. Response of landscape pattern indices to different landscape configurations. Acta Ecologica Sinica, 24(1): 123-134. (in Chinese)
[31]
Li Y, Luo H F. 2023. Trade-off/synergistic changes in ecosystem services and geographical detection of its driving factors in typical karst areas in southern China. Ecological Indicators, 154: 110811, doi: 10.1016/j.ecolind.2023.110811.
[32]
Li Z H, Xia J, Deng X Z, et al. 2021a. Multilevel modelling of impacts of human and natural factors on ecosystem services change in an oasis, Northwest China. Resources, Conservation and Recycling, 169: 105474, doi: 10.1016/j.resconrec.2021.105474.
[33]
Li Z X, Feng Q, Li Z J, et al. 2021b. Reversing conflict between humans and the environment—The experience in the Qilian Mountains. Renewable and Sustainable Energy Reviews, 148: 111333, doi: 10.1016/j.rser.2021.111333.
[34]
Liang Z J, Tang W L, Liang L J, et al. 2022. Ideas and countermeasures for the implementation of mountain closure and prohibition of pastoralism in the Qilian Mountains—Taking Zhangye City as an example. In: Ding WG, Gou XH, LiY. Annual Report on Development of Qilian Ecosystem. Beijing: Social Sciences Academic Press, 270-284. (in Chinese)
[35]
Liao L Y, Lu B, Cao Y. 2023. Spatial and temporal dynamics and spatial correlation analysis of landscape pattern and habitat quality surrounding Wuyishan National Park. Chinese Landscape Architecture, 39(12): 21-27. (in Chinese)
[36]
Liao Z M, Yue C, He B B, et al. 2024. Growing biomass carbon stock in China driven by expansion and conservation of woody areas. Nature Geoscience, 17(11): 1127-1134.
[37]
Liu K M. 2021. Study on the change and stability of landscape pattern in Qilian Mountain Nature Reserve. MSc Thesis. Lanzhou: Lanzhou University, 22-36. (in Chinese)
[38]
Liu S J, Wang Z J, Wu W, et al. 2022. Effects of landscape pattern change on ecosystem services and its interactions in karst cities: A case study of Guiyang City in China. Ecological Indicators, 145: 109646, doi: 10.1016/j.ecolind.2022.109646.
[39]
Lu B B, Charlton M, Harris P, et al. 2014. Geographically weighted regression with a non-Euclidean distance metric: a case study using hedonic house price data. International Journal of Geographical Information Science, 28(4): 660-681.
[40]
Lu B B, Ge Y, Qin K, et al. 2020. A review on geographically weighted regression. Geomatics and Information Science of Wuhan University, 45(9): 1356-1365. (in Chinese)
[41]
Lu S B, Zhu W H, Li H N. 2012. Study on wetland classification and distribution in Changbai Mountain Nature Reserve based on 3S. Geography and Geo-Information Science, 28(6): 57-61. (in Chinese)
[42]
Lyu R F, Clarke K C, Zhang J M, et al. 2021a. Dynamics of spatial relationships among ecosystem services and their determinants: Implications for land use system reform in Northwestern China. Land Use Policy, 102: 105231, doi: 10.1016/j.landusepol.2020.105231.
[43]
Lyu R F, Zhao W P, Tian X L, et al. 2021b. The trade-offs among ecosystem services and their response to socio-ecological environment in Qilian Mountains. Journal of Glaciology and Geocryology, 43(3): 928-938. (in Chinese)
[44]
Lyu R F, Zhao W P, Tian X L, et al. 2022. Non-linearity impacts of landscape pattern on ecosystem services and their trade-offs: A case study in the City Belt along the Yellow River in Ningxia, China. Ecological Indicators, 136: 108608, doi: 10.1016/j.ecolind.2022.108608.
[45]
Ma J H. 2023. The response of ecosystem services to changing landscape patterns on the Qinghai-Tibet Plateau—A case study from eastern Qinghai Province. MSc Thesis. Xi'an: Chang'an University, 27-45. (in Chinese)
[46]
Ma K, Wang C, Zhang G Z, et al. 2022. 2017-2019 Qilian Mountain typical reservoir water pollution characteristics and water quality evaluation. Environmental Chemistry, 41(11): 3569-3578. (in Chinese)
[47]
MEA (Millennium Ecosystem Assessment). 2005. Ecosystems and Human Well-being:Synthesis. Washington, DC: Island Press, 270-284.
[48]
Mouchet M A, Lamarque P, Martín-López B, et al. 2014. An interdisciplinary methodological guide for quantifying associations between ecosystem services. Global Environmental Change, 28: 298-308.
[49]
Mitchell M G E, Bennett E M, Gonzalez A. 2015. Strong and nonlinear effects of fragmentation on ecosystem service provision at multiple scales. Environmental Research Letters, 10(9): 094014, doi: 10.1088/1748-9326/10/9/094014.
[50]
Nelson E, Mendoza G, Regetz J, et al. 2009. Modeling multiple ecosystem services, biodiversity conservation, commodity production, and tradeoffs at landscape scales. Frontiers in Ecology and the Environment, 7(1): 4-11.
[51]
Nian Y Y, He Z Y, Zhang W H, et al. 2023. Land cover changes of the Qilian Mountain National Park in Northwest China based on phenological features and sample migration from 1990 to 2020. Remote Sensing, 15(4): 1074, doi: 10.3390/rs15041074.
[52]
Ning Q M, He Z Q, Hu R, et al. 2024. Spatiotemporal differentiation of ecological statusand influencing factors in Dongting Lake Basin. Acta Ecoligica Sinica, 44(18): 8072-8083. (in Chinese)
[53]
Pan W Q, Wu C Z. 2025. International experiences and implications of spatial use regulation in national parks. Chinese Landscape Architecture, doi: 11.2165.tu.20251104.1652.002. (in Chinese)
[54]
Pei R A, Ma B B, Liu S X, et al. 2024. Spatiotemporal differentiation and trade-offs and synergies of ecosystem services in Qilian Mountains National Park. Ecological Indicators, 169: 112891, doi: 10.1016/j.ecolind.2024.112891.
[55]
Peng J, Tian L, Liu Y X, et al. 2017. Ecosystem services response to urbanization in metropolitan areas: Thresholds identification. Science of The Total Environment, 607-608: 706-714.
[56]
Peng Q, Wang R H, Jiang Y L, et al. 2022. Soil erosion in Qilian Mountain National Park: Dynamics and driving mechanisms. Journal of Hydrology: Regional Studies, 42: 101144, doi: 10.1016/j.ejrh.2022.101144.
[57]
Qiao B, Yang H, Cao X Y, et al. 2025. Driving mechanisms and threshold identification of landscape ecological risk: A nonlinear perspective from the Qilian Mountains, China. Ecological Indicators, 173: 113342, doi: 10.1016/j.ecolind.2025.113342.
[58]
Qiao X N, Gu Y Y, Zou C X, et al. 2019. Temporal variation and spatial scale dependency of the trade-offs and synergies among multiple ecosystem services in the Taihu Lake Basin of China. Science of The Total Environment, 651: 218-229.
[59]
Raudsepp-Hearne C, Peterson G D, Bennett E M. 2010. Ecosystem service bundles for analyzing tradeoffs in diverse landscapes. Proceedings of the National Academy of Sciences, 107(11): 5242-5247.
[60]
Ren B F, Park K, Shrestha A, et al. 2022. Impact of human disturbances on the spatial heterogeneity of landscape fragmentation in Qilian Mountain National Park, China. Land, 11(11): 2087, doi: 10.3390/land11112087.
[61]
Sala O E, Stuart Chapin F, Armesto J J, et al. 2000. Global biodiversity scenarios for the year 2100. Science, 287(5459): 1770-1774.
[62]
Spake R, Lasseur R, Crouzat E, et al. 2017. Unpacking ecosystem service bundles: Towards predictive mapping of synergies and trade-offs between ecosystem services. Global Environmental Change, 47: 37-50.
[63]
Taylor P D, Fahrig L, Henein K, et al. 1993. Connectivity is a vital element of landscape structure. Oikos, 68(3): 571-573.
[64]
Turner M G, Gardner R H. 2015. Landscape Ecology in Theory and Practice:Pattern and Process. New York: Springer New York, 1-32.
[65]
Vaz A S, Kueffer C, Kull C A, et al. 2017. The progress of interdisciplinarity in invasion science. Ambio, 46(4): 428-442.
[66]
Wang C, Li K M, Yuan C X. 2024. Study of the effects of land use change on water yield in the Qilian Mountains in western China. Ecological Indicators, 158: 111464, doi: 10.1016/j.ecolind.2023.111464.
[67]
Wang H, Liu C L, Zang F, et al. 2023a. Remote sensing-based approach for the assessing of ecological environmental quality variations using google earth engine: A case study in the Qilian Mountains, Northwest China. Remote Sensing, 15(4): 960, doi: 10.3390/rs15040960.
[68]
Wang R H, Zhao W F, Peng Q, et al. 2022. Coupling of climate change and landscape patterns with ecosystem carbon storage—Taking the Qilian Mountains as an example. Arid Zone Research, 39(1): 251-257. (in Chinese)
[69]
Wang X Q, Zhao X Y. 2023. Impacts of human activities on ecosystem services in national parks: A case study of Qilian Mountain National Park. Journal of Natural Resources, 38(4): 966-982.
[70]
Wang Y, Meng J J, Qi Y, et al. 2015. Review of ecosystem management based on the InVEST model. Chinese Journal of Ecology, 34(12): 3526-3532. (in Chinese)
[71]
Wang Y P, Cheng H Y, Wang N A, et al. 2023b. Trade-off and synergy relationships and spatial bundle analysis of ecosystem services in the Qilian Mountains. Remote Sensing, 15(11): 2950, doi: 10.3390/rs15112950.
[72]
Wei C. 2023. Analysis and simulation of land use landscape pattern change in Qilian Mountains. MSc Thesis. Fuxin: Liaoning Technical University, 27-35. (in Chinese)
[73]
Wu J G, BRUCE JONES K, Li H, et al. 2006. Scaling and Uncertainty Analysis in Ecology:Methods and Applications. Dordrecht: Springer Netherlands, 3-15.
[74]
Wu J G. 2013. Landscape sustainability science: ecosystem services and human well-being in changing landscapes. Landscape Ecology, 28(6): 9991-1023.
[75]
Xia H, Yuan S F, Prishchepov A V. 2023. Spatial-temporal heterogeneity of ecosystem service interactions and their social-ecological drivers: Implications for spatial planning and management. Resources, Conservation and Recycling, 189: 106767, doi: 10.1016/j.resconrec.2022.106767.
[76]
Xu D Y, Wang P, Xie H S, et al. 2025. Functional zoning and spatial governance in national parks: experiences, evolution, and challenges. World Forestry Research, 38(5): 85-91. (in Chinese)
[77]
Yang H J. 2023. Assessment and adaptive management of ecosystem services in Qilian Mountain National Nature Reserve. PhD Dissertation. Lanzhou: Lanzhou University. (in Chinese)
[78]
Yang H J, Gou X H, Li Z L, et al. 2025. Assessing ecosystem services and their spillover effects to inform cost-benefit sharing and horizontal eco-compensation mechanisms in the Qilian Mountains, China. Ecosystem Services, 75: 101764, doi: 10.1016/j.ecoser.2025.101764.
[79]
Yang W Q, Yang P, Sun X, et al. 2022a. Changes of landscape pattern and its impacts on multiple ecosystem services in Beijing. Acta Ecologica Sinica, 42(16): 6488-6498. (in Chinese)
[80]
Yang Y H, Shi Y, Sun W J, et al. 2022b. Terrestrial carbon sinks in China and around the world and their contribution to carbon neutrality. Science China Life Sciences, 65(5): 861-895.
[81]
Yu M. 2022. Study on soil carbon and nitrogen storage characteristics and influencing factors in the south slope of Qilian Mountain. PhD Dissertation. Xining: Qinghai Normal University. (in Chinese)
[82]
Yuan L G, Geng M M, Li F, et al. 2024. Spatiotemporal characteristics and drivers of ecosystem service interactions in the Dongting Lake Basin. Science of The Total Environment, 926: 172012, doi: 10.1016/j.scitotenv.2024.172012.
[83]
Yue B R, Qian Z H. 2022. Formation mechanism of trade-offs and synergies between ecosystem services and application in landscape planning. Landscape Architecture, 29(10): 20-25.
[84]
Zhang G Q, Li C X, Li R J, et al. 2025a. Spatio-temporal evolution analysis of landscape pattern and habitat quality in the Qinghai Province section of the Yellow River Basin from 2000 to 2022 based on InVEST model. Journal of Arid Land, 16(9): 1183-1196.
[85]
Zhang H, Han H W, Li M, et al. 2021. Spatial-temporal variations of habitat quality in Qilian Mountain National Park. Chinese Journal of Ecology, 40(5): 1419-1430. (in Chinese)
[86]
Zhang M, Ma S A, Gong J W, et al. 2023. A coupling effect of landscape patterns on the spatial and temporal distribution of water ecosystem services: A case study in the Jianghuai ecological economic zone, China. Ecological Indicators, 151: 110299, doi:10.1016/j.ecolind.2023.110299.
[87]
Zhang T J, Zhang S P, Cao Q, et al. 2022a. The spatiotemporal dynamics of ecosystem services bundles and the social-economic-ecological drivers in the Yellow River Delta region. Ecological Indicators, 135: 108573, doi: 10.1016/j.ecolind.2022.108573.
[88]
Zhang W G, Gou X H, Gao L L, et al. 2022b. Relationship between growth and climate change of Qinghai spruce at Qilian Mountain forest line location. In: Ding WG, Gou XH, LiY. Annual Report on Development of Qilian Ecosystem. Beijing: Social Sciences Academic Press, 13-27. (in Chinese)
[89]
Zhang X B, Liu Y N, Yin J F, et al. 2025b. Multi-scenario simulation of land use change and its impact on ecosystem services in the northeastern edge of the Qinghai-Xizang Plateau, China. Journal of Arid Land, 17(2): 145-166.
[90]
Zhang Z Y, Tong Z M, Zhang L T, et al. 2024. Nonlinear effects of landscape pattern on ecosystem services and threshold regulation: a case study of ecoefficient synergistic zone in Fujian Provice. Acta Ecologica Sinica, 44(21): 9535-9551. (in Chinese)
[91]
Zhao W P, Lyu R F, Pang J L, et al. 2023. Spatial-temporal variability of ecosystem services in Qilian Mountains from 2000 to 2020. Journal of Glaciology and Geocryology, 45(4): 1367-1378. (in Chinese)
[92]
Zhao Y R, Zhou J J, Lei L, et al. 2019. Identification of drivers for water yield in the upstream of Shiyang River based on InVEST model. Chinese Journal of Ecology, 38(12): 3789-3799. (in Chinese)
[93]
Zhou T, Wang Q, Liang J L, et al. 2023. Impacts of landscape pattern on ecosystem services: A case study of the Hanjiang Eco-Economic Belt. World Regional Studies, 32(8): 152-165. (in Chinese)