| Research article |
|


|
|
|
| Spatiotemporal evolution of ecosystem services and ecological connectivity optimization in arid Northwest China |
HE Jing1,2, YU Yang1,2,3,*( ), SUN Lingxiao1,2, LI Chunlan1,2, GUO Zengkun1,3, LU Yuanbo1,3, Ireneusz MALIK2, Malgorzata WISTUBA2 ), SUN Lingxiao1,2, LI Chunlan1,2, GUO Zengkun1,3, LU Yuanbo1,3, Ireneusz MALIK2, Malgorzata WISTUBA2 |
1State Key Laboratory of Ecological Safety and Sustainable Development in Arid Lands, Xinjiang Institute of Ecology and Geography, Chinese Academy of Sciences, Urumqi 830011, China
2Polish-Chinese Centre for Environmental Research, Institute of Earth Sciences, University of Silesia in Katowice, Katowice 40-007, Poland
3University of Chinese Academy of Sciences, Beijing 100049, China |
|
|
|
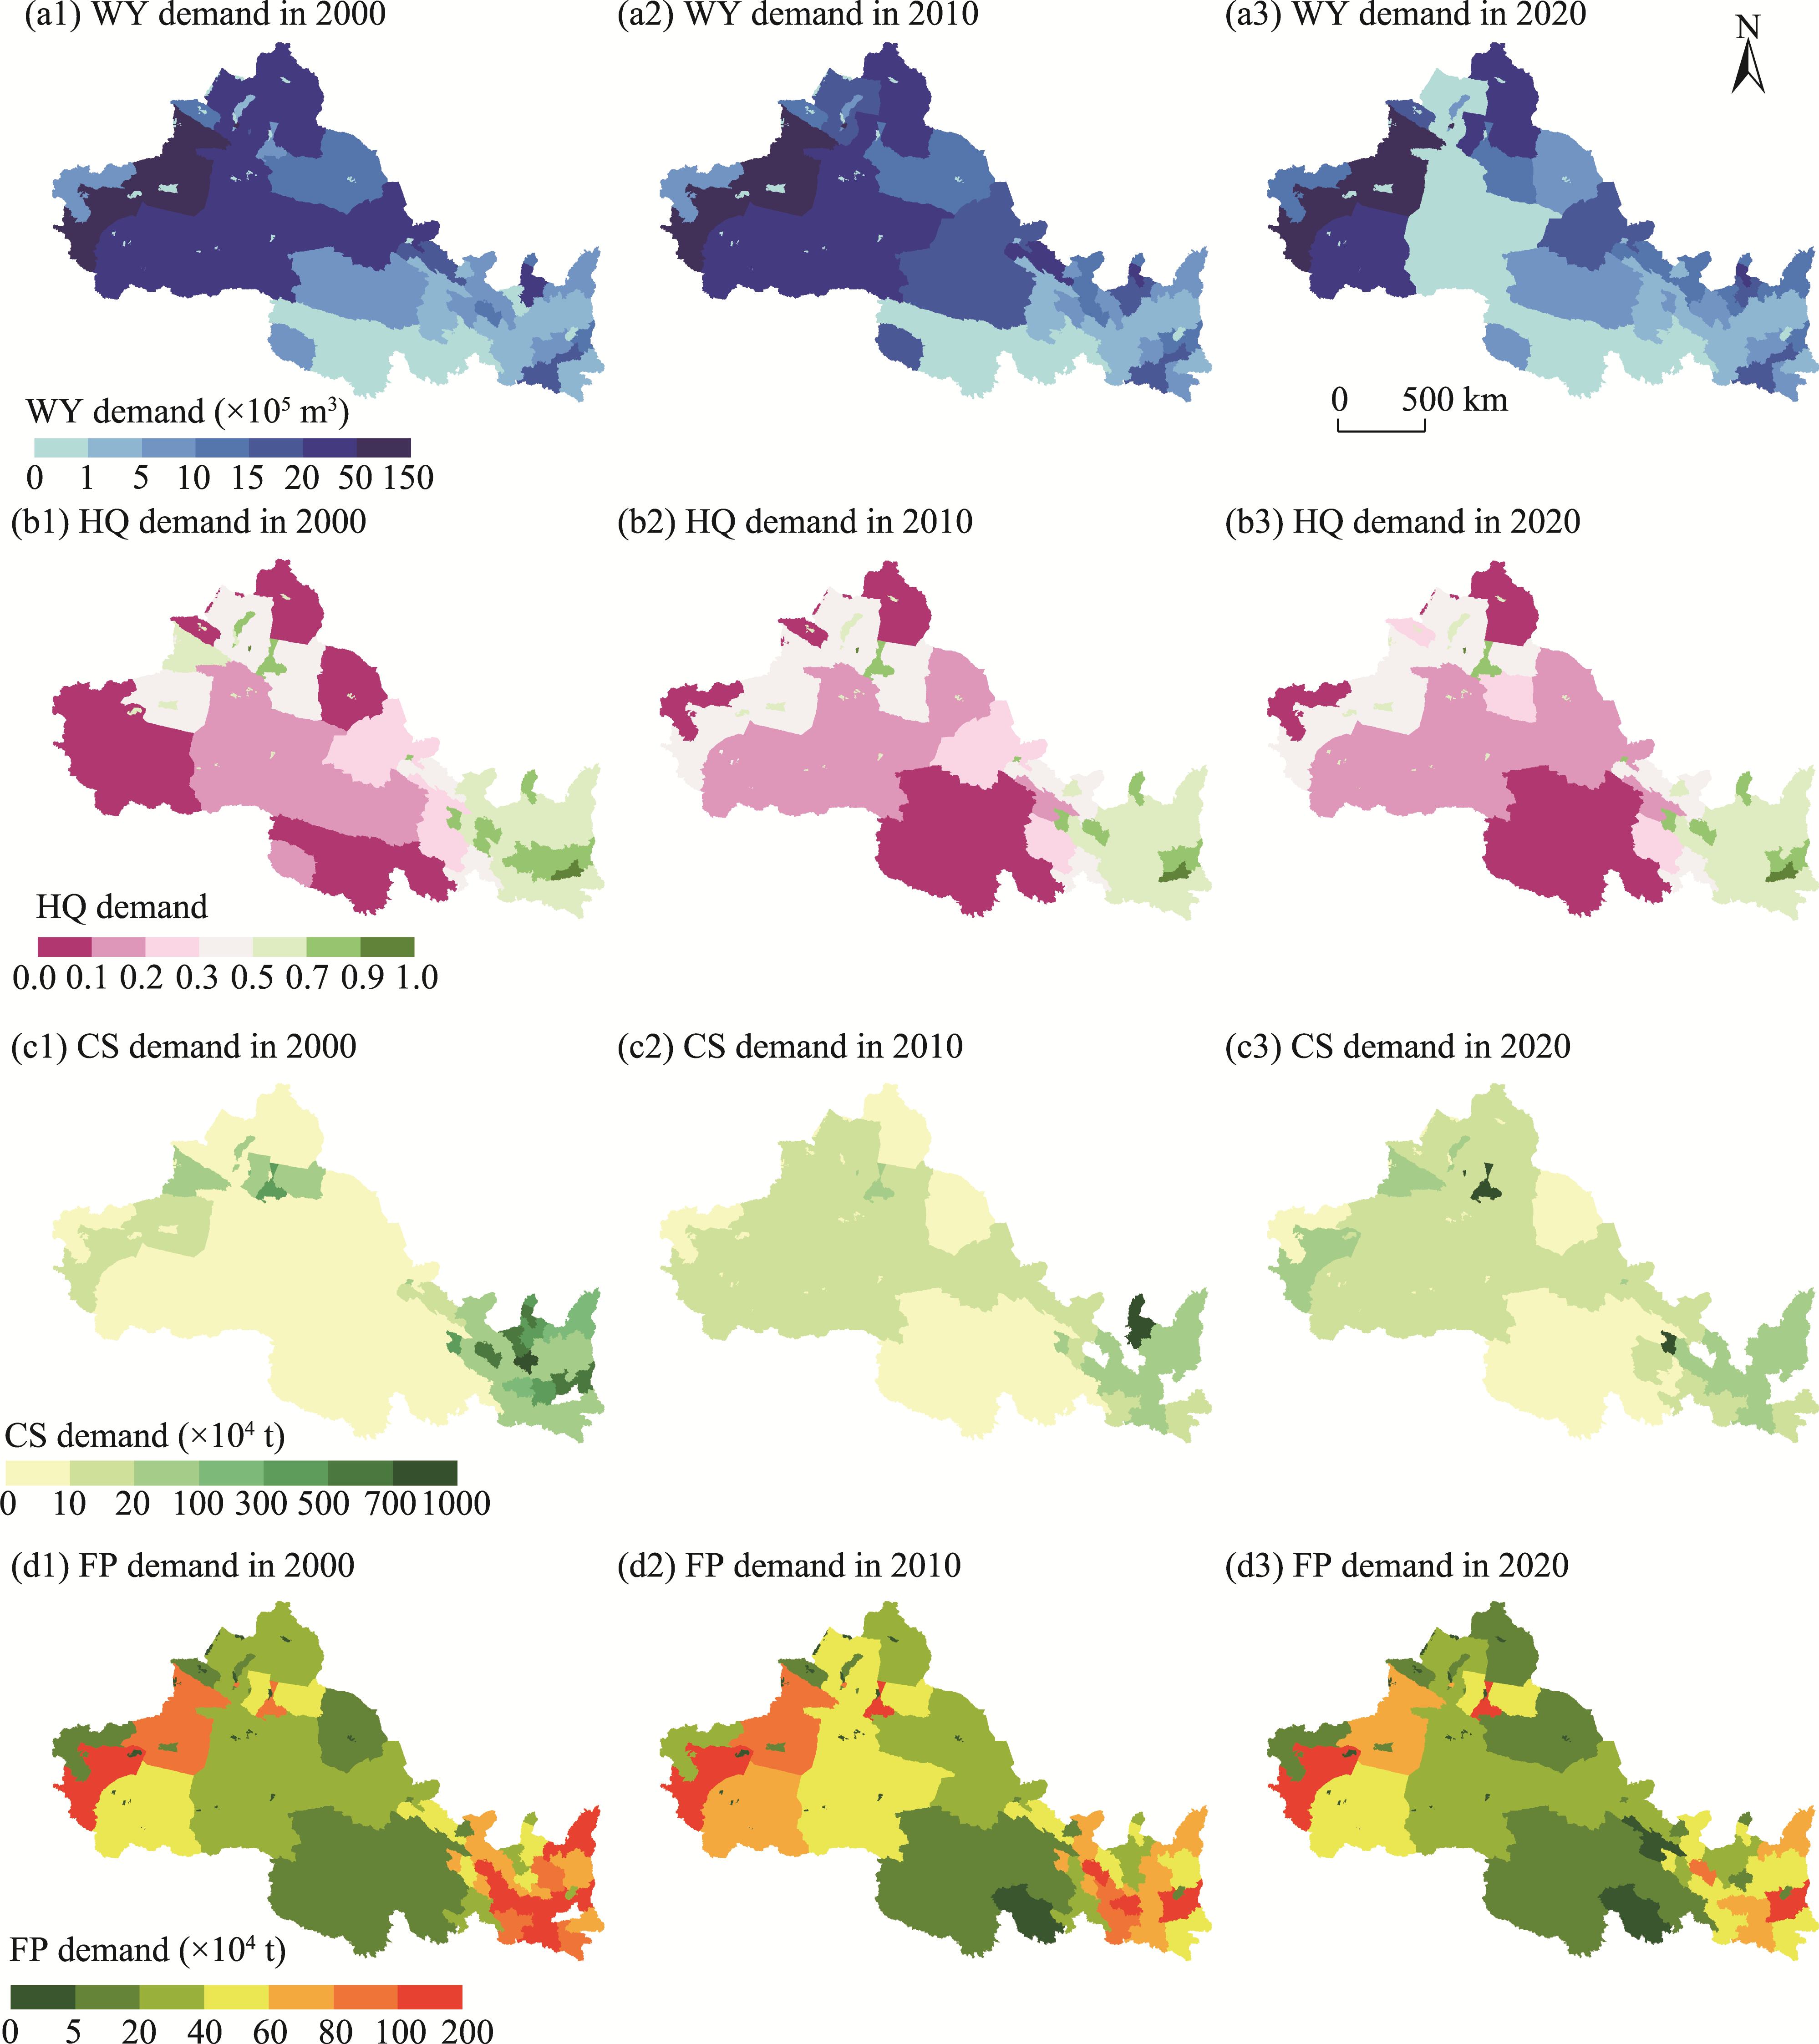
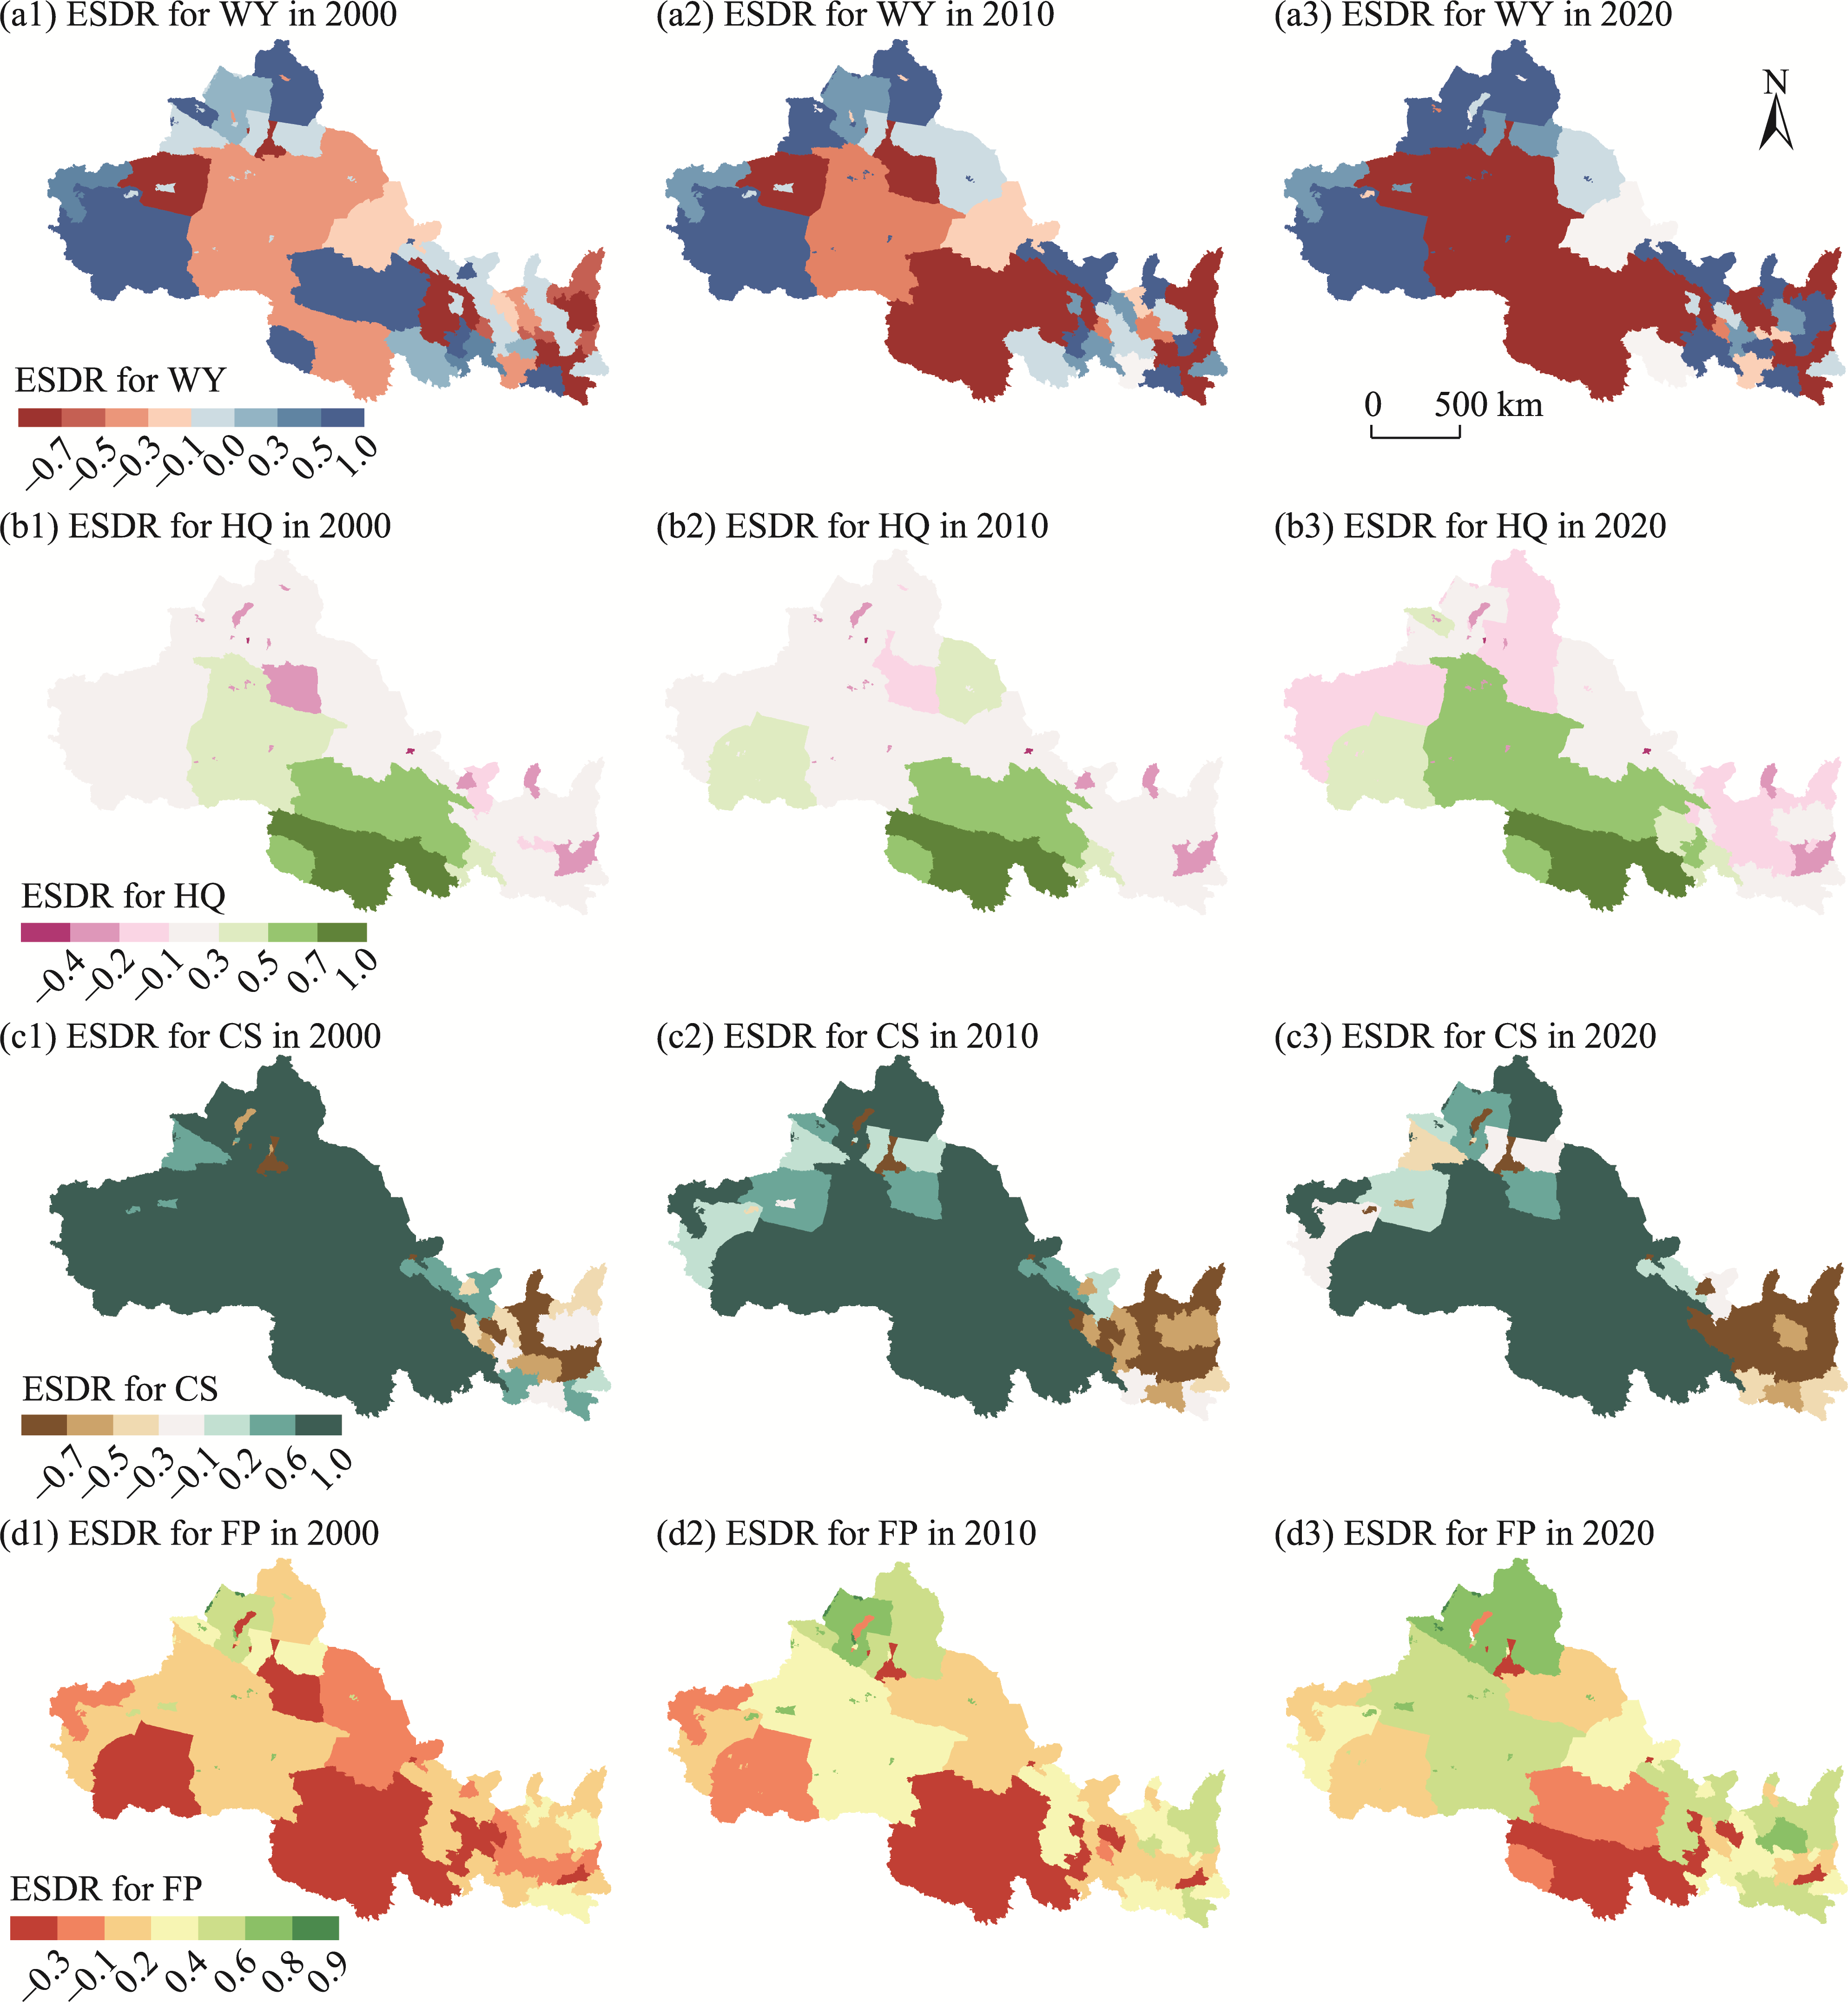
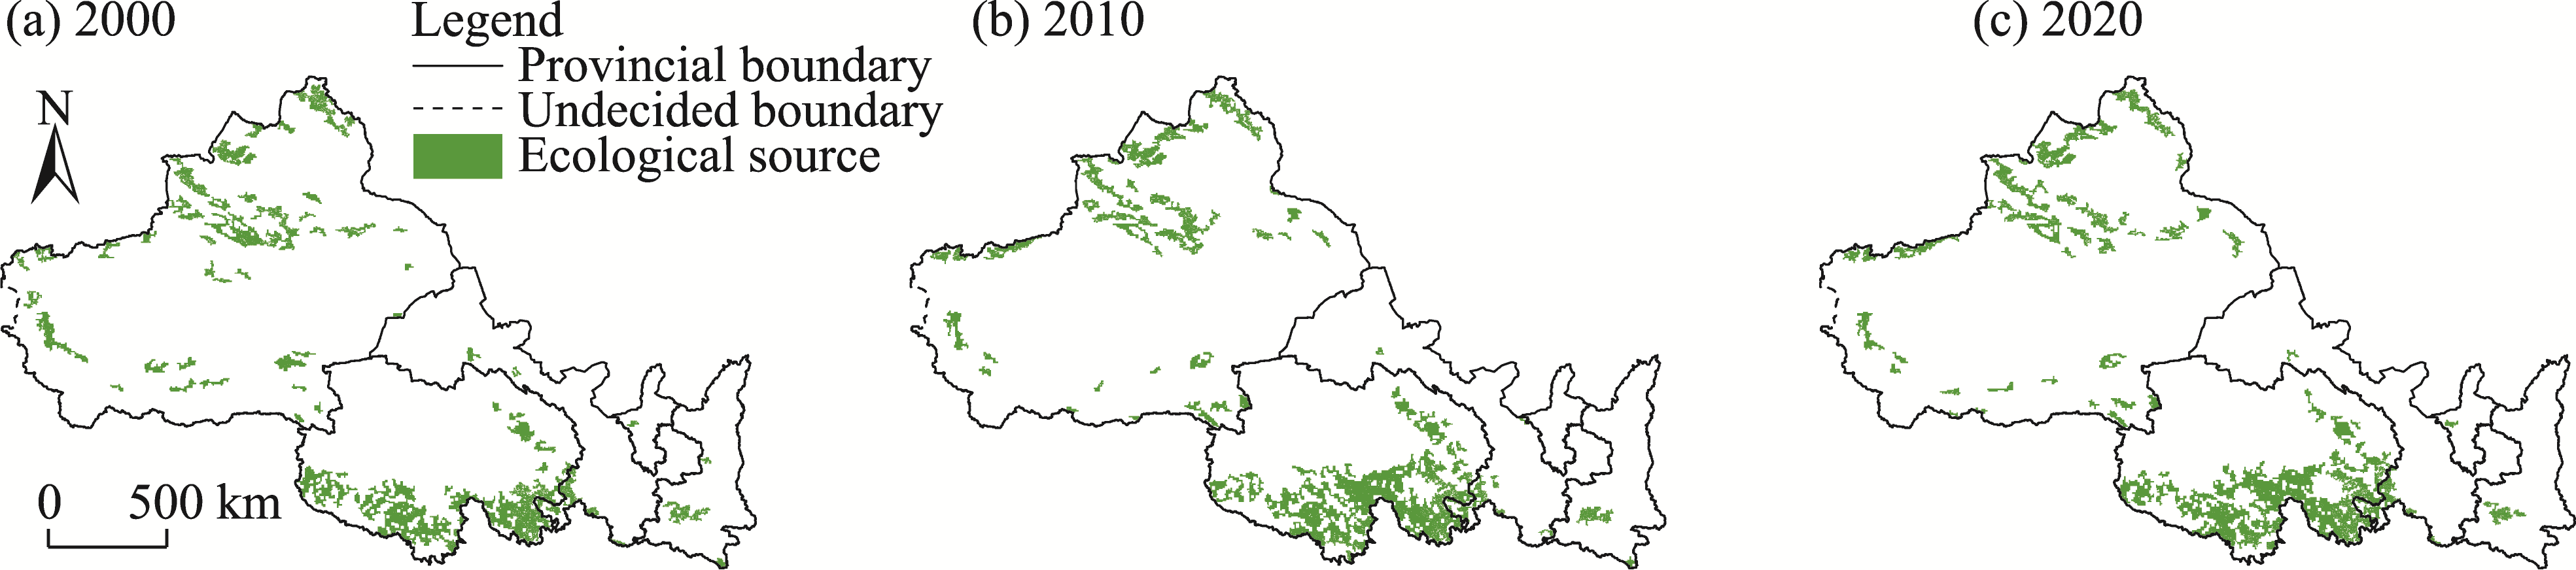
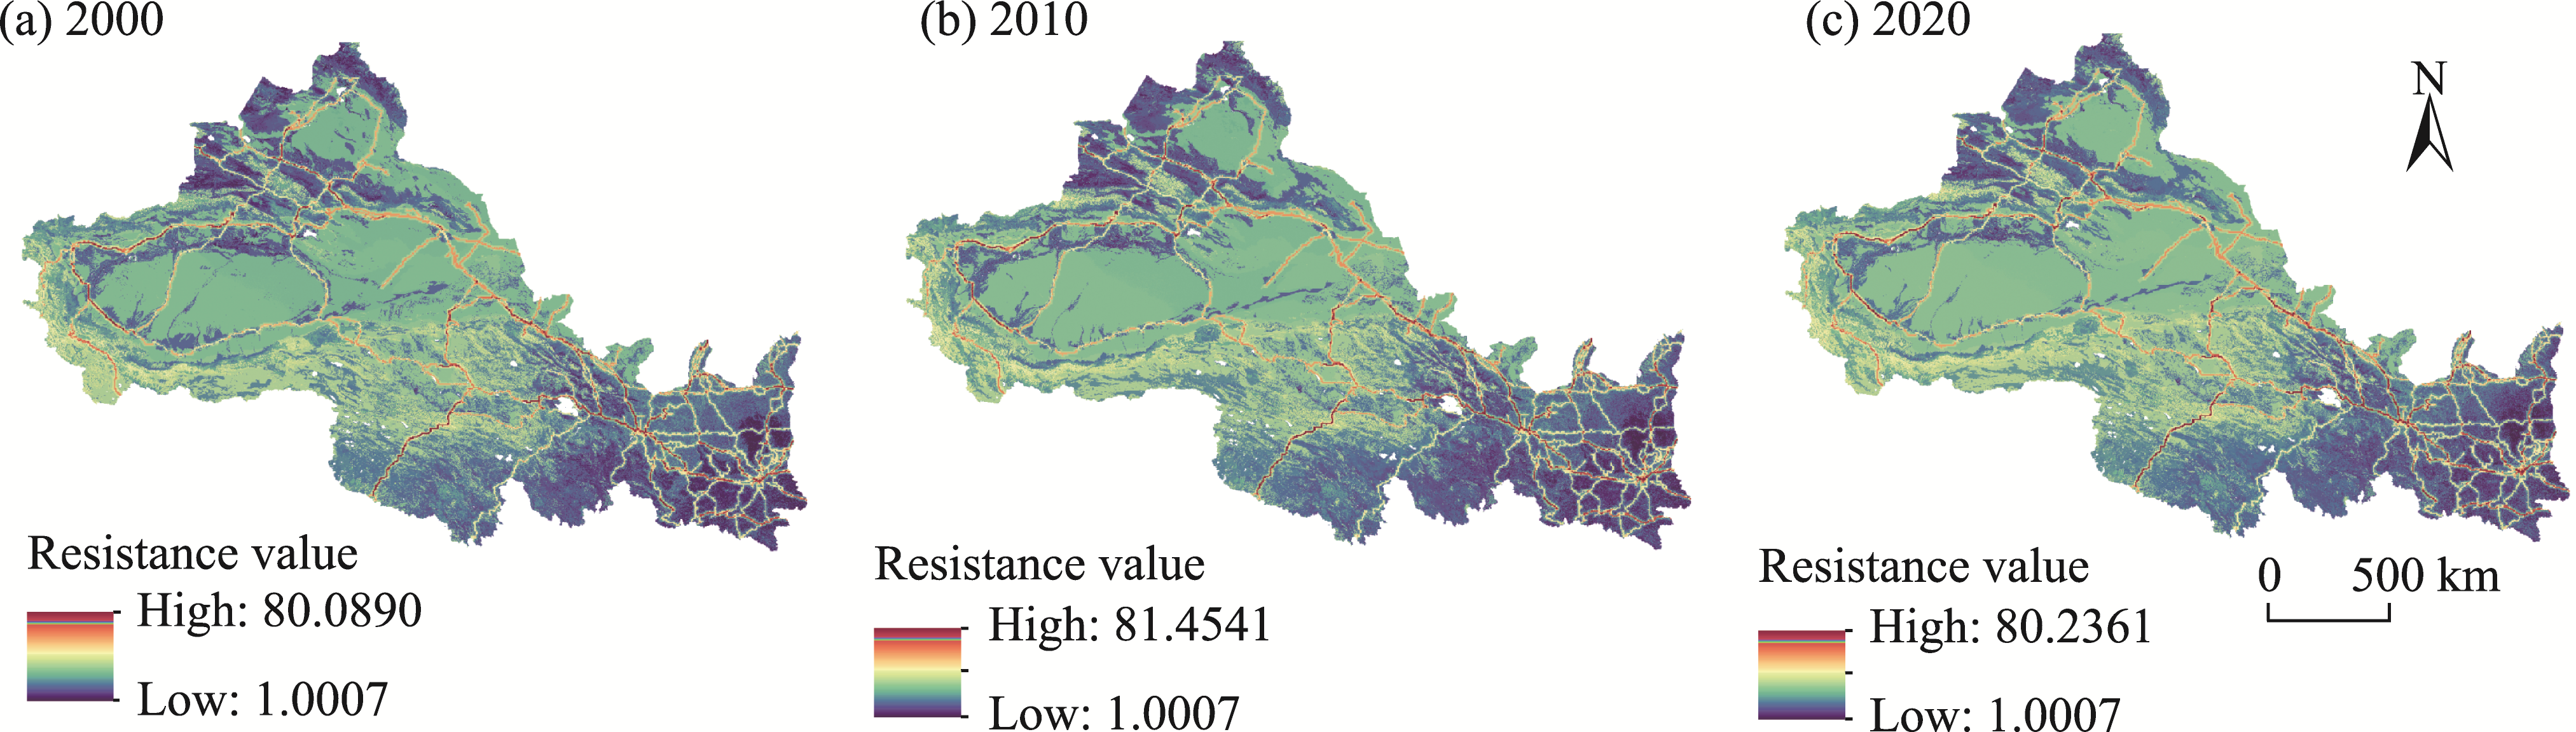
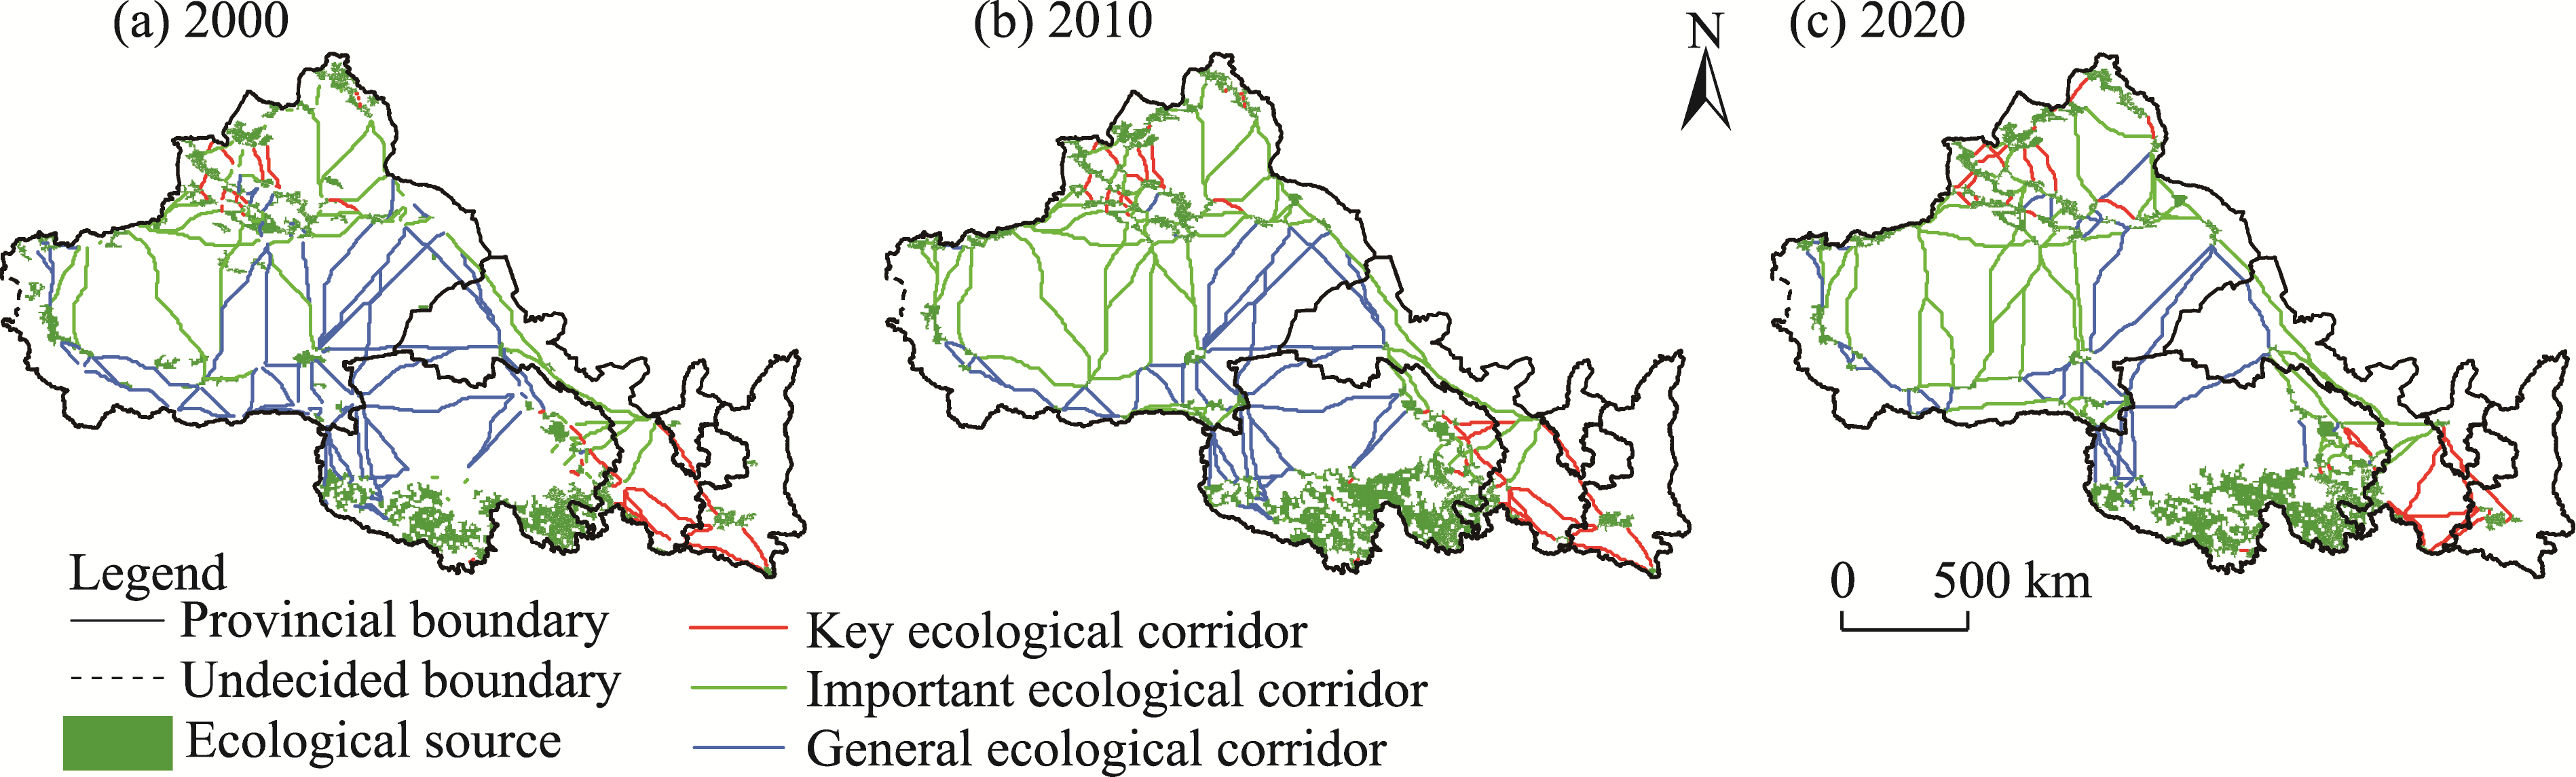
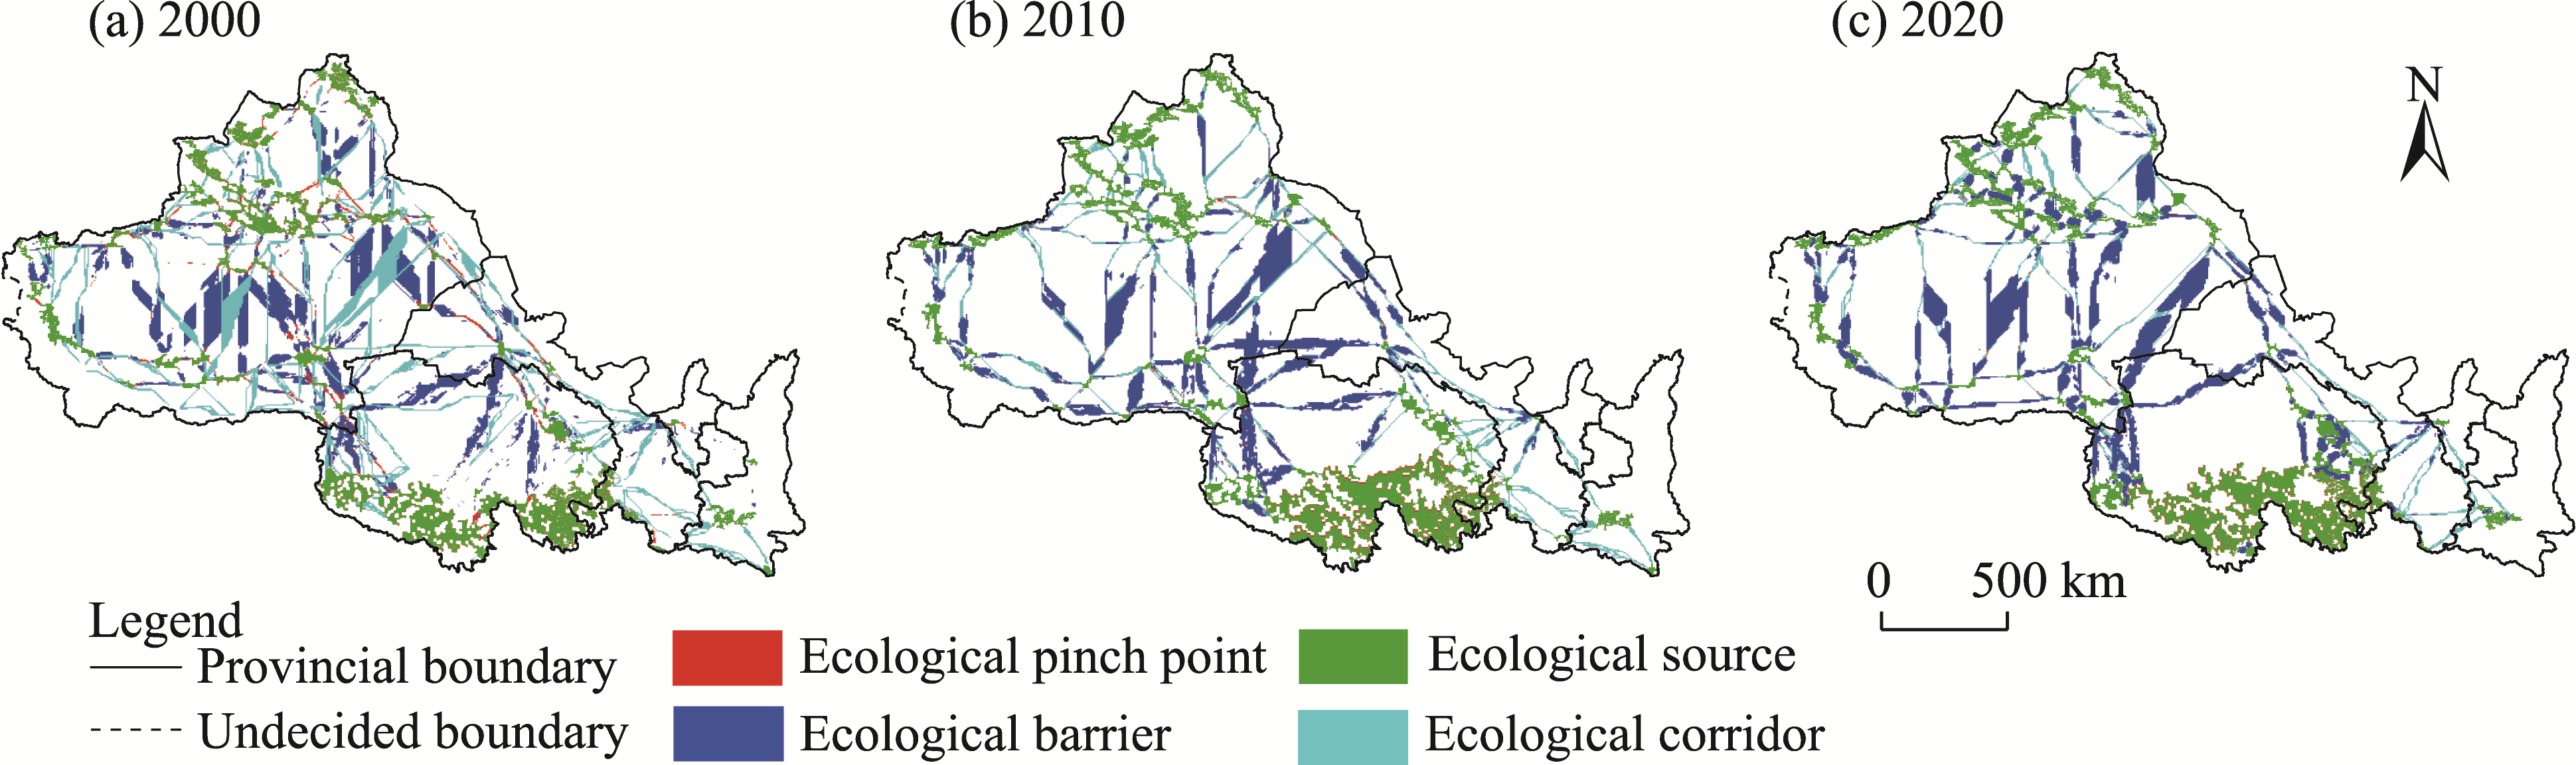
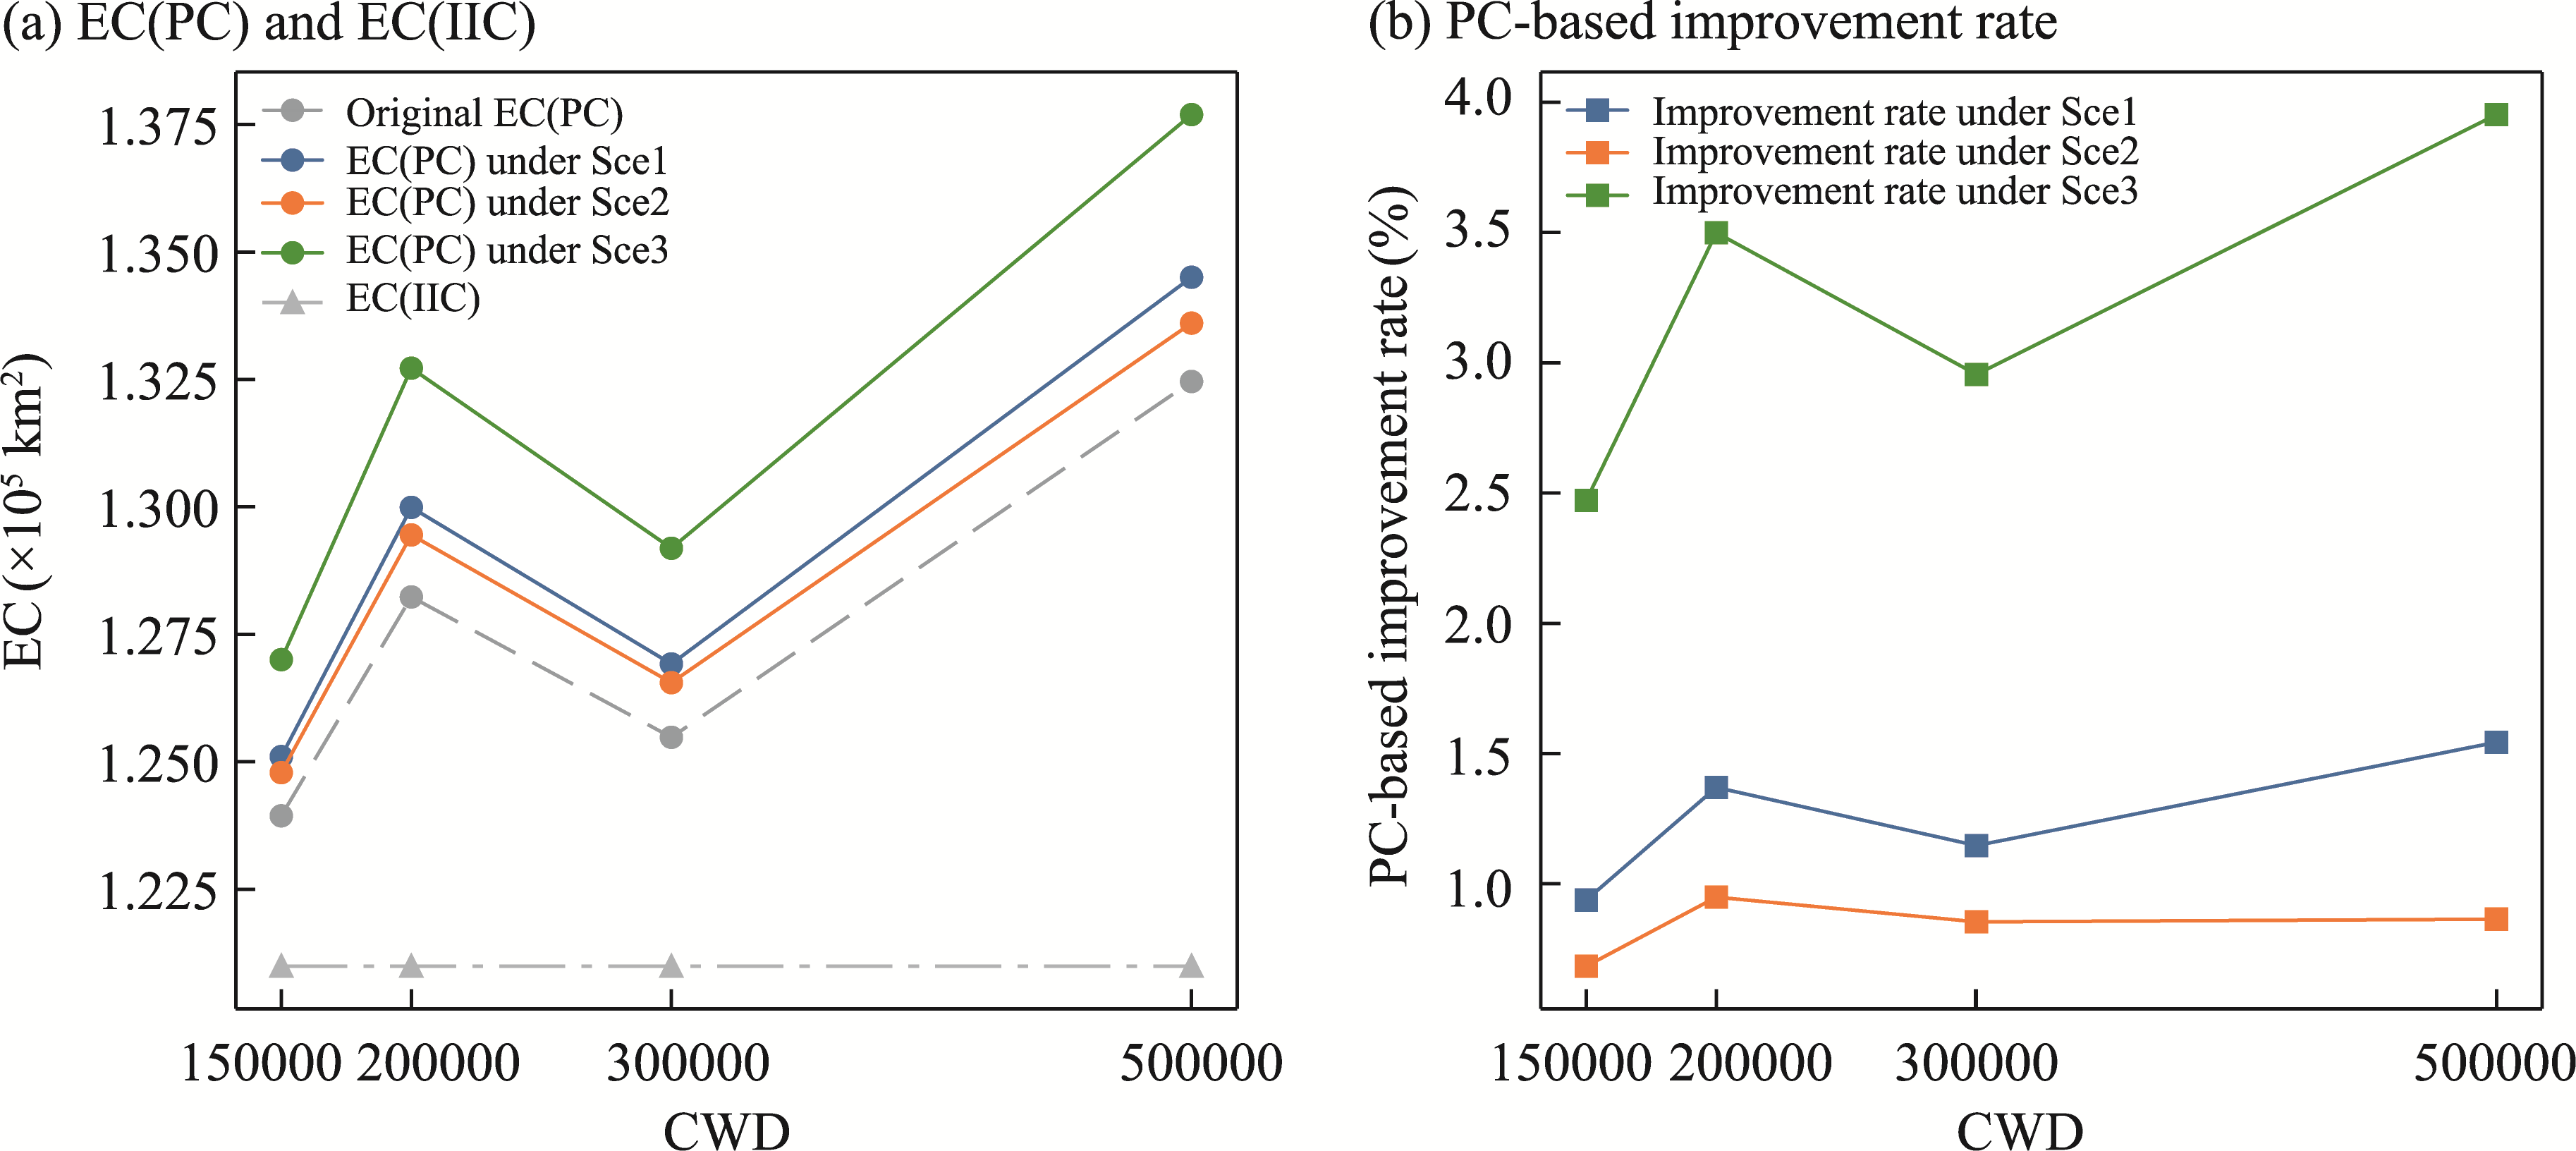
Abstract Northwest China serves as a critical ecological barrier region for maintaining national water, energy, and food security, as well as transboundary ecological governance. However, under the dual pressures of climate change and human activities, ecosystem services (ESs) are facing severe challenges in this region. Based on multi-source remote sensing and statistical data during 2000-2020, this study investigated the spatiotemporal evolution characteristics of four key ESs (water yield, habitat quality, carbon storage, and food provisioning) in Northwest China using the Integrated Valuation of Ecosystem Services and Tradeoffs (InVEST) model. Integrating morphological spatial pattern analysis (MSPA) and circuit theory, we identified ecological sources, corridors, pinch points, and barriers, and further designed three optimization scenarios (bottleneck optimization, high-resistance corridor buffering, and barrier removal optimization) to enhance landscape connectivity. The results revealed that ES supply and demand exhibited marked spatial heterogeneity, with high-supply areas concentrated in the southeastern sectors. Ecological sources primarily distributed in the southeastern and northern sectors, and ecological resistance surfaces continuously intensified. Water yield and habitat quality demands were increasing, food provisioning demand was decreasing, and carbon storage demand was surging. A total of 61 ecological sources (8% of the study area), 142 ecological corridors (24,957 km in total length), 237 ecological pinch points, and 89 barrier zones were identified. Among the three optimization scenarios, barrier removal achieved optimal connectivity improvement across all distance thresholds, with the probability of connectivity index improvement reaching up to 4%. This study provides scientific foundations and spatial decision support for ecological network optimization and sustainable governance in arid and semi-arid areas.
|
|
Received: 09 October 2025
Published: 31 March 2026
|
|
Corresponding Authors:
*YU Yang (E-mail: yuyang@ms.xjb.ac.cn)
|
|
|
| [1] |
Adriaensen F, Chardon J P, De Blust G, et al. 2003. The application of 'least-cost' modelling as a functional landscape model. Landscape and Urban Planning, 64(4): 233-247.
doi: 10.1016/S0169-2046(02)00242-6
|
|
|
| [2] |
Birk S, Weigelt C, Borgwardt F, et al. 2025. Freshwater restoration effects on biodiversity and ecosystem services: a Delphi survey. Restoration Ecology, 33(7): e70119, doi: 10.1111/rec.70119.
|
|
|
| [3] |
Bryan B A, Gao L, Ye Y Q, et al. 2018. China's response to a national land-system sustainability emergency. Nature, 559(7713): 193-204.
doi: 10.1038/s41586-018-0280-2
|
|
|
| [4] |
Bureau of Statistics of Ningxia Hui Autonomous Region.2000-2020. Ningxia Statistical Yearbook. Beijing: China Statistics Press. (in Chinese)
|
|
|
| [5] |
Bureau of Statistics of Xinjiang Uygur Autonomous Region.2000-2020. Xinjiang Statistical Yearbook. Beijing: China Statistics Press. (in Chinese)
|
|
|
| [6] |
Cao Y, Li G Y, Tian Y H, et al. 2020. Linking ecosystem services trade-offs, bundles and hotspot identification with cropland management in the coastal Hangzhou Bay area of China. Land Use Policy, 97(1): 104689, doi: 10.1016/j.landusepol.2020.104689.
|
|
|
| [7] |
Chen F H, Xie T T, Yang Y J, et al. 2023. Discussion of the "warming and wetting" trend and its future variation in the drylands of Northwest China under global warming. Science China Earth Sciences, 66: 1241-1257.
doi: 10.1007/s11430-022-1098-x
|
|
|
| [8] |
Chen H, Deng X H, Li Z X, et al. 2024. Matching supply and demand of ecosystem services in Qilian Mountain National Park. Chinese Journal of Ecology, 43(6): 1901-1909. (in Chinese)
doi: 10.13292/j.1000-4890.202406.046
|
|
|
| [9] |
Chen Y M, Zhai Y P, Gao J X. 2022. Spatial patterns in ecosystem services supply and demand in the Jing-Jin-Ji region, China. Journal of Cleaner Production, 361: 132177, doi: 10.1016/j.jclepro.2022.132177.
|
|
|
| [10] |
Costanza R, d'Arge R, de Groot R, et al. 1997. The value of the world's ecosystem services and natural capital. Nature, 387(6630): 253-260.
doi: 10.1038/387253a0
|
|
|
| [11] |
Ding M M, Liu W, Xiao L, et al. 2022. Construction and optimization strategy of ecological security pattern in a rapidly urbanizing region: A case study in Central-South China. Ecological Indicators, 136: 108604, doi: 10.1016/j.ecolind.2022.108604.
|
|
|
| [12] |
Ding Y H, Liu Y J, Xu Y, et al. 2023. Regional responses to global climate change: progress and prospects for trend, causes, and projection of climatic warming-wetting in Northwest China. Advances in Earth Science, 38(6): 551-562. (in Chinese)
doi: 10.11867/j.issn.1001-8166.2023.027
|
|
|
| [13] |
Feng X M, Fu B J, Piao S L, et al. 2016. Revegetation in China's Loess Plateau is approaching sustainable water resource limits. Nature Climate Change, 6(11): 1019-1022.
doi: 10.1038/nclimate3092
|
|
|
| [14] |
Forman R T T, Alexander L E. 1998. Roads and their major ecological effects. Annual Review of Ecology and Systematics, 29: 207-231.
doi: 10.1146/ecolsys.1998.29.issue-1
|
|
|
| [15] |
Fu C, Liu Y F, Chen Y D, et al. 2022. Simulation of land use change and habitat quality in the Yellow River Basin under multiple scenarios. Water, 14(22): 3767, doi: 10.3390/w14223767.
|
|
|
| [16] |
Gansu Provincial Bureau of Statistics. 2000- 2020. Gansu Statistical Yearbook. Beijing: China Statistics Press. (in Chinese)
|
|
|
| [17] |
Gansu Provincial Water Resources Department. 2000- 2020. Water Resources Bulletin of Gansu Province [Annual Report]. [2025-08-25]. http://slt.gansu.gov.cn. (in Chinese)
|
|
|
| [18] |
Gao X, Shen J Q, He W J, et al. 2019. An evolutionary game analysis of governments' decision-making behaviors and factors influencing watershed ecological compensation in China. Journal of Environmental Management, 251: 109592, doi: 10.1016/j.jenvman.2019.109592.
|
|
|
| [19] |
Guo J, Feng P F, Xue H, et al. 2025. A framework of ecological security patterns in arid and semi-arid regions considering differences socioeconomic scenarios in ecological risk: Case of Loess Plateau, China. Journal of Environmental Management, 373: 123923, doi: 10.1016/j.jenvman.2024.123923.
|
|
|
| [20] |
Han M, Xu C C, Long Y X, et al. 2022. Simulation and prediction of carbon storage and carbon source/sink changes under different land use scenarios in arid region of Northwest China. Bulletin of Soil and Water Conservation, 42(3): 335-344. (in Chinese)
|
|
|
| [21] |
He J, Yu Y, Sun L X, et al. 2024. Spatiotemporal variations of ecosystem services in the Aral Sea basin under different CMIP 6 projections. Scientific Reports, 14: 12237, doi: 10.1038/s41598-024-62802-9.
|
|
|
| [22] |
Heng X X, Zhang J, Mao D H, et al. 2022. Identifying spatial similarities and mismatches between supply and demand of ecosystem services for sustainable Northeast China. Ecological Indicators, 134: 108501, doi: 10.1016/j.ecolind.2021.108501.
|
|
|
| [23] |
Jin T L, Zhang P X, Zhou N, et al. 2025. Unveiling the spatiotemporal heterogeneity and driving mechanisms of carbon storage changes in response to land use/land cover changes under different future scenarios: Insights from the GMOP-SEM model. Journal of Cleaner Production, 487: 144622, doi: 10.1016/j.jclepro.2024.144622.
|
|
|
| [24] |
Jin X Y, Wang J G, Liu D P, et al. 2024. Managing the supply-demand mismatches and potential flows of ecosystem services in Jilin Province, China, from a regional integration perspective. Land, 13(9): 1504, doi: 10.3390/land13091504.
|
|
|
| [25] |
Li F W, Zhao Y Y, Zhao Y. 2024a. Construction and optimization of ecological network based on morphological spatial pattern analysis and minimum cumulative resistance models in Haihe River basin. Ecohydrology, 17(2): e2620, doi: 10.1002/eco.2620.
|
|
|
| [26] |
Li H R, Ma S, Yin Y K, et al. 2024b. Spatio-temporal changes of ecosystem service multi-functional areas and their influencing factors: A case study of the Qinghai-Tibet Plateau ecological shelter. Journal of Ecology and Rural Environment, 40(8): 1038-1046. (in Chinese)
|
|
|
| [27] |
Li J Q, He W J, Jiang E H, et al. 2024c. Evaluation and prediction of water security levels in Northwest China based on the DPSIR model. Ecological Indicators, 163: 112045, doi: 10.1016/j.ecolind.2024.112045.
|
|
|
| [28] |
Li J Y, Chen X, De Maeyer P, et al. 2024d. Ecological security warning in Central Asia: Integrating ecosystem services protection under SSPs-RCPs scenarios. Science of The Total Environment, 912: 168698, doi: 10.1016/j.scitotenv.2023.168698.
|
|
|
| [29] |
Li Z H, Deng X Z, Jin G, et al. 2020. Tradeoffs between agricultural production and ecosystem services: A case study in Zhangye, Northwest China. Science of The Total Environment, 707: 136032, doi: 10.1016/j.scitotenv.2019.136032.
|
|
|
| [30] |
Li Z H, Xia J, Deng X Z, et al. 2021. Multilevel modelling of impacts of human and natural factors on ecosystem services change in an oasis, Northwest China. Resources, Conservation and Recycling, 169: 105474, doi: 10.1016/j.resconrec.2021.105474.
|
|
|
| [31] |
Liu X, Su X L, Liu Y H, et al. 2023a. Vulnerability assessment of ecological drought in Northwest China. Water Resources Protection, 39(3): 65-73. (in Chinese)
|
|
|
| [32] |
Liu Y, Yuan X J, Li J X, et al. 2023b. Trade-offs and synergistic relationships of ecosystem services under land use change in Xinjiang from 1990 to 2020: A Bayesian network analysis. Science of The Total Environment, 858: 160015, doi: 10.1016/j.scitotenv.2022.160015.
|
|
|
| [33] |
Lyu Y F, Wu C F. 2023. Managing the supply-demand mismatches and potential flows of ecosystem services from the perspective of regional integration: A case study of Hangzhou, China. Science of The Total Environment, 902: 165918, doi: 10.1016/j.scitotenv.2023.165918.
|
|
|
| [34] |
Ma Y H, Chen H, Yang M M, et al. 2024. Assessment of supply-demand relationships considering the interregional flow of ecosystem services. Environmental Science and Pollution Research, 31: 27710-27729.
doi: 10.1007/s11356-024-32904-y
|
|
|
| [35] |
McRae B H, Dickson B G, Keitt T H, et al. 2008. Using circuit theory to model connectivity in ecology, evolution, and conservation. Ecology, 89(10): 2712-2724.
doi: 10.1890/07-1861.1
pmid: 18959309
|
|
|
| [36] |
Na Y Q, Hong Z J, Ren S Y, et al. 2024. Optimizing the construction of ecological networks in Beijing using a morphological spatial pattern analysis—minimal cumulative resistance model. Frontiers in Environmental Science, 12: 1325880, doi: 10.3389/fenvs.2024.1325880.
|
|
|
| [37] |
Ningxia Hui Autonomous Region Water Resources Department. 2000- 2020. Water Resources Bulletin of Ningxia Hui Autonomous Region [Annual Report]. [2025-08-25]. http://slt.nx.gov.cn. (in Chinese)
|
|
|
| [38] |
Niu L N, Shao Q Q, Ning J, et al. 2022. Ecological changes and the tradeoff and synergy of ecosystem services in western China. Acta Geographica Sinica, 77(1): 182-195. (in Chinese)
doi: 10.11821/dlxb202201013
|
|
|
| [39] |
Pan N H, Du Q Q, Guan Q Y, et al. 2022. Ecological security assessment and pattern construction in arid and semi-arid areas: A case study of the Hexi Region, NW China. Ecological Indicators, 138: 108797, doi: 10.1016/j.ecolind.2022.108797.
|
|
|
| [40] |
Peng J, Zhao H J, Liu Y X, et al. 2017. Research progress and prospect on regional ecological security pattern construction. Geographical Research, 36(3): 407-419. (in Chinese)
|
|
|
| [41] |
Qin X L, Liu W, Ling H B, et al. 2025. Construction and optimization of ecological security pattern in the mainstream of the Tarim River Basin, China. Journal of Arid Land, 17(6): 735-753.
doi: 10.1007/s40333-025-0102-y
|
|
|
| [42] |
Qinghai Provincial Bureau of Statistics.2000-2020. Qinghai Statistical Yearbook. Beijing: China Statistics Press. (in Chinese)
|
|
|
| [43] |
Qinghai Provincial Water Resources Department. 2000- 2020. Water Resources Bulletin of Qinghai Province [Annual Report]. [2025-08-25]. http://slt.qinghai.gov.cn. (in Chinese)
|
|
|
| [44] |
Sawyer H, Kauffman M J, Nielson R M, et al. 2009. Identifying and prioritizing ungulate migration routes for landscape-level conservation. Ecological Applications, 19(8): 2016-2025.
pmid: 20014575
|
|
|
| [45] |
Shaanxi Provincial Bureau of Statistics.2000-2020. Shaanxi Statistical Yearbook. Beijing: China Statistics Press. (in Chinese)
|
|
|
| [46] |
Shaanxi Provincial Water Resources Department. 2000- 2020. Water Resources Bulletin of Shaanxi Province [Annual Report]. [2025-08-25]. http://slt.shaanxi.gov.cn. (in Chinese)
|
|
|
| [47] |
Shi Y F, Shen Y P, Li D L, et al. 2003. Discussion on the present climate change from warm-dry to warm-wet in Northwest China. Quaternary Sciences, 23(2): 152-164. (in Chinese)
|
|
|
| [48] |
Shi Y S, Shi D H, Zhou L L, et al. 2020. Identification of ecosystem services supply and demand areas and simulation of ecosystem service flows in Shanghai. Ecological Indicators, 115: 106418, doi: 10.1016/j.ecolind.2020.106418.
|
|
|
| [49] |
Wang T Y, Wang Z H, Guo L, et al. 2021. Experiences and challenges of agricultural development in an artificial oasis: A review. Agricultural Systems, 193: 103220, doi: 10.1016/j.agsy.2021.103220.
|
|
|
| [50] |
Wang X F, Yao W J, Feng X M, et al. 2023. Changes and driving factors of ecosystem services supply and demand on the Tibetan Plateau. Acta Ecologica Sinica, 43(17): 6968-6982. (in Chinese)
|
|
|
| [51] |
Xinjiang Uygur Autonomous Region Water Resources Department. 2000- 2020. Water Resources Bulletin of Xinjiang Uygur Autonomous Region [Annual Report]. [2025-08-25]. http://slt.xinjiang.gov.cn. (in Chinese)
|
|
|
| [52] |
Yang L J, Wang J, Wei W, et al. 2020. Ecological security pattern construction and optimization in arid inland river basin: A case study of Shiyang River Basin. Acta Ecologica Sinica, 40(17): 5915-5927. (in Chinese)
|
|
|
| [53] |
Yang R L, Bai Z K, Shi Z Y. 2021. Linking morphological spatial pattern analysis and circuit theory to identify ecological security pattern in the Loess Plateau: Taking Shuozhou City as an example. Land, 10(9): 907, doi: 10.3390/land10090907.
|
|
|
| [54] |
Yang X W, Wei G Y, Liang C Z, et al. 2024. Construction of ecological security pattern based on ecosystem service evaluation and minimal cumulative resistance model: A case study of Hefei City, China. Environment, Development and Sustainability, 26: 10681-10700.
doi: 10.1007/s10668-023-03170-8
|
|
|
| [55] |
Yin D Y, Yu H C, Shi Y Y, et al. 2023. Matching supply and demand for ecosystem services in the Yellow River Basin, China: A perspective of the water-energy-food nexus. Journal of Cleaner Production, 384: 135469, doi: 10.1016/j.jclepro.2022.135469.
|
|
|
| [56] |
Yuan M, Xian Q, Huang Q Y, et al. 2025. Research on ecological security pattern based on the paradigm of "portray-assessment-construction-validation"--Minjiang River Basin as an example. Journal of Environmental Management, 394: 127553, doi: 10.1016/j.jenvman.2025.127553.
|
|
|
| [57] |
Zhai T L, Zhang D, Zhao C C. 2021. How to optimize ecological compensation to alleviate environmental injustice in different cities in the Yellow River Basin? A case of integrating ecosystem service supply, demand and flow. Sustainable Cities and Society, 75: 103341, doi: 10.1016/j.scs.2021.103341.
|
|
|
| [58] |
Zhang J, Li M, Ao Z Q, et al. 2018. Estimation of soil organic carbon storage in arid region of western China. Journal of Arid Land Resources and Environment, 32(9): 132-137. (in Chinese)
|
|
|
| [59] |
Zhang Q, Zhu B, Yang J H, et al. 2021. New characteristics about the climate humidification trend in Northwest China. Chinese Science Bulletin, 66(28-29): 3757-3771. (in Chinese)
|
|
|
| [60] |
Zhang Y W, Zhang S Y, Zhu H K, et al. 2024. Construction and optimization of the ecological security pattern in metropolitan areas based on the supply and demand of ecosystem services at multiple scales. Acta Ecologica Sinica, 44(21): 9596-9609. (in Chinese)
|
|
|
| [61] |
Zhao M M, He Z B, Wang S K. 2023. Potential effects of oasis expansion on ecosystem service value in a typical inland river basin of Northwest China. Environmental Science and Pollution Research, 30: 48401-48414.
doi: 10.1007/s11356-023-25752-9
|
|
|
| [62] |
Zhao H Z, He J H, Liu D F, et al. 2025. Identification of ecological conservation priority areas considering the dynamic supply-demand balance of ecosystem services. Journal of Cleaner Production, 520: 146023, doi: 10.1016/j.jclepro.2025.146023.
|
|
|
| [63] |
Zhou P P, Tian Y S, Zhai J, et al. 2025. How does land use transfer affect ecosystem services in Northwest China? Ecological Engineering, 219: 107712, doi: 10.1016/j.ecoleng.2025.107712.
|
|
|
| [64] |
Zubaida M. 2024. Trade-offs and synergies between ecosystem services in Yutian County along the Keriya River Basin, Northwest China. Journal of Arid Land, 16(7): 943-962.
doi: 10.1007/s40333-024-0103-2
|
|
|
|
Viewed |
|
|
|
Full text
|
|
|
|
|
Abstract
|
|
|
|
|
Cited |
|
|
|
|
| |
Shared |
|
|
|
|
| |
Discussed |
|
|
|
|