Scale-dependent spatial association of the dominant shrub Calligonum mongolicum and its co-occurring shrubs in an extremely arid desert: Insights from spatial point pattern analysis
LI Jiale1, ZHANG Dinghai1,*(), LU Xudong1, JIA Rongliang2
1Centre for Quantitative Biology, College of Science, Gansu Agricultural University, Lanzhou 730070, China 2Shapotou Desert Experimental Research Station, Cold and Arid Regions Environmental and Engineering Research Institute, Chinese Academy of Sciences, Lanzhou 730000, China
Understanding scale-dependent plant-plant relationships is essential for revealing population organization and species coexistence in extremely arid ecosystems. In this study, Calligonum mongolicum Turcz., a dominant sand-fixing shrub in mobile dunes of the Gurbantunggut Desert, Northwest China, was selected as the focal species to investigate its intra- and interspecific spatial relationships across multiple scales. Univariate, bivariate, and marked point pattern analyses combined with different null models were applied to characterize spatial patterns between different life stages, survival statuses, individual sizes, and co-occurring shrubs, and to evaluate the potential contributions of habitat heterogeneity and dispersal processes. The results show that the overall population and different life stages of C. mongolicum exhibited significant aggregation under the complete spatial randomness model, whereas the aggregation patterns were largely weakened after accounting for habitat heterogeneity and clustering processes. Adult-juvenile spatial associations showed clear scale dependence, whereas survival-related spatial patterns exhibited limited spatial dependence. After accounting for habitat heterogeneity, no persistent spatial pattern supporting strong adult-mediated facilitation or density-dependent effects was detected across most scales. Interspecific associations between C. mongolicum and co-occurring shrubs (Haloxylon persicum Bunge ex Boiss. & Buhse, Artemisia ordosica Krasch., and Ephedra distachya L.) also exhibited pronounced scale dependence, with positive associations mainly occurring at smaller scales and negative associations emerging at some larger scales. These findings indicate that the spatial organization of dominant desert shrubs is shaped by multiple ecological processes, including habitat heterogeneity, dispersal limitation, and potential biotic interactions, providing new insights into plant coexistence and population maintenance in extremely arid ecosystems.
Received: 17 March 2026
Published: 31 October 2026
Formal analysis: LI Jiale; Writing - original draft preparation: LI Jiale; Writing - review and editing: ZHANG Dinghai, LU Xudong; Project administration: JIA Rongliang; Supervision: JIA Rongliang. All authors approved the manuscript.
LI Jiale, ZHANG Dinghai, LU Xudong, JIA Rongliang. Scale-dependent spatial association of the dominant shrub Calligonum mongolicum and its co-occurring shrubs in an extremely arid desert: Insights from spatial point pattern analysis. Journal of Arid Land, 2026, 18(10): 1831-1849.
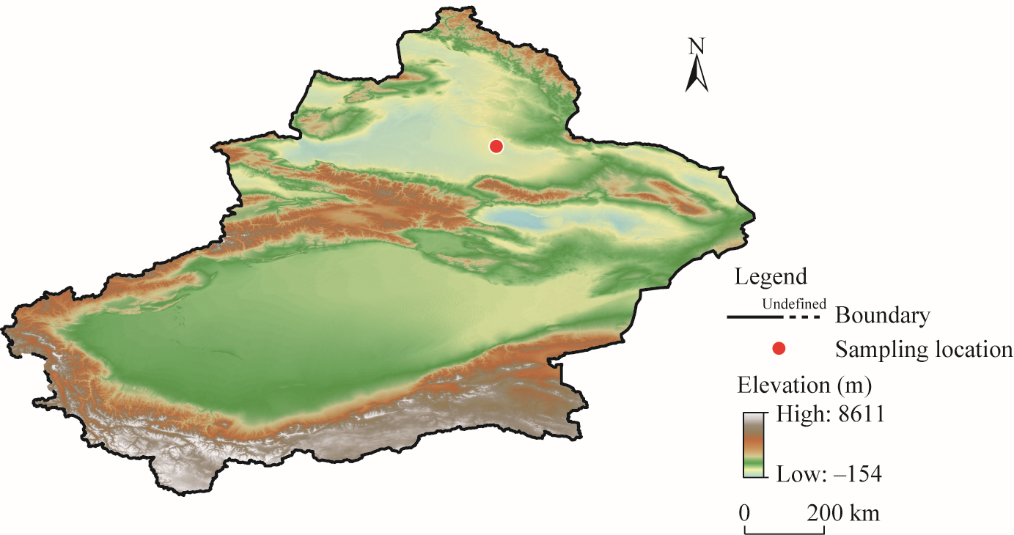
Fig. 1Overview of Xinjiang Uygur Autonomous Region of China based on the elevation and sampling locations. Noted that the figure is based on the standard map (No. 新 S(2021)023) of the Xinjiang Uygur Autonomous Region Platform for Common Geospatial Information Services (http://xinjiang.tianditu.gov.cn/bzdt_code/bzdt.html#) marked by the Department of Natural Resources of Xinjiang Uygur Autonomous Region, and the boundary of the base map has not been modified.
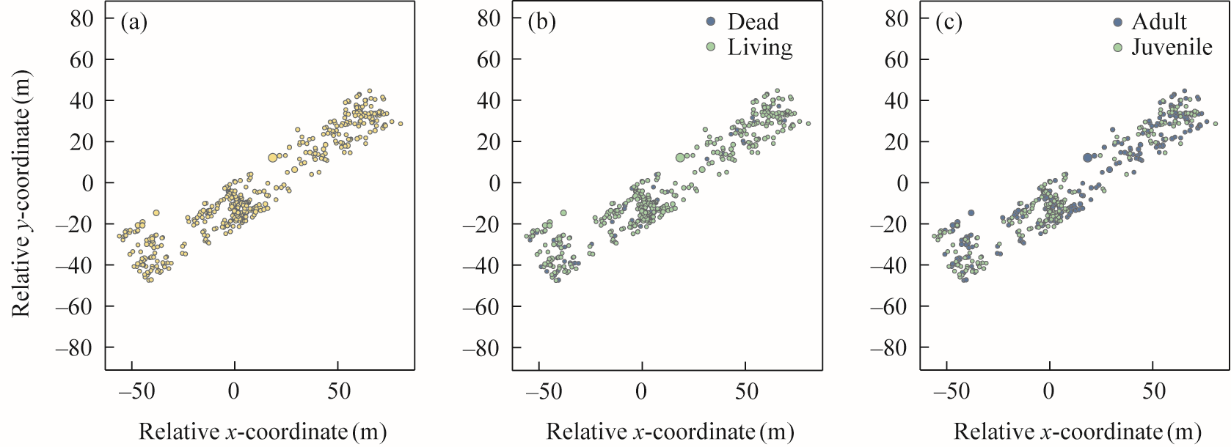
Fig. 2Spatial distribution of the Calligonum mongolicum Turcz. population. (a), overall spatial distribution of the C. mongolicum population; (b), distribution of dead and living individuals; (c), distribution of adult and juvenile individuals. The original geographic coordinates referenced to the WGS84 geodetic system were first transformed into planar metric coordinates. The lowest-elevation location among all recorded individuals of C. mongolicum within the plot was then selected as the spatial reference origin. The relative x-coordinate and relative y-coordinate represent the horizontal and vertical distances, respectively, of each individual from this reference point in the transformed planar coordinate system, with units of meters. In all panels, the size of each circle represents the relative volume of the corresponding plant, with larger circles indicating larger plant volumes.
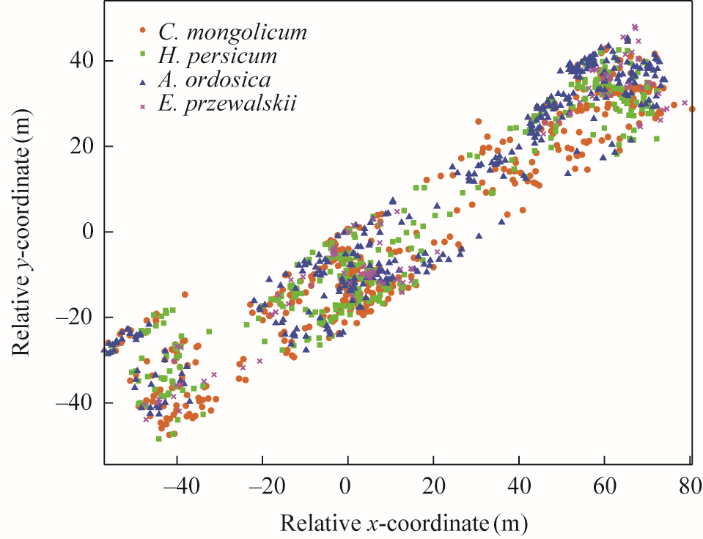
Fig. 3Spatial distributions of C. mongolicum and the co-occurring shrubs Haloxylon persicum Bunge ex Boiss. & Buhse, Ephedra distachya L., and Artemisia ordosica Krasch. The relative x- and y-coordinates are expressed in meters and were obtained using the same coordinate transformation and spatial reference procedure as those described for Figure 2.
Research category
Analysis component
Null model
Summary statistic
Intraspecific analysis
Spatial patterns of the overall population and life stages
CSR, HPP, and TH
g(r)
Life-stage spatial association
Bivariate CSR, and Bivariate HPP
g12(r)
Life-stage volume association
IM
ymm(r)
Spatial pattern of dead individuals
CSR RL
g(r)
Dead-living spatial association and differences in aggregation intensity
RL
g12(r) g22(r)-g11(r)
Potential nurse effect
RL
P(r)
Density-dependent effect
RL
g1,1+2(r)-g2,1+2(r)
Interspecific analysis
Interspecific spatial association
Bivariate CSR, Bivariate HPP, and TS
g12(r)
Table 1 Summary of spatial point pattern analyses, null models, and summary statistics used in this study
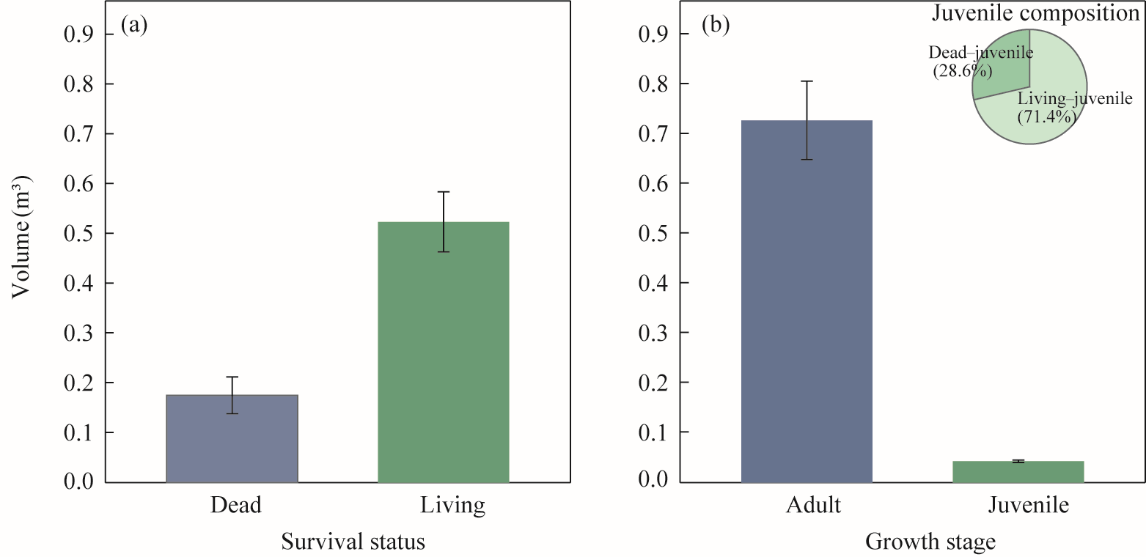
Fig. 4Intraspecific quantitative composition and morphological characteristics of C. mongolicum. (a), survival status of C. mongolicum individuals; (b), developmental stages of C. mongolicum individuals.
Species
Number
Percentage of population (%)
Height (cm)
Crown width in east-west direction (cm)
Crown width in north-south direction (cm)
Calligonum mongolicum Turcz.
481
38.4
40.92±0.98
84.24±2.57
86.99±2.63
Artemisia ordosica Krasch.
334
26.7
32.17±1.07
46.34±1.55
47.63±1.91
Ephedra distachya L.
96
7.7
55.70±2.75
242.36±14.47
260.90±15.26
Haloxylon persicum Bunge ex Boiss. & Buhse
341
27.2
75.52±4.43
49.62±3.17
51.49±3.66
Table 2 Quantitative composition and morphological characteristics of sand-fixing shrub communities
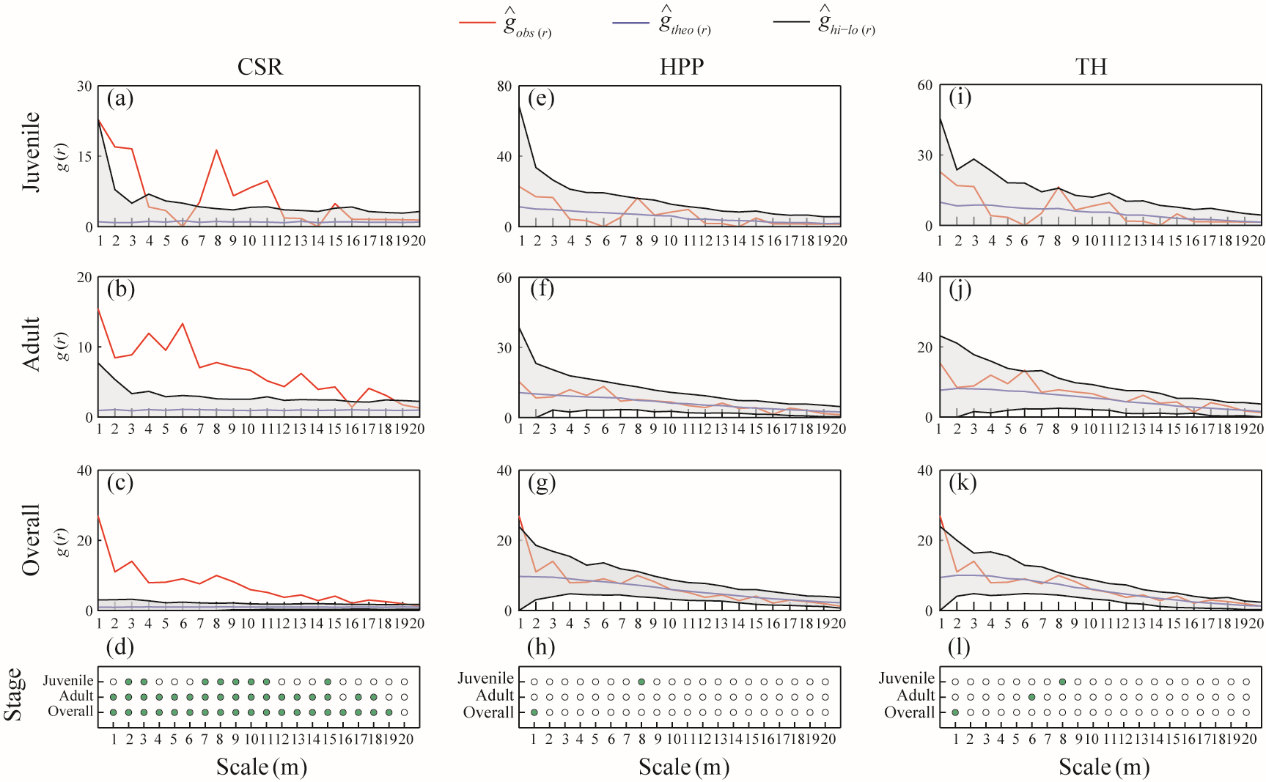
Fig. 5Spatial patterns of juvenile, adult, and overall C. mongolicum populations under complete spatial randomness (CSR; a-d), heterogeneous Poisson process (HPP; e-h), and Thomas process (TH; i-l) null models. The red line represents the observed values, the blue line represents the theoretical expectation, and the grey shaded areas represent the 95.0% simulation envelopes generated from 199 Monte Carlo simulations, with black boundary lines indicating their upper and lower limits. Green solid circles indicate significant aggregation, open circles indicate random distributions, and g(r) denotes pair correlation function used to characterize univariate spatial patterns.
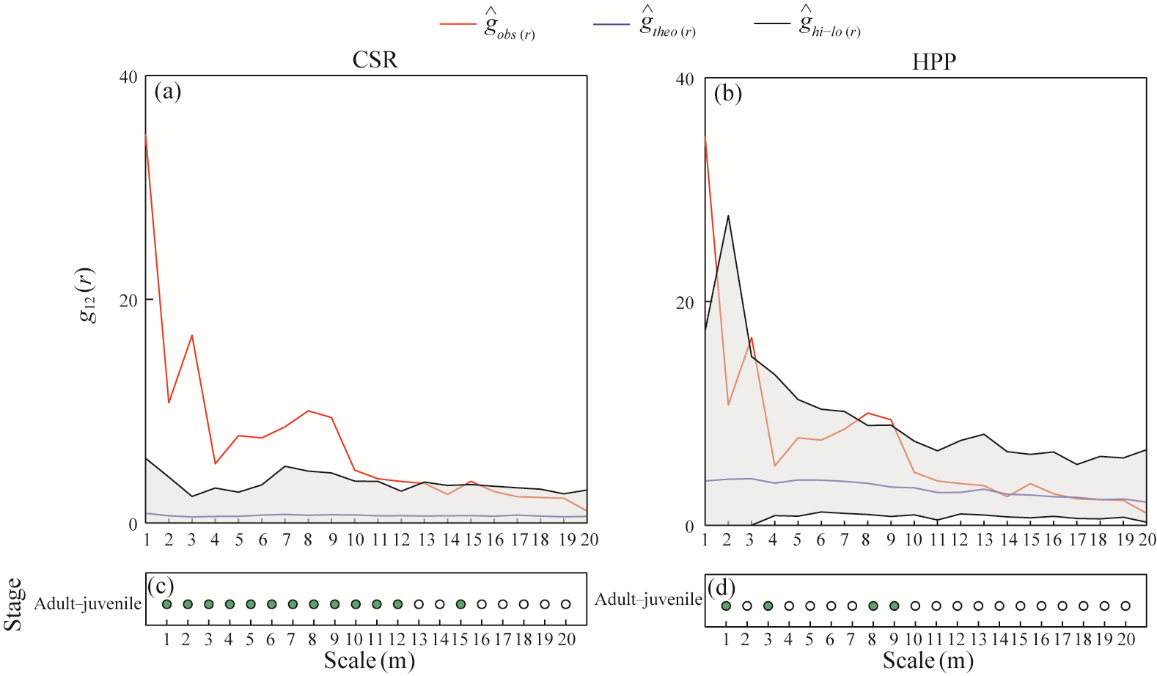
Fig. 6Spatial associations between juvenile and adult C. mongolicum under bivariate CSR (a and c) and HPP (b and d) null models. The red line represents the observed values, the blue line represents the theoretical expectation, and the grey shaded areas represent the 95.0% simulation envelopes generated from 199 Monte Carlo simulations, with black boundary lines indicating their upper and lower limits. Green solid circles indicate significant positive spatial associations, open circles indicate no significant spatial association, and g12(r) denotes cross pair correlation function used to characterize spatial associations between two point types.
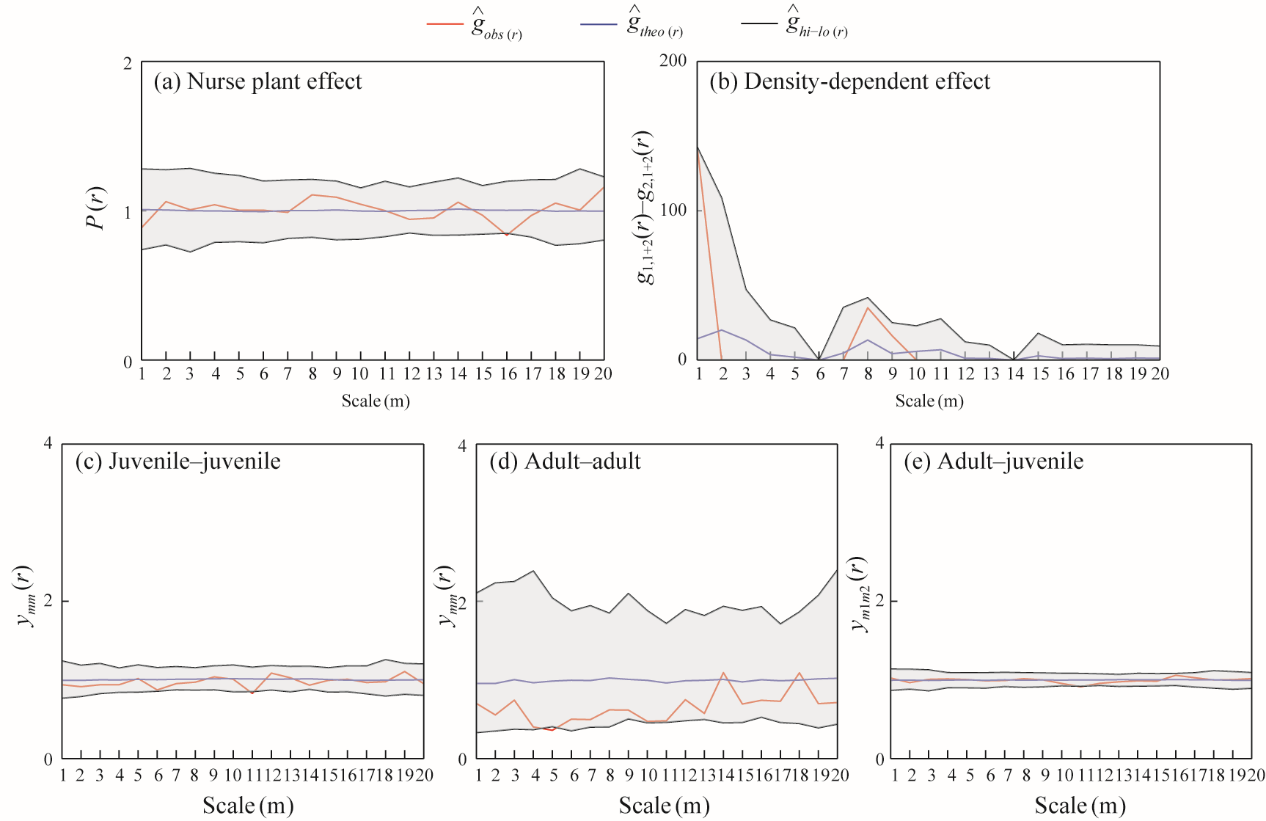
Fig. 7Intraspecific association analysis of C. mongolicum based on survival status and volume marks. (a), analysis of potential nurse effects; (b), density-dependent effects among juveniles; (c-d), volume-related spatial dependence among juveniles and adults, respectively; (e), volume-related spatial dependence between adults and juveniles. The red line represents the observed values, the blue line represents the theoretical expectation, and the grey shaded areas represent the 95.0% simulation envelopes generated from 199 Monte Carlo simulations, with black boundary lines indicating their upper and lower limits. P(r), conditional probability function used to evaluate juvenile survival probability in relation to adults; g1,1+2(r)-g2,1+2(r), difference in neighborhood density used to evaluate density-dependent effects; ymm(r), mark variogram used to evaluate spatial dependence in plant volume; ym1m2(r), bivariate mark variogram used to evaluate spatial dependence in plant volume between different life stages.
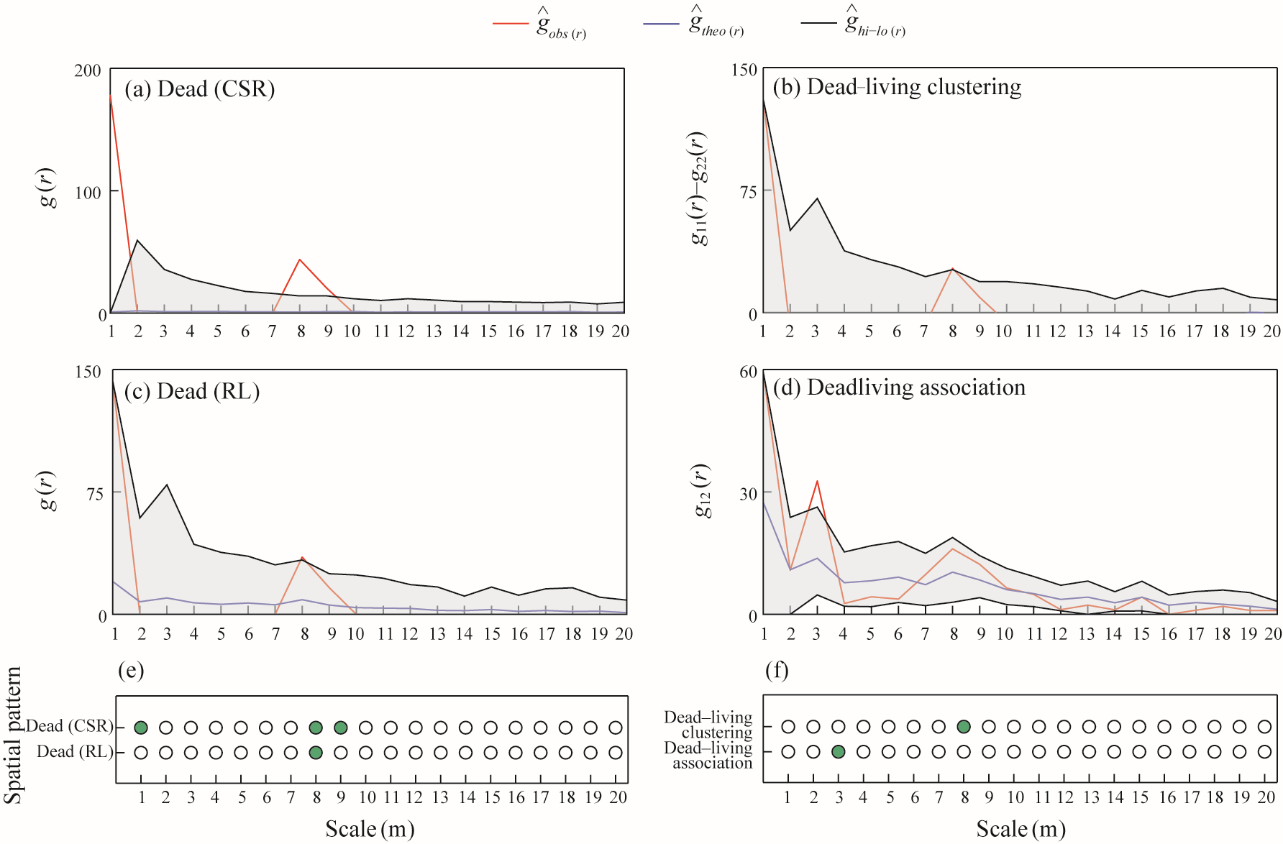
Fig. 8Spatial distributions and associations of dead and living individuals of the dominant shrub C. mongolicum. (a), spatial pattern of dead individuals of C. mongolicum under the CSR null model; (b), intraspecific aggregation intensity of dead individuals relative to living individuals; (c), spatial pattern of dead individuals of C. mongolicum under the random labeling (RL) null model; (d), spatial association between dead and living individuals. The red line represents the observed values, the blue line represents the theoretical expectation, and the grey shaded areas represent the 95.0% simulation envelopes generated from 199 Monte Carlo simulations, with black boundary lines indicating their upper and lower limits. The dots below each subplot indicate the significance of the observed statistics relative to the corresponding null model at different spatial scales: green solid dots indicate that the observed values are significantly higher than the confidence envelope of the null model, and white open dots indicate no significant deviation from the null model.
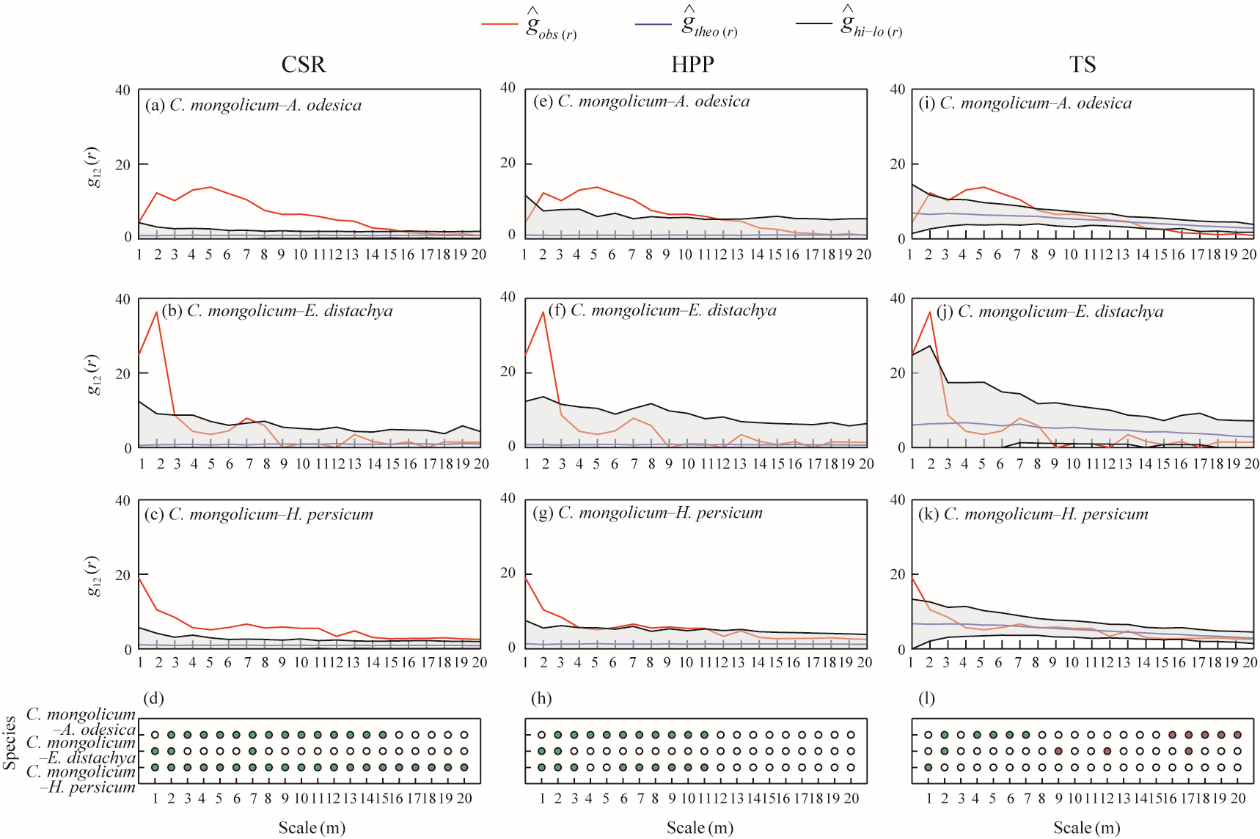
Fig. 9Spatial associations between the dominant shrub C. mongolicum and three co-occurring shrubs (A. ordosica, E. distachya, and H. persicum) under CSR (a-d), HPP (e-h), and toroidal shift (TS; i-l) null models. The red line represents the observed values, the blue line represents the theoretical expectation, and the grey shaded areas represent the 95.0% simulation envelopes generated from 199 Monte Carlo simulations, with black boundary lines indicating their upper and lower limits. Green solid circles indicate positive spatial associations, and open circles indicate no association.
[1]
Aakala T, Fraver S, Palik B J, et al. 2012. Spatially random mortality in old-growth red pine forests of northern Minnesota. Canadian Journal of Forest Research, 42(5): 899-907.
doi: 10.1139/x2012-044
[2]
Alvarez-Yepiz J C, Búrquez A, Dovčiak M. 2014. Ontogenetic shifts in plant-plant interactions in a rare cycad within angiosperm communities. Oecologia, 175(2): 725-735.
doi: 10.1007/s00442-014-2929-3
[3]
Ben-Said M. 2021. Spatial point-pattern analysis as a powerful tool in identifying pattern-process relationships in plant ecology: an updated review. Ecological Processes, 10(1): 56, doi: 10.1186/s13717-021-00314-4.
[4]
Berdugo M, Kéfi S, Soliveres S, et al. 2017. Plant spatial patterns identify alternative ecosystem multifunctionality states in global drylands. Nature Ecology & Evolution, 1(2): 0003, doi: 10.1038/s41559-016-0003.
[5]
Bertness M D, Callaway R. 1994. Positive interactions in communities. Trends in Ecology & Evolution, 9(5): 191-193.
doi: 10.1016/0169-5347(94)90088-4
[6]
Castanho C T, Oliveira A A, Prado P I K. 2015. Does extreme environmental severity promote plant facilitation? An experimental field test in a subtropical coastal dune. Oecologia, 178(3): 855-866.
doi: 10.1007/s00442-015-3285-7
pmid: 25761446
[7]
Chen S, Wang C L, Ren Y C, et al. 2023. Spatial autocorrelation patterns and influencing factors of tree radial growth in the secondary Picea forest in Guandi Mountains, northern China. Acta Ecologica Sinica, 43(4): 1572-1583. (in Chinese)
[8]
Connell J H, Slatyer R O. 1977. Mechanisms of succession in natural communities and their role in community stability and organization. The American Naturalist, 111(982): 1119-1144.
doi: 10.1086/283241
[9]
D'Odorico P, Bhattachan A, Davis K F, et al. 2013. Global desertification: Drivers and feedbacks. Advances in Water Resources, 51: 326-344.
doi: 10.1016/j.advwatres.2012.01.013
[10]
Eccles N S, Esler K J, Cowling R M. 1999. Spatial pattern analysis in Namaqualand desert plant communities: evidence for general positive interactions. Plant Ecology, 142(1): 71-85.
doi: 10.1023/A:1009857824912
[11]
Fan B L, McHugh A D, Guo S J, et al. 2018. Factors influencing the natural regeneration of the pioneering shrub Calligonum mongolicum in sand dune stabilization plantations in arid deserts of Northwest China. Ecology and Evolution, 8(5): 2975-2984.
doi: 10.1002/ece3.2018.8.issue-5
[12]
Flores J, Jurado E. 2003. Are nurse‐protégé interactions more common among plants from arid environments? Journal of Vegetation Science, 14(6): 911-916.
doi: 10.1111/jvs.2003.14.issue-6
[13]
Getzin S, Wiegand T, Wiegand K, et al. 2008. Heterogeneity influences spatial patterns and demographics in forest stands. Journal of Ecology, 96(4): 807-820.
doi: 10.1111/jec.2008.96.issue-4
[14]
Getzin S, Worbes M, Wiegand T, et al. 2011. Size dominance regulates tree spacing more than competition within height classes in tropical Cameroon. Journal of Tropical Ecology, 27(1): 93-102.
doi: 10.1017/S0266467410000453
[15]
Gu T Y, Zhang D H, Shan L S, et al. 2023. Spatial heterogeneity of plant height-crown width of sand-binding shrubs in semi-fixed dunes along the southern edge of the Gurbantunggüt Desert. Plant Science Journal, 41(3): 312-321. (in Chinese)
[16]
Hacker S D, Gaines S D. 1997. Some implications of direct positive interactions for community species diversity. Ecology, 78(7): 1990-2003.
doi: 10.1890/0012-9658(1997)078[1990:SIODPI]2.0.CO;2
[17]
He Q, Bertness M D, Altieri A H. 2013. Global shifts towards positive species interactions with increasing environmental stress. Ecology Letters, 16(5): 695-706.
doi: 10.1111/ele.12080
pmid: 23363430
[18]
He Q, Bertness M D. 2014. Extreme stresses, niches, and positive species interactions along stress gradients. Ecology, 95(6): 1437-1443.
doi: 10.1890/13-2226.1
pmid: 25039207
[19]
Holmgren M, Scheffer M, Huston M A. 1997. The interplay of facilitation and competition in plant communities. Ecology, 78(7): 1966-1975.
doi: 10.1890/0012-9658(1997)078[1966:TIOFAC]2.0.CO;2
[20]
Holmgren M, Scheffer M. 2010. Strong facilitation in mild environments: the stress gradient hypothesis revisited. Journal of Ecology, 98(6): 1269-1275.
doi: 10.1111/jec.2010.98.issue-6
[21]
Inouye R S. 1980. Density-dependent germination response by seeds of desert annuals. Oecologia, 46(2): 235-238.
doi: 10.1007/BF00540131
pmid: 28309678
[22]
Jia Y M, Liu T, Luo C, et al. 2008. Comparative study on the spatial heterogeneity of four shrub species in southern marginal zone of the Mosuowan Desert. Arid Zone Research, 25(2): 225-230. (in Chinese)
doi: 10.3724/SP.J.1148.2008.00225
[23]
Kikvidze Z, Khetsuriani L, Kikodze D. 2005. Small‐scale guild proportions and niche complementarity in a Caucasian subalpine hay meadow. Journal of Vegetation Science, 16(5): 565-570.
doi: 10.1111/jvs.2005.16.issue-5
[24]
Kitzberger T, Steinaker D F, Veblen T T. 2000. Effects of climatic variability on facilitation of tree establishment in northern Patagonia. Ecology, 81(7): 1914-1924.
doi: 10.1890/0012-9658(2000)081[1914:EOCVOF]2.0.CO;2
[25]
Lara-Romero C, de la Cruz M, Escribano‐Ávila G, et al. 2016. What causes conspecific plant aggregation? Disentangling the role of dispersal, habitat heterogeneity and plant-plant interactions. Oikos, 125(9): 1304-1313.
doi: 10.1111/oik.2016.v125.i9
[26]
Le Bagousse‐Pinguet Y, Xiao S, Brooker R W, et al. 2014. Facilitation displaces hotspots of diversity and allows communities to persist in heavily stressed and disturbed environments. Journal of Vegetation Science, 25(1): 66-76.
doi: 10.1111/jvs.2013.25.issue-1
[27]
Li C J, Han H, Ablimiti M, et al. 2022a. Morphological and physiological responses of desert plants to drought stress in a man-made landscape of the Taklimakan Desert shelter belt. Ecological Indicators, 140: 109037, doi: 10.1016/j.ecolind.2022.109037.
[28]
Li G L, Zhang D H, Zhang Z S, et al. 2021. Population dynamics of main sand-fixing shrubs in the Gurbantunggut Desert. Journal of Desert Research, 41(2): 129-137. (in Chinese)
doi: 10.7522/j.issn.1000-694X.2020.00103
[29]
Li S, Zhang D H, Zhang Z Z. 2022b. Spatial distribution pattern and correlation of Artemisia halodendron population in Horqin Sandy Land, China. Biotic Resources, 44(1): 63-72. (in Chinese)
[30]
Li X R, Zhang Z S, Huang L, et al. 2013. Review of the ecohydrological processes and feedback mechanisms controlling sand-binding vegetation systems in sandy desert regions of China. Chinese Science Bulletin, 58(13): 1483-1496. (in Chinese)
doi: 10.1007/s11434-012-5662-5
[31]
Liancourt P, Le Bagousse-Pinguet Y, Rixen C, et al. 2017. SGH: stress or strain gradient hypothesis? Insights from an elevation gradient on the roof of the world. Annals of Botany, 120(1): 29-38.
doi: 10.1093/aob/mcx037
pmid: 28444363
[32]
Liu J, Bai X J, Yin Y, et al. 2021. Spatial patterns and associations of tree species at different developmental stages in a montane secondary temperate forest of northeastern China. PeerJ, 9: e11517, doi: 10.7717/peerj.11517.
[33]
Liu Y. 2019. Reproductive characteristics of Calligonum mongolicum in different habitats in the desert-oasis ecotone of Hexi Corridor. MSc Thesis. Linfen: Shanxi Normal University. (in Chinese)
[34]
Liu Y X, Zeng Y, Yang Y H, et al. 2022. Competition, spatial pattern, and regeneration of Haloxylon ammodendron and Haloxylon persicum communities in the Gurbantunggut Desert, Northwest China. Journal of Arid Land, 14(10): 1138-1158.
doi: 10.1007/s40333-022-0105-x
[35]
Lu L N, Zhang D H, Li G L. 2022. Crown prediction models of the sand-fixing shrubs in Gurbantunggut Desert. Ecological Science, 41(5): 81-89. (in Chinese)
[36]
Ma R X, Li J X, Guo Y L, et al. 2024. Recruitment dynamics in a tropical karst seasonal rain forest: revealing complex processes from spatial patterns. Forest Ecology and Management, 553: 121610, doi: 10.1016/j.foreco.2023.121610.
[37]
Maestre F T, Callaway R M, Valladares F, et al. 2009. Refining the stress‐gradient hypothesis for competition and facilitation in plant communities. Journal of Ecology, 97(2): 199-205.
doi: 10.1111/jec.2009.97.issue-2
[38]
Michalet R, Le Bagousse-Pinguet Y, Maalouf J P, et al. 2014. Two alternatives to the stress‐gradient hypothesis at the edge of life: the collapse of facilitation and the switch from facilitation to competition. Journal of Vegetation Science, 25(2): 609-613.
doi: 10.1111/jvs.2014.25.issue-2
[39]
Michalet R, Brooker R W, Lortie C J, et al. 2015. Disentangling direct and indirect effects of a legume shrub on its understorey community. Oikos, 124(9): 1251-1262.
doi: 10.1111/oik.2015.v124.i9
[40]
Montgomery R A, Reich P B, Palik B J. 2010. Untangling positive and negative biotic interactions: views from above and below ground in a forest ecosystem. Ecology, 91(12): 3641-3655.
pmid: 21302835
[41]
Niu C X, Zhang D H, Zhang Z S, et al. 2024. Spatial distribution pattern and spatial correlation of main sand-fixing shrubs in fixed dunes in Yanchi region, Mu Us Sandy Land. Ecological Science, 43(1): 1-9. (in Chinese)
[42]
North A, Ovaskainen O. 2007. Interactions between dispersal, competition, and landscape heterogeneity. Oikos, 116(7): 1106-1119.
doi: 10.1111/oik.2007.116.issue-7
[43]
O'Brien M J, Pugnaire F I, Armas C, et al. 2017. The shift from plant-plant facilitation to competition under severe water deficit is spatially explicit. Ecology and Evolution, 7(7): 2441-2448.
doi: 10.1002/ece3.2875
pmid: 28405307
[44]
Omelko A, Ukhvatkina O, Zhmerenetsky A, et al. 2018. From young to adult trees: How spatial patterns of plants with different life strategies change during age development in an old-growth Korean pine-broadleaved forest. Forest Ecology and Management, 411: 46-66.
doi: 10.1016/j.foreco.2018.01.023
[45]
Perea A J, Wiegand T, Garrido J L, et al. 2022. Spatial phylogenetic and phenotypic patterns reveal ontogenetic shifts in ecological processes of plant community assembly. Oikos, 2022(12): e09260, doi: 10.1111/oik.09260.
[46]
Plotkin J B, Potts M D, Leslie N, et al. 2000. Species-area curves, spatial aggregation, and habitat specialization in tropical forests. Journal of Theoretical Biology, 207(1): 81-99.
doi: 10.1006/jtbi.2000.2158
pmid: 11027481
[47]
Pugnaire F I, Luque M T. 2001. Changes in plant interactions along a gradient of environmental stress. Oikos, 93(1): 42-49.
doi: 10.1034/j.1600-0706.2001.930104.x
[48]
Schöb C, Armas C, Pugnaire F I. 2013. Direct and indirect interactions co‐determine species composition in nurse plant systems. Oikos, 122(9): 1371-1379.
doi: 10.1111/more.2013.122.issue-9
[49]
Segoli M, Ungar E D, Giladi I, et al. 2012. Untangling the positive and negative effects of shrubs on herbaceous vegetation in drylands. Landscape Ecology, 27(6): 899-910.
doi: 10.1007/s10980-012-9736-1
[50]
Shen Z Q, Lu J, Hua M, et al. 2018. Population structure and spatial pattern analysis of Quercus aquifolioides on Sejila Mountain, Tibet, China. Journal of Forestry Research, 29(2): 405-414.
doi: 10.1007/s11676-017-0444-1
[51]
Shi Y F, Zhang Z S, Huang L, et al. 2016. Species composition and population structure of plant communities on semi-fixed dunes of the Gurbantongut Desert, China. Chinese Journal of Applied Ecology, 27(4): 1024-1030. (in Chinese)
doi: 10.13287/j.1001-9332.201604.013
[52]
Silver E J, Fraver S, D'amato A W, et al. 2013. Long-term mortality rates and spatial patterns in an old-growth Pinus resinosa forest. Canadian Journal of Forest Research, 43(9): 809-816.
doi: 10.1139/cjfr-2013-0139
[53]
Sivakumar M V K. 2011. Climate and land degradation. In: Sauer T J, Norman J M, Sivakumar M V K. Sustaining Soil Productivity in Response to Global Climate Change: Science, Policy, and Ethics. Ames: Wiley-Blackwell, 141-154.
[54]
Soliveres S, Eldridge D J, Hemmings F, et al. 2012. Nurse plant effects on plant species richness in drylands: the role of grazing, rainfall and species specificity. Perspectives in Plant Ecology, Evolution and Systematics, 14(6): 402-410.
pmid: 25914602
[55]
Soliveres S, Smit C, Maestre F T. 2015. Moving forward on facilitation research: response to changing environments and effects on the diversity, functioning and evolution of plant communities. Biological Reviews, 90(1): 297-313.
doi: 10.1111/brv.2015.90.issue-1
[56]
Sun Y H, Zhang D H, Zhang Z S. 2022. Relationship between soil moisture content and topography-vegetation factors in different types of dunes in the Tengger Desert. Arid Land Geography, 45(5): 1570-1578. (in Chinese)
doi: 10.12118/j.issn.1000-6060.2022.027
[57]
Tang R Y, Zhang D H, Zhao Y Y, et al. 2025. Spatial point pattern of Artemisia ordosica shrubland on fixed sand dunes in the Mu Us Sandy Land, China. Chinese Journal of Applied Ecology, 36(3): 719-728. (in Chinese)
[58]
Valladares F, Zaragoza-Castells J, Sánchez-Gómez D, et al. 2008. Is shade beneficial for Mediterranean shrubs experiencing periods of extreme drought and late-winter frosts? Annals of Botany, 102(6): 923-933.
doi: 10.1093/aob/mcn182
pmid: 18819947
[59]
Wang G, Zhu X, Yang J. 2023a. Spatial distribution characteristics of a Pinus tabuliformis forest in the central dry zone of Ningxia, China. Australian Forestry, 86(2): 82-89.
doi: 10.1080/00049158.2023.2257432
[60]
Wang R, Li J R, Dong L, et al. 2023b. Water use strategy of Reaumuria songarica population in steppe desert region based on spatial distribution. Bulletin of Soil and Water Conservation, 43(5): 270-278. (in Chinese)
[61]
Wang X G, Wiegand T, Hao Z Q, et al. 2010. Species associations in an old‐growth temperate forest in north‐eastern China. Journal of Ecology, 98(3): 674-686.
doi: 10.1111/jec.2010.98.issue-3
[62]
Wang X T, Hou Y L, Liang C Z, et al. 2012. Point pattern analysis based on different null models for detecting spatial patterns. Biodiversity Science, 20(2): 151-158. (in Chinese)
doi: 10.3724/SP.J.1003.2012.08163
[63]
Wang Z F, Hu S J, Li H. 2018. Evapotranspiration characteristics of Haloxylon ammodendron community in interdune lowland at the southern edge of Gurbantunggut Desert. Arid Land Geography, 41(6): 1303-1309. (in Chinese)
[64]
Wiegand T, Moloney K A. 2004. Rings, circles, and null‐models for point pattern analysis in ecology. Oikos, 104(2): 209-229.
doi: 10.1111/oik.2004.104.issue-2
[65]
Wilson J B, Roxburgh S H. 2001. Intrinsic guild structure: determination from competition experiments. Oikos, 92(1): 189-192.
doi: 10.1034/j.1600-0706.2001.920123.x
[66]
Wright A, Schnitzer S A, Reich P B. 2014. Living close to your neighbors: the importance of both competition and facilitation in plant communities. Ecology, 95(8): 2213-2223.
pmid: 25230472
[67]
Wu G Y, Zhang D H, Zhang Z S, et al. 2024. Spatial structure characteristics of sand-fixing shrubs on semi-fixed dunes in Gurbantunggut Desert. Acta Agrestia Sinica, 32(7): 2190-2204. (in Chinese)
[68]
Xiao J, Eziz A, Zhang H, et al. 2019. Responses of four dominant dryland plant species to climate change in the Junggar Basin, Northwest China. Ecology and Evolution, 9(23): 13596-13607.
doi: 10.1002/ece3.v9.23
[69]
Xiao J H, Wen Q Y, Zhong Z F, et al. 2024. Interspecific association and environmental interpretation of dominant species in shrub layer of Pinus massoniana community on Chinese islands. Ecology and Evolution, 14(12): e70647, doi: 10.1002/ece3.70647.
[70]
Yang X T. 2012. Review of forest communities competition. Science and Technology of Qinghai Agriculture and Forestry, 1: 29-33. (in Chinese)
[71]
Zhang C, Zhang M J, Xu C, et al. 2007a. Analysis of aggregation in desert plant species in Sand Lake, Ningxia Autonomous Region, China. Chinese Journal of Plant Ecology, 31(1): 32-39. (in Chinese)
doi: 10.17521/cjpe.2007.0005
[72]
Zhang G F, Zhao L W, Yang Q Y, et al. 2016. Effect of desert shrubs on fine-scale spatial patterns of understory vegetation in a dry-land. Plant Ecology, 217(9): 1141-1155.
doi: 10.1007/s11258-016-0639-0
[73]
Zhang G F, Zhao W Z, Zhou H, et al. 2018. Extreme drought stress shifts net facilitation to neutral interactions between shrubs and sub‐canopy plants in an arid desert. Oikos, 127(3): 381-391.
doi: 10.1111/oik.2017.v127.i3
[74]
Zhang H N, Zhou D Q, Qian Z D, et al. 2022. Spatial distribution pattern and competitive symmetry of dominant species in Musa sp. community in the hot and humid river valley. Acta Ecologica Sinica, 42(7): 2853-2864. (in Chinese)
[75]
Zhang Q H, Lü J, Ma Y, et al. 2024. Microbial community structure and potential function of algal crusts in different regions of Gurbantunggut Desert, Xinjiang, China. Acta Ecologica Sinica, 44(14): 6317-6330. (in Chinese)
[76]
Zhang R, Zhou X B, Zhang Y M. 2019. Affects of biological soil crusts on litter decomposition in the Gurbantunggut Desert. Journal of Desert Research, 39(6): 151-158. (in Chinese)
doi: 10.7522/j.issn.1000-694X.2019.00013
[77]
Zhang Y M, Chen J, Wang X Q, et al. 2005. The distribution patterns of biological soil crust in Gurbantunggut Desert. Acta Geographica Sinica, 60(1): 53-60. (in Chinese)
doi: 10.11821/xb200501006
[78]
Zhang Y M, Chen J, Wang L, et al. 2007b. The spatial distribution patterns of biological soil crusts in the Gurbantunggut Desert, northern Xinjiang, China. Journal of Arid Environments, 68(4): 599-610.
doi: 10.1016/j.jaridenv.2006.06.012
[79]
Zhuang Y L, Zhao W Z, Xie G X, et al. 2008. The features of Calligonum mongolicum population and its expansion process in sandy habitat. Acta Ecologica Sinica, 28(4): 1399-1407.