Precipitation dominates the mortality of Caragana korshinskii on the Loess Plateau with a threshold response
MU Mengyu1,2, GUAN Chao1,2, ZHAO Chenguang1,2,3, SONG Xinyang1,2, WANG Jiazheng1,2, ZHAO Changming1,2,*()
1State Key Laboratory of Herbage Improvement and Grassland Agro-ecosystems, College of Ecology, Lanzhou University, Lanzhou 730000, China 2Yuzhong Mountain Ecosystem Observation and Research Station, Lanzhou University, Lanzhou 730000, China 3Alxa League Forestry and Grassland Protection Station, Alxa League 750306, China
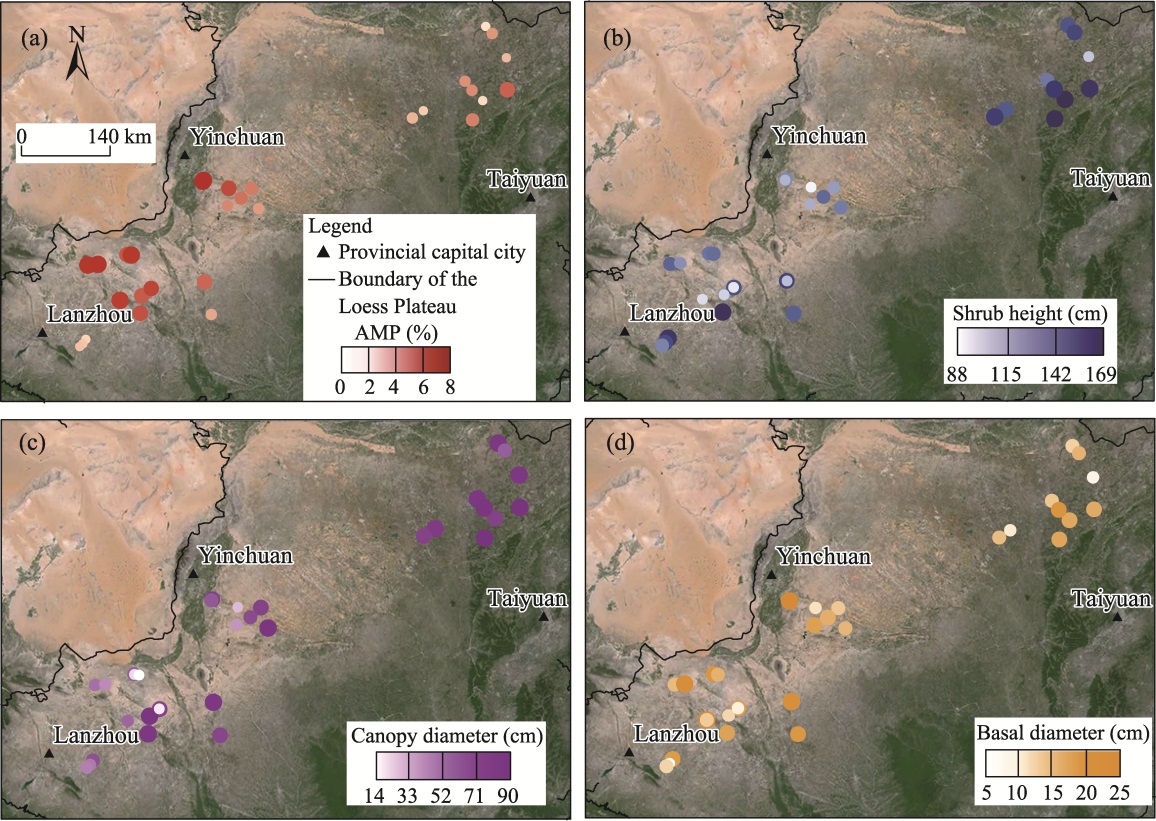
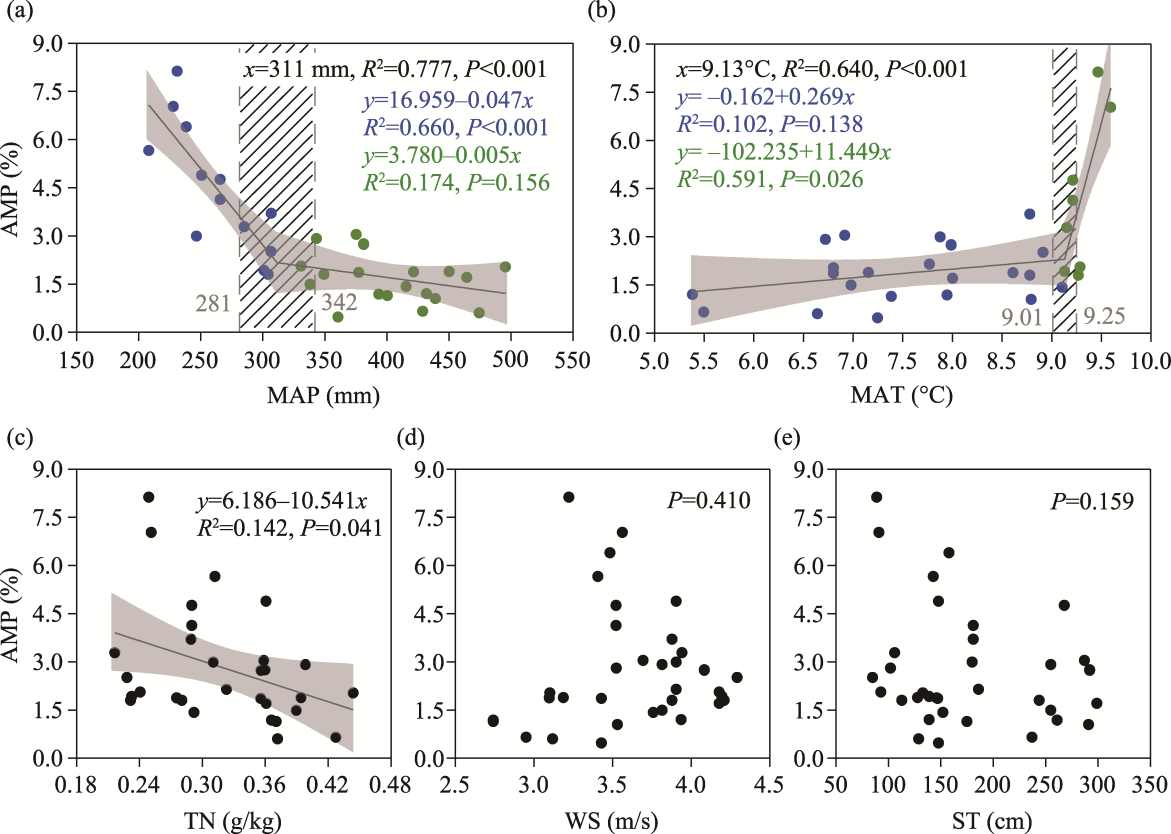
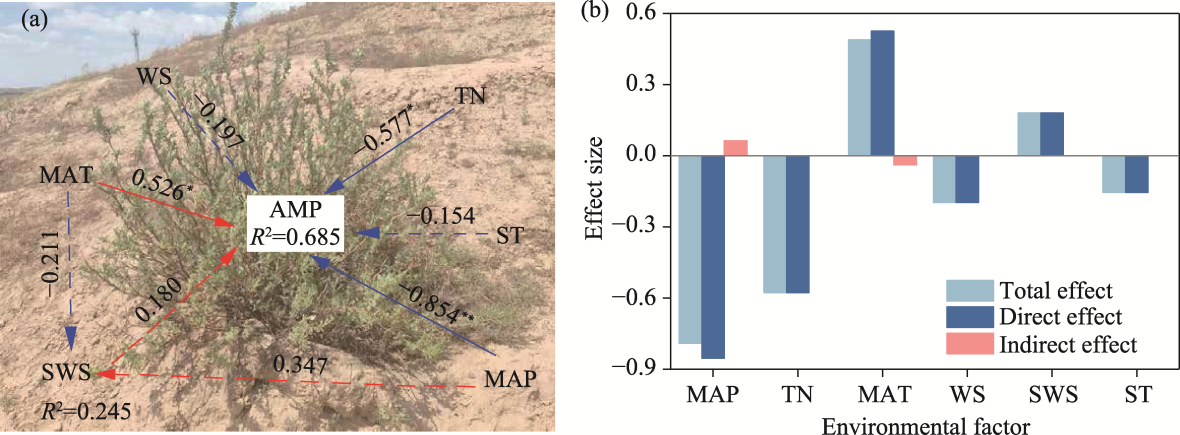
Shrub mortality is accelerating globally, yet the mechanisms and thresholds driving vegetation mortality in dryland shrubs remain insufficiently understood. Caragana korshinskii Kom., a key species for dryland restoration in China, has experienced widespread die-off in recent decades. This study aimed to identify the important drivers of C. korshinskii mortality on the Loess Plateau, China. We surveyed 35 C. korshinskii plantation plots (three 30 m×30 m subplots per sampling plot) across the western Loess Plateau. In each subplot, we measured the plant height, canopy diameter, and basal diameter of 30 randomly selected individuals and recorded the total number of live and dead shrubs to calculate the annual mortality probability (AMP). Environmental factors encompassing climate, soil, topography, and disturbance were compiled for each sampling plot. Spearman's correlation and ridge regression analyses were applied to determine the most driving factors. Piecewise linear models were then used to determine their breakpoints, and partial least squares path model (PLS-PM) was employed to quantify their effects on AMP. The results revealed that AMP exhibited a clear spatial gradient, decreasing from the west to the east across the study area. AMP decreased with increasing mean annual precipitation (MAP) but increased sharply when the MAP fell below 311 mm, suggesting a discontinuous response around this statistical breakpoint. Similarly, AMP increased markedly when the mean annual temperature (MAT) exceeded its statistical breakpoint of 9.13°C. Higher total nitrogen (TN) was associated with a gradual decline in AMP, whereas wind speed and soil thickness were not clearly related. PLS-PM confirmed that MAP is the principal direct driving factor, with TN and MAT making secondary contributions. Our findings reveal that MAP is the key environmental driver of C. korshinskii mortality, with the statistical breakpoint (311 mm) providing critical insights into vegetation stability and implications for the sustainable management and restoration of dryland ecosystems under climate change.
Received: 29 April 2026
Published: 31 October 2026
Conceptualization: GUAN Chao; Data curation: MU Mengyu, ZHAO Chenguang, SONG Xinyang, WANG Jiazheng; Formal analysis: MU Mengyu; Investigation: MU Mengyu, ZHAO Chenguang, SONG Xinyang; Methodology: GUAN Chao, ZHAO Chenguang; Resources: ZHAO Changming; Visualization: MU Mengyu; Writing - original draft: MU Mengyu, ZHAO Chenguang, SONG Xinyang, WANG Jiazheng; Writing - review and editing: GUAN Chao, ZHAO Changming; Funding acquisition: ZHAO Changming; Supervision: GUAN Chao, ZHAO Changming. All authors approved the manuscript.
MU Mengyu, GUAN Chao, ZHAO Chenguang, SONG Xinyang, WANG Jiazheng, ZHAO Changming. Precipitation dominates the mortality of Caragana korshinskii on the Loess Plateau with a threshold response. Journal of Arid Land, 2026, 18(10): 1813-1830.
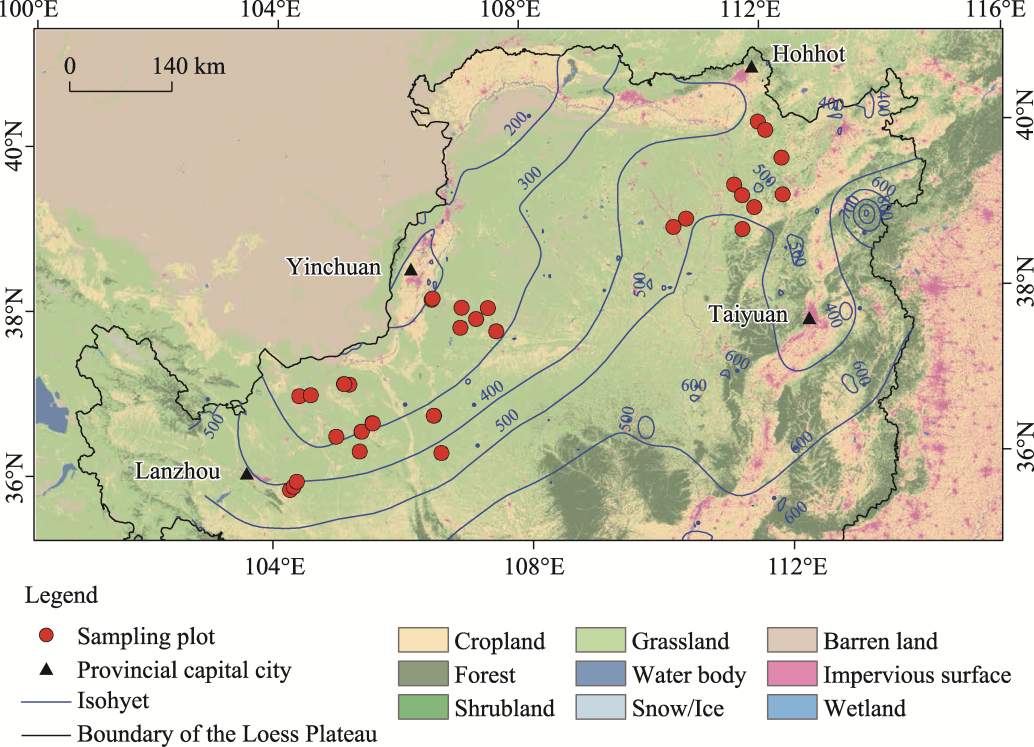
Fig. 1Spatial distribution of sampling plots and land use types in the study area (Loess Plateau)
Plot ID
Elevation (m)
Slope (°)
Aspect
Soil texture
Planting density (plants/hm2)
MAP (mm)
MAT (°C)
1
1147
0
\
Silt loam
1519
361
7.25
2
1371
6
Semi-sunny
Silt loam
1756
475
6.64
3
2297
13
Semi-shady
Silt loam
2400
429
5.50
4
1226
16
Shady
Silt loam
356
439
8.79
5
2059
19
Semi-shady
Silt loam
1600
401
7.39
6
1879
15
Sunny
Silt loam
2000
393
7.95
7
1545
14
Semi-sunny
Silt loam
933
432
5.38
8
1465
19
Semi-sunny
Silt loam
1630
416
9.11
9
2089
15
Semi-shady
Silt loam
1600
338
6.98
10
1790
26
Semi-shady
Silt loam
956
465
8.00
11
1716
25
Semi-shady
Silt loam
1085
304
8.78
12
1346
10
Semi-sunny
Silt loam
722
349
9.27
13
1252
6
Shady
Silt loam
1111
377
6.80
14
1121
15
Sunny
Silt loam
885
422
8.61
15
1388
9
Shady
Silt loam
919
450
7.16
16
1450
0
\
Sand
2800
301
9.13
17
1564
10
Semi-shady
Silt loam
933
496
6.80
18
1324
0
\
Silt loam
804
331
9.29
19
1950
15
Shady
Silt loam
700
249
7.77
20
1453
0
\
Sandy loam
1867
307
8.91
21
1829
22
Semi-shady
Silt loam
700
381
7.99
22
1884
20
Sunny
Silt loam
2400
381
7.99
23
1748
9
Shady
Silt loam
1737
474
5.27
24
2128
34
Semi-sunny
Silt loam
1385
343
6.72
25
1838
0
\
Silt loam
2000
247
7.88
26
1930
25
Shady
Silt loam
537
375
6.92
27
1407
0
\
Silt loam
3200
285
9.15
28
1832
0
\
Silt loam
1200
307
8.78
29
1717
26
Semi-sunny
Silt loam
956
266
9.21
30
1701
18
Semi-shady
Silt loam
1600
266
9.21
31
1761
9
Sunny
Silt loam
2800
251
7.72
32
2059
14
Shady
Silt loam
1600
208
8.93
33
1728
8
Shady
Silt loam
1600
238
6.97
34
1296
5
Semi-shady
Sandy loam
1648
228
9.60
35
1303
8
Shady
Sandy loam
3100
231
9.47
Table 1 Basic environmental characteristics of the sampling plots
Factor
Resolution
Data source
Photosynthetically active radiation (PAR)
5 km
MODIS/061/MCD18C2 (https://modis.gsfc.nasa.gov)
Wind speed
9 km
ERA5-Land (https://cds.climate.copernicus.eu)
Standardized precipitation evapotranspiration index (SPEI)
1 km
National Ecosystem Data Bank (https://www.scidb.cn)
Potential evapotranspiration (PET)
500 m
MODIS/061/MOD16A2 (https://modis.gsfc.nasa.gov)
Vapor pressure deficit (VPD)
1 km
National Tibetan Plateau Center/Third Pole Environment Data Center (http://data.tpdc.ac.cn)
Relative humidity
1 km
Mean annual temperature (MAT)
1 km
Mean annual precipitation (MAP)
1 km
Soil water content (SWC)
9 km
Total potassium (TK)
1 km
National Earth System Science Data Center, National Science and Technology Infrastructure of China (https://www.geodata.cn)
Total phosphorus (TP)
Total soil nitrogen (TN)
Bulk density (BD)
pH
Gravel content
Sand content
Silt content
Clay content
Soil thickness
Table S1 Information on the remote sensing data
Fig. 2Spatial distribution of annual mortality probability (AMP; a), shrub height (b), canopy diameter (c), and basal diameter (d) in the study area. The point color and size are proportional to the values; darker colors and larger points indicate higher values, whereas lighter colors and smaller points indicate lower values. The basemap data were obtained from the GEOVIS Earth Platform (https://geovisearth.com/) in 2024.
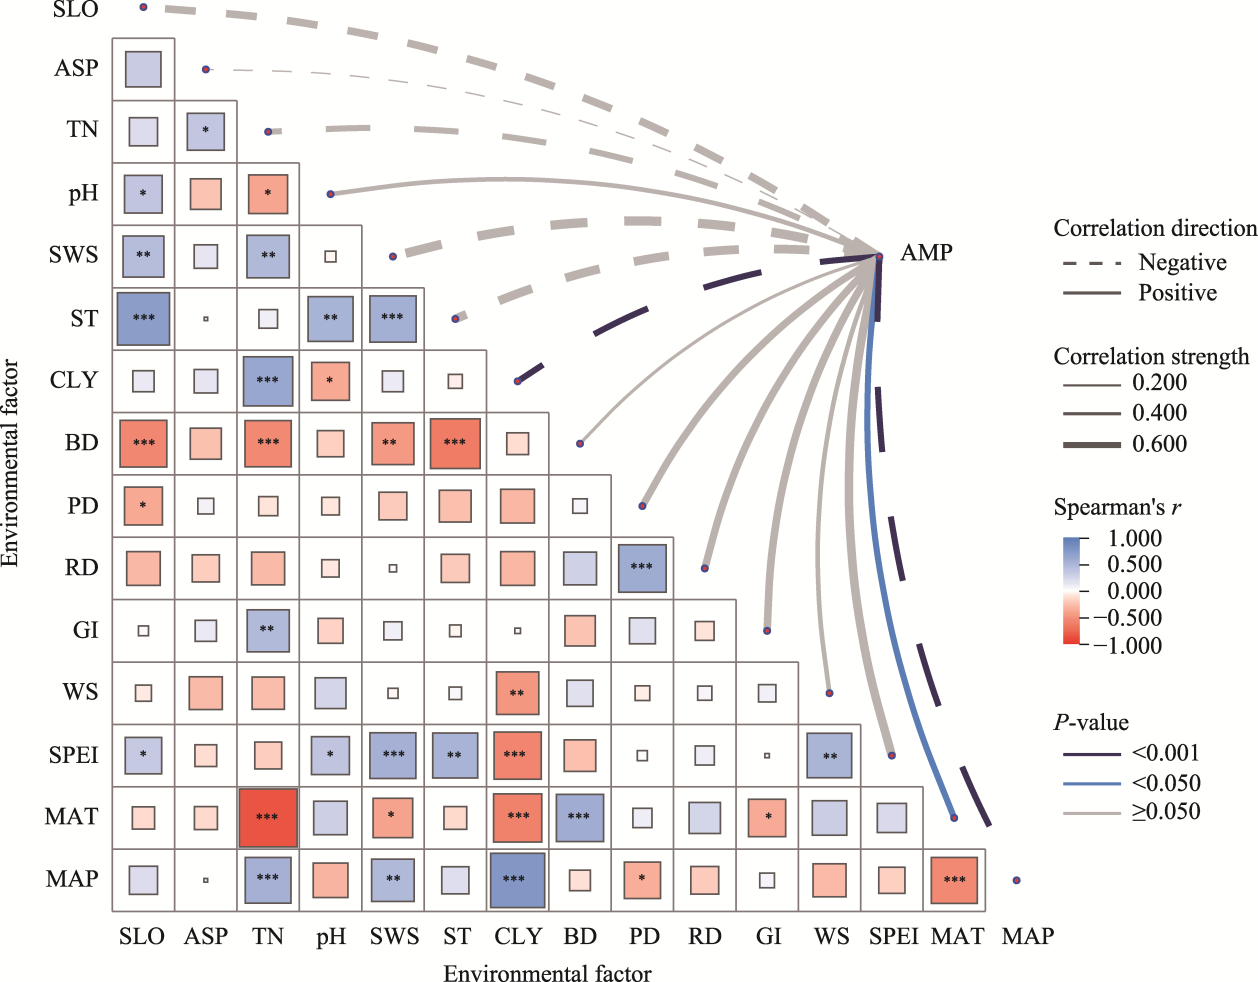
Fig. 3Correlations between AMP and environmental factors, as well as the correlations among these environmental factors. SLO, slope; ASP, aspect; TN, total nitrogen; SWS, soil water storage; ST, soil thickness; CLY, clay content; BD, bulk density; PD, planting density; RD, rodent density; GI, grazing intensity; WS, wind speed; SPEI, standardized precipitation evapotranspiration index; MAT, mean annual temperature; MAP, mean annual precipitation. The network graph shows correlations between environmental factors and AMP, with line thickness indicating correlation strength, and solid and dashed lines representing positive and negative correlations, respectively. The line color indicates the significance level, with the dark blue, light blue, and gray lines representing P<0.001, P<0.050, and P≥0.050 levels, respectively. Each square in the matrix represents the Spearman's correlation coefficient (Spearman's r) between two environmental factors, with the color indicating the strength and direction of the correlation. Significance levels in the correlation matrix are indicated as follows: *** for P<0.001 level, ** for P<0.010 level, and * for P<0.050 level.
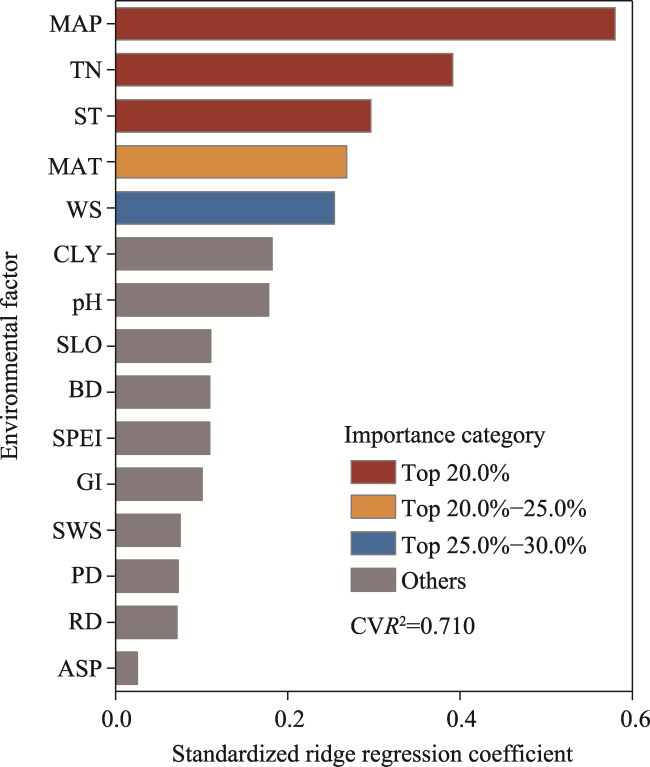
Fig. 4Standardized ridge regression coefficients for environmental factors of AMP. CVR2, cross-validated coefficient of determination.
Fig. 5Relationships of AMP with MAP (a), MAT (b), TN (c), WS (d), and ST (e). The blue and green points represent observations before and after the statistical breakpoint, respectively. The blue and green text shows the fitted equations, R2 values, and P values for the relationships between AMP and environmental factors on either side of the statistical breakpoint. The solid line represents the fitted relationship between AMP and environmental factor. The shaded area indicates the 95.0% confidence interval (CI) of the fitted relationship, and the hatched region indicates the 95.0% CI of the statistical breakpoint.
Fig. 6Pathways of factors affecting AMP (a) and standardized effects of factors from the partial least squares path model (b). The blue and red arrows indicate negative and positive relationships, respectively; the dashed arrows indicate nonsignificant relationships; the standardized coefficients of the paths indicate the strength of the path relationship. The values above the lines indicate path coefficients, with positive values representing positive effects and negative values indicating negative effects. R2 indicates the proportion of variation in the variable explained by the model. **, P<0.010 level; *, P<0.050 level.
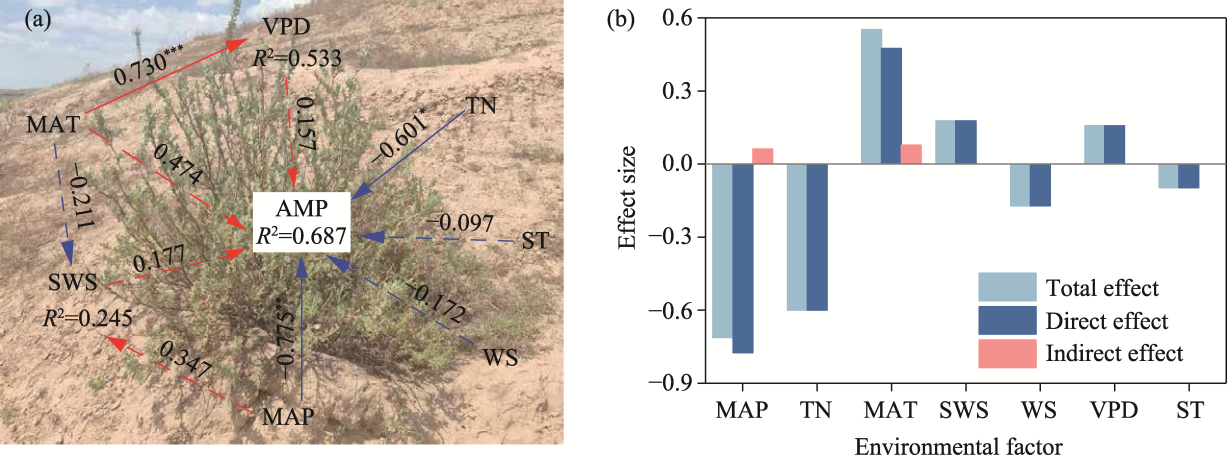
Fig. S1Alternative partial least squares path model including vapor pressure deficit (VPD) as a potential mediator of the effect of mean annual temperature (MAT) on annual mortality probability (AMP; a) and standardized effects of environmental factors from the partial least squares path model (b). MAP, mean annual precipitation; TN, total nitrogen; SWS, soil water storage; WS, wind speed; ST, soil thickness. The blue and red arrows indicate negative and positive relationships, respectively; the dashed arrows indicate nonsignificant relationships; the standardized coefficients of the paths indicate the strength of the path relationship. The values above the lines indicate path coefficients, with positive values representing positive effects and negative values indicating negative effects. R2 indicates the proportion of variation in the variable explained by the model. ***, P<0.001 level; **, P<0.010 level; *, P<0.050 level.
[1]
Adams H D, Collins A D, Briggs S P, et al. 2015. Experimental drought and heat can delay phenological development and reduce foliar and shoot growth in semiarid trees. Global Change Biology, 21(11): 4210-4220.
doi: 10.1111/gcb.13030
pmid: 26149972
[2]
Aguirre N M, Ochoa M E, Holmlund H I, et al. 2024. How megadrought causes extensive mortality in a deep-rooted shrub species normally resistant to drought-induced dieback: The role of a biotic mortality agent. Plant, Cell & Environment, 47(4): 1053-1069.
doi: 10.1111/pce.v47.4
[3]
Allen C D, Macalady A K, Chenchouni H, et al. 2010. A global overview of drought and heat-induced tree mortality reveals emerging climate change risks for forests. Forest Ecology and Management, 259(4): 660-684.
doi: 10.1016/j.foreco.2009.09.001
[4]
Anderegg W R L, Berry J A, Field C B. 2012. Linking definitions, mechanisms, and modeling of drought-induced tree death. Trends in Plant Science, 17(12): 693-700.
doi: 10.1016/j.tplants.2012.09.006
pmid: 23099222
[5]
Anderegg W R L, Plavcová L, Anderegg L D L, et al. 2013. Drought's legacy: multiyear hydraulic deterioration underlies widespread aspen forest die-off and portends increased future risk. Global Change Biology, 19(4): 1188-1196.
doi: 10.1111/gcb.12100
pmid: 23504895
[6]
Arend M, Link R M, Patthey R, et al. 2021. Rapid hydraulic collapse as cause of drought-induced mortality in conifers. Proceedings of the National Academy of Sciences of the United States of America, 118(16): e2025251118, doi:10.1073/pnas.2025251118.
[7]
Barbeta A, Mejía-Chang M, Ogaya R, et al. 2015. The combined effects of a long-term experimental drought and an extreme drought on the use of plant-water sources in a Mediterranean forest. Global Change Biology, 21(3): 1213-1225.
doi: 10.1111/gcb.12785
pmid: 25359123
[8]
Bates D M, Watts D G. 1988. Nonlinear Regression Analysis and Its Applications. New York: John Wiley & Sons, 52-59.
[9]
Bolker B M. 2008. Ecological Models and Data in R. Princeton: Princeton University Press, 249-266.
[10]
Bréda N, Huc R, Granier A, et al. 2006. Temperate forest trees and stands under severe drought: a review of ecophysiological responses, adaptation processes and long-term consequences. Annals of Forest Science, 63(6): 625-644.
doi: 10.1051/forest:2006042
[11]
Brodribb T J, Powers J, Cochard H, et al. 2020. Hanging by a thread? Forests and drought. Science, 368(6488): 261-266.
doi: 10.1126/science.aat7631
pmid: 32299945
[12]
Cao J, Liu H Y, Zhao B, et al. 2023. Nitrogen addition enhances tree radial growth but weakens its recovery from drought impact in a temperate forest in northern China. Science of The Total Environment, 903: 166884, doi: 10.1016/j.scitotenv.2023.166884.
[13]
Che C W, Xiao S C, Ding A J, et al. 2022. The characteristics of radial growth and ecological response of Caragana korshinskii Kom. under different precipitation gradient in the western Loess Plateau, China. Frontiers in Plant Science, 13: 862529, doi: 10.3389/fpls.2022.862529.
[14]
Chen W S, Zhu Q K, Liu L L, et al. 2016. Mortality and appropriate topographical conditions of seabuckthorn plantation in semi-arid region of Loess Plateau in north Shaanxi, China. Scientia Silvae Sinicae, 52(5): 9-16. (in Chinese)
[15]
Chen Z, Liu J Y, Hou X T, et al. 2023. Detection and attribution of greening and land degradation of dryland areas in China and America. Remote Sensing, 15(10): 2688, doi: 10.3390/rs15102688.
[16]
Collett D. 2015. Modelling Survival Data in Medical Research (3rd ed.). Boca Raton: CRC Press, 171-176.
[17]
Condés S, Bielak K, Brazaitis G, et al. 2025. Influence of species interactions and climate on tree mortality in mixed stands of Pinus sylvestris, Betula spp., and Picea abies. European Journal of Forest Research, 144(4): 909-924.
doi: 10.1007/s10342-025-01760-x
[18]
Crockett J L, Westerling A L. 2018. Greater temperature and precipitation extremes intensify western U.S. droughts, wildfire severity, and Sierra Nevada tree mortality. Journal of Climate, 31(1): 341-354.
doi: 10.1175/JCLI-D-17-0254.1
[19]
Ewane E B, Mohan M, Bajaj S, et al. 2023. Climate-change-driven droughts and tree mortality: assessing the potential of UAV-derived early warning metrics. Remote Sensing, 15(10): 2627, doi: 10.3390/rs15102627.
[20]
Fettig C J, Mortenson L A, Bulaon B M, et al. 2019. Tree mortality following drought in the central and southern Sierra Nevada, California, U.S. Forest Ecology and Management, 432: 164-178.
[21]
Field J P, Law D J, Myers O B, et al. 2024. Soil amendment mitigates mortality from drought and heat waves in dryland tree juveniles. Frontiers in Forests and Global Change, 7: 1215051, doi: 10.3389/ffgc.2024.1215051.
[22]
Fox J, Weisberg S. 2019. An R Companion to Applied Regression (3rd ed.). Thousand Oaks: SAGE Publications, 391-396.
[23]
Fu B J, Wang S, Liu Y, et al. 2017. Hydrogeomorphic ecosystem responses to natural and anthropogenic changes in the Loess Plateau of China. Annual Review of Earth and Planetary Sciences, 45: 223-243.
doi: 10.1146/earth.2017.45.issue-1
[24]
Gessler A, Schaub M, McDowell N G. 2017. The role of nutrients in drought-induced tree mortality and recovery. New Phytologist, 214(2): 513-520.
doi: 10.1111/nph.14340
pmid: 27891619
[25]
Gill R M A. 1992. A review of damage by mammals in north temperate forests. 2. Small mammals. Forestry, 65(3): 281-308.
doi: 10.1093/forestry/65.3.281
[26]
Hacke U G, Sperry J S, Pittermann J. 2000. Drought experience and cavitation resistance in six shrubs from the Great Basin, Utah. Basic and Applied Ecology, 1(1): 31-41.
doi: 10.1078/1439-1791-00006
[27]
Håkanson L. 1996. A general method to define confidence limits for model predictions based on validations. Ecological Modelling, 91(1-3): 153-168.
doi: 10.1016/0304-3800(95)00187-5
[28]
Hamdiah S, Eler K, Van Damme K, et al. 2024. Overgrazing strongly impedes the natural regeneration of the endemic Boswellia species on Socotra Island. Journal of Forest Science, 70(5): 249-263.
doi: 10.17221/3/2024-JFS
[29]
Hamerlynck E P, McAuliffe J R. 2008. Soil-dependent canopy die-back and plant mortality in two Mojave Desert shrubs. Journal of Arid Environments, 72(10): 1793-1802.
doi: 10.1016/j.jaridenv.2008.05.002
[30]
Hammond W M, Williams A P, Abatzoglou J T, et al. 2022. Global field observations of tree die-off reveal hotter-drought fingerprint for Earth's forests. Nature Communications, 13(1): 1761, doi: 10.1038/s41467-022-29289-2.
pmid: 35383157
[31]
Harrell F E Jr. 2024. Hmisc: Harrell Miscellaneous. R package version 5.1-2. [2025-09-30]. https://stat.ethz.ch/CRAN/src/contrib/Archive/Hmisc/Hmisc_5.1-2.tar.gz.
[32]
Hastie T, Tibshirani R, Friedman J. 2009. The Elements of Statistical Learning (2nd ed.). New York: Springer, 61-68.
[33]
Hoerl A E, Kennard R W. 1970. Ridge regression: biased estimation for nonorthogonal problems. Technometrics, 12(1): 55-67.
doi: 10.1080/00401706.1970.10488634
[34]
Jacobsen A L, Esler K J, Pratt R B, et al. 2009. Water stress tolerance of shrubs in Mediterranean-type climate regions: convergence of fynbos and succulent karoo communities with California shrub communities. American Journal of Botany, 96(8): 1445-1453.
doi: 10.3732/ajb.0800424
pmid: 21628291
[35]
Jacobsen A L, Pratt R B. 2018. Extensive drought-associated plant mortality as an agent of type-conversion in chaparral shrublands. New Phytologist, 219(2): 498-504.
doi: 10.1111/nph.15186
pmid: 29727471
[36]
Jia X X, Shao M A, Zhu Y J, et al. 2017. Soil moisture decline due to afforestation across the Loess Plateau, China. Journal of Hydrology, 546: 113-122.
doi: 10.1016/j.jhydrol.2017.01.011
[37]
Jin X J, Xu H, Wang B, et al. 2022. Dynamic model for Caragana korshinskii shrub aboveground biomass based on theoretical and allometric growth equations. Forests, 13(9): 1444, doi: 10.3390/f13091444.
[38]
Kennedy P E. 1992. A Guide to Econometrics (3rd ed.). Cambridge: MIT Press, 180-181.
[39]
Kimura R, Takayama N. 2014. Climate of the Loess Plateau. In: Tsunekawa A, Liu G, Yamanaka N, et al. Restoration and Development of the Degraded Loess Plateau, China. Tokyo: Springer Japan, 23-33.
[40]
Li S J, Xiong L Y, Li Y, et al. 2024. A multilevel dataset of landform mapping and geomorphologic descriptors for the Loess Plateau of China. Scientific Data, 11: 1282, doi: 10.1038/s41597-024-04027-z.
pmid: 39587138
[41]
Liang X Y, Wang D F, Ye Q, et al. 2023. Stomatal responses of terrestrial plants to global change. Nature Communications, 14(1): 2188, doi: 10.1038/s41467-023-37934-7.
pmid: 37069185
[42]
Liu X T, Cai L, Li M Y, et al. 2024a. Why does afforestation policy lead to a drying trend in soil moisture on the Loess Plateau? Science of The Total Environment, 953: 175912, doi: 10.1016/j.scitotenv.2024.175912.
[43]
Liu Y H, Zha Y Y, Ran G L, et al. 2024b. SMRFR: global multi layer soil moisture dataset (2000-2023). National Tibetan Plateau/Third Pole Environment Data Center, doi: 10.11888/Terre.tpdc.301526. (in Chinese)
[44]
Liu Y X, Zhao W W, Wang L X, et al. 2016. Spatial variations of soil moisture under Caragana korshinskii Kom. from different precipitation zones: field based analysis in the Loess Plateau, China. Forests, 7(2): 31, doi: 10.3390/f7020031.
[45]
Lu X Y, Liu X D, Ma R, et al. 2023. Response of Picea crassifolia forest regeneration characteristics to topographic factors in Pailugou watershed of Qilian Mountains. Arid Land Geography, 46(4): 604-613. (in Chinese)
[46]
Maestre F T. 2006. Linking the spatial patterns of organisms and abiotic factors to ecosystem function and management: insights from semi-arid environments. Web Ecology, 6(1): 75-87.
doi: 10.5194/we-6-75-2006
[47]
Maestre F T, Eldridge D J, Soliveres S, et al. 2016. Structure and functioning of dryland ecosystems in a changing world. Annual Review of Ecology, Evolution, and Systematics, 47: 215-237.
doi: 10.1146/annurev-ecolsys-121415-032311
pmid: 28239303
[48]
Malo A F, Godsall B, Prebble C, et al. 2013. Positive effects of an invasive shrub on aggregation and abundance of a native small rodent. Behavioral Ecology, 24(3): 759-767.
doi: 10.1093/beheco/ars202
[49]
Marsberg A, Kemler M, Jami F, et al. 2017. Botryosphaeria dothidea: A latent pathogen of global importance to woody plant health. Molecular Plant Pathology, 18(4): 477-488.
doi: 10.1111/mpp.12495
pmid: 27682468
[50]
Maturano-Ruiz A, Ruiz-Yanetti S, Manrique-Alba À, et al. 2023. The main factors that drive plant dieback under extreme drought differ among Mediterranean shrubland plant biotypes. Journal of Vegetation Science, 34(2): e13187, doi: 10.1111/jvs.13187.
[51]
McDowell N G, Pockman W T, Allen C D, et al. 2008. Mechanisms of plant survival and mortality during drought: why do some plants survive while others succumb to drought? New Phytologist, 178(4): 719-739.
doi: 10.1111/j.1469-8137.2008.02436.x
pmid: 18422905
[52]
McDowell N G. 2011. Mechanisms linking drought, hydraulics, carbon metabolism, and vegetation mortality. Plant Physiology, 155(3): 1051-1059.
doi: 10.1104/pp.110.170704
pmid: 21239620
[53]
McDowell N G, Allen C D, Anderson-Teixeira K, et al. 2020. Pervasive shifts in forest dynamics in a changing world. Science, 368(6494): eaaz9463, doi: 10.1126/science.aaz9463.
[54]
McDowell N G, Sapes G, Pivovaroff A, et al. 2022. Mechanisms of woody-plant mortality under rising drought, CO2 and vapour pressure deficit. Nature Reviews Earth & Environment, 3: 294-308.
[55]
Mendham D S, White D A, Battaglia M, et al. 2011. Soil water depletion and replenishment during first- and early second-rotation Eucalyptus globulus plantations with deep soil profiles. Agricultural and Forest Meteorology, 151(12): 1568-1579.
doi: 10.1016/j.agrformet.2011.06.014
[56]
Nolan R H, Gauthey A, Losso A, et al. 2021. Hydraulic failure and tree size linked with canopy die-back in Eucalypt forest during extreme drought. New Phytologist, 230(4): 1354-1365.
doi: 10.1111/nph.v230.4
[57]
Peng S Z. 2019. 1-km monthly mean temperature dataset for China (1901-2025). National Tibetan Plateau/Third Pole Environment Data Center, doi: 10.11888/Meteoro.tpdc.270961. (in Chinese)
[58]
Peng S Z. 2020. 1-km monthly precipitation dataset for China (1901-2025). National Tibetan Plateau/Third Pole Environment Data Center, doi: 10.5281/zenodo.3114194. (in Chinese)
[59]
Polgar C A, Primack R B. 2011. Leaf-out phenology of temperate woody plants: From trees to ecosystems. New Phytologist, 191(4): 926-941.
doi: 10.1111/j.1469-8137.2011.03803.x
pmid: 21762163
[60]
Ravi S, Breshears D D, Huxman T E, et al. 2010. Land degradation in drylands: interactions among hydrologic-aeolian erosion and vegetation dynamics. Geomorphology, 116(3-4): 236-245.
doi: 10.1016/j.geomorph.2009.11.023
[61]
Reynolds J F, Smith D M S, Lambin E F, et al. 2007. Global desertification: building a science for dryland development. Science, 316(5826): 847-851.
doi: 10.1126/science.1131634
pmid: 17495163
[62]
Roby M C, Scott R L, Moore D J P. 2020. High vapor pressure deficit decreases the productivity and water use efficiency of rain-induced pulses in semiarid ecosystems. Journal of Geophysical Research: Biogeosciences, 125(10): e2020JG005665, doi: 10.1029/2020JG005665.
[63]
Roy R, Mostofa M G, Wang J X, et al. 2021. Revegetation intervention of drought-prone coal-mined spoils using Caragana korshinskii under variable water and nitrogen-phosphorus resources. Agricultural Water Management, 246: 106712, doi: 10.1016/j.agwat.2020.106712.
[64]
Saiki S T, Ishida A, Yoshimura K, et al. 2017. Physiological mechanisms of drought-induced tree die-off in relation to carbon, hydraulic and respiratory stress in a drought-tolerant woody plant. Scientific Reports, 7: 2995, doi: 10.1038/s41598-017-03162-5.
[65]
Saltelli A, Ratto M, Andres T, et al. 2007. Sensitivity analysis:from theory to practice. In: Global Sensitivity Analysis:The Primer. Chichester: John Wiley & Sons, 237-275.
[66]
Sanchez G, Trinchera L, Russolillo G, et al. 2025. plspm: Partial Least Squares Path Modeling (PLS-PM). R package version 0.6.0. [2025-09-30]. https://CRAN.R-project.org/package=plspm.
[67]
Savi T, Dal Borgo A, Love V L, et al. 2016. Drought versus heat: what’s the major constraint on Mediterranean green roof plants? Science of The Total Environment, 566-567: 753-760.
doi: 10.1016/j.scitotenv.2016.05.100
[68]
Scoffoni C, Sack L. 2017. The causes and consequences of leaf hydraulic decline with dehydration. Journal of Experimental Botany, 68(16): 4479-4496.
doi: 10.1093/jxb/erx252
pmid: 28981777
[69]
Senf C, Buras A, Zang C S, et al. 2020. Excess forest mortality is consistently linked to drought across Europe. Nature Communications, 11: 6200, doi: 10.1038/s41467-020-19924-1.
pmid: 33273460
[70]
Sharp Bowman T R, McMillan B R St. Clair S B. 2017. Rodent herbivory differentially affects mortality rates of 14 native plant species with contrasting life history and growth form traits. Oecologia, 185(3): 465-473.
doi: 10.1007/s00442-017-3944-y
pmid: 28887653
[71]
Sheil D, May R M. 1996. Mortality and recruitment rate evaluations in heterogeneous tropical forests. Journal of Ecology, 84(1): 91-100.
doi: 10.2307/2261703
[72]
Shriver R K, Yackulic C B, Bell D M, et al. 2022. Dry forest decline is driven by both declining recruitment and increasing mortality in response to warm, dry conditions. Global Ecology and Biogeography, 31(11): 2259-2269.
doi: 10.1111/geb.v31.11
[73]
Swetnam T W, Betancourt J L. 1998. Mesoscale disturbance and ecological response to decadal climatic variability in the American southwest. Journal of Climate, 11(12): 3128-3147.
doi: 10.1175/1520-0442(1998)011<3128:MDAERT>2.0.CO;2
[74]
Uc-Castillo J L, Ramos-Leal J A, Martínez Cruz D A, et al. 2021. Identification of the dominant factors in groundwater recharge process, using multivariate statistical approaches in a semi-arid region. Sustainability, 13(20): 11543, doi: 10.3390/su13201154.
[75]
UNCCD. 1994. United Nations Convention to Combat Desertification in Those Countries Experiencing Serious Drought and/or Desertification, Particularly in Africa. Paris: United Nations.
[76]
Vilagrosa A, Bellot J, Vallejo V R, et al. 2003. Cavitation, stomatal conductance, and leaf dieback in seedlings of two co-occurring Mediterranean shrubs during an intense drought. Journal of Experimental Botany, 54(390): 2015-2024.
pmid: 12885857
[77]
Wang G H, Chen Z X, Shen Y Y, et al. 2023. Thinning promoted the rejuvenation and highly efficient use of soil water for degraded Caragana korshinskii plantation in semiarid loessal regions. Land Degradation & Development, 34(4): 992-1003.
doi: 10.1002/ldr.v34.4
[78]
Wang K, Zheng J Y, Li G L, et al. 2024. Caragana korshinskii of different planting years altered the soil water, carbon, and nitrogen storage in the different layers within level ditch on slope in a semi-arid area. CATENA, 242: 108126, doi: 10.1016/j.catena.2024.108126.
[79]
Wang Y Q, Yang J, Chen Y N, et al. 2018. The spatiotemporal response of soil moisture to precipitation and temperature changes in an arid region, China. Remote Sensing, 10(3): 468, doi: 10.3390/rs10030468.
[80]
Wang Y Y, Wu G L, Deng L, et al. 2017. Prediction of aboveground grassland biomass on the Loess Plateau, China, using a random forest algorithm. Scientific Reports, 7: 6940, doi: 10.1038/s41598-017-07197-6.
pmid: 28761059
[81]
Wen X, Zhen L. 2020. Soil erosion control practices in the Chinese Loess Plateau: A systematic review. Environmental Development, 34: 100493, doi: 10.1016/j.envdev.2020.100493.
[82]
Xia H M, Sha Y T, Zhao X Y, et al. 2024. HSPEI: A 1-km spatial resolution SPEI dataset across the Chinese mainland from 2001 to 2022. Geoscience Data Journal, 11(4): 479-494.
[83]
Xu H E, Zhang R P, Guo J, et al. 2024. Response mechanism of rodent burrow density to natural environmental factors in desert areas based on multisource data. CATENA, 242: 108091, doi: 10.1016/j.catena.2024.108091.
[84]
Yang J, Li X W, Yang J L, et al. 2024. Coupling of leaf economic and hydraulic strategy spectra facilitates desert restoration: a 70-year chronosequence study of Korshinks peashrub (Caragana korshinskii). Global Ecology and Conservation, 56: e03291, doi: 10.1016/j.gecco.2024.e03291.
[85]
Yuan C, Gao G Y, Fu B J. 2017. Comparisons of stemflow and its bio-/abiotic influential factors between two xerophytic shrub species. Hydrology and Earth System Sciences, 21(3): 1421-1438.
doi: 10.5194/hess-21-1421-2017
[86]
Zhang H, Luo M, Zhan W F, et al. 2024a. HiMIC-Monthly: A 1 km high-resolution atmospheric moisture index collection over China, 2003-2020. Scientific Data, 11: 425, doi: 10.1038/s41597-024-03230-2.
[87]
Zhang J K, Yu W Y, Wang Y, et al. 2024b. Effects of climate, soil, and leaf traits on nutrient resorption efficiency and proficiency of different plant functional types across arid and semiarid regions of Northwest China. BMC Plant Biology, 24(1): 1093, doi: 10.1186/s12870-024-05794-y.
[88]
Zhang Z D, Huang M B, Yang Y N, et al. 2020. Evaluating drought-induced mortality risk for Robinia pseudoacacia plantations along the precipitation gradient on the Chinese Loess Plateau. Agricultural and Forest Meteorology, 284: 107897, doi: 10.1016/j.agrformet.2019.107897.
[89]
Zhang Z D, Liu T H, Huang M B, et al. 2024c. Spatial pattern of drought-induced mortality risk and influencing factors for Robinia pseudoacacia L. plantations on the Chinese Loess Plateau. Forests, 15(8): 1477, doi: 10.3390/f15081477.