| Research article |
|


|
|
|
| Accuracy assessment of cloud removal methods for Moderate-resolution Imaging Spectroradiometer (MODIS) snow data in the Tianshan Mountains, China |
WANG Qingxue1,2, MA Yonggang2,3,4,5,*( ), XU Zhonglin1,2,4, LI Junli6,7,8 ), XU Zhonglin1,2,4, LI Junli6,7,8 |
1College of Ecology and Environment, Xinjiang University, Urumqi 830046, China
2Xinjiang Key Laboratory of Oasis Ecology, Xinjiang University, Urumqi 830046, China
3College of Geography and Remote Sensing Sciences, Xinjiang University, Urumqi 830046, China
4Xinjiang Jinghe Observation and Research Station of Temperate Desert Ecosystem, Ministry of Education, Urumqi 830046, China
5Key Laboratory of Oasis Ecology of Education Ministry, Urumqi 830046, China
6Key Laboratory of Ecological Safety and Sustainable Development in Arid Lands, Xinjiang Institute of Ecology and Geography, Chinese Academy of Sciences, Urumqi 830011, China
7University of Chinese Academy of Sciences, Beijing 100049, China
8Key Laboratory of GIS & RS Application, Xinjiang Uygur Autonomous Region, Urumqi 830011, China |
|
|
|
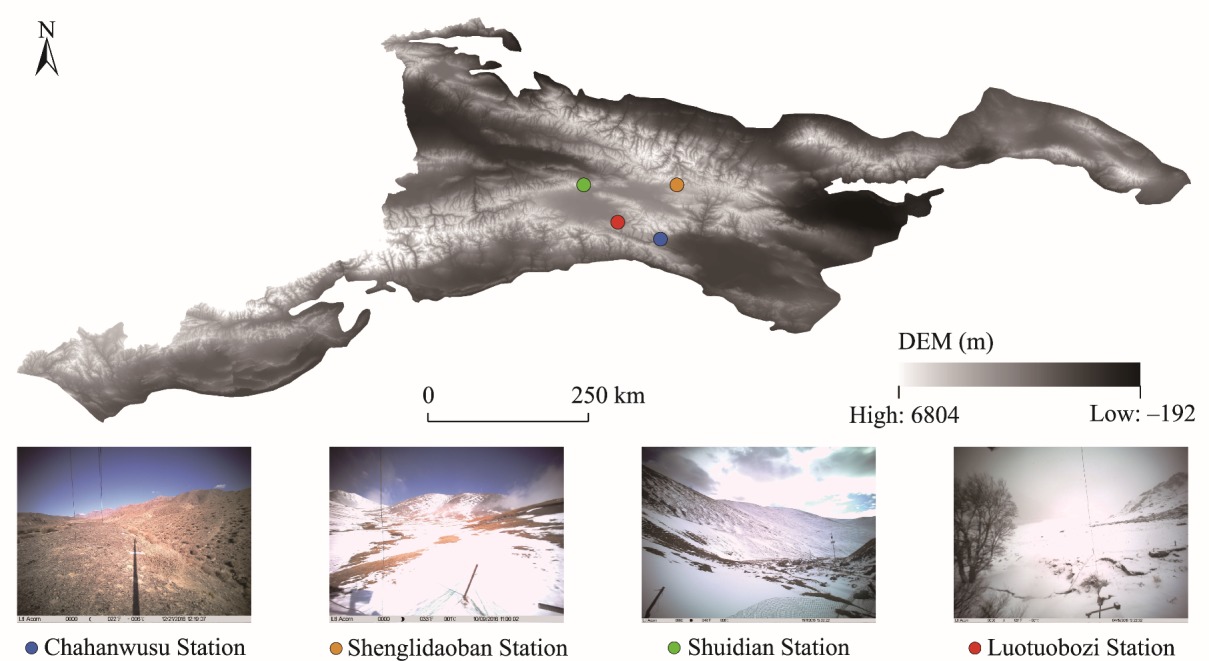
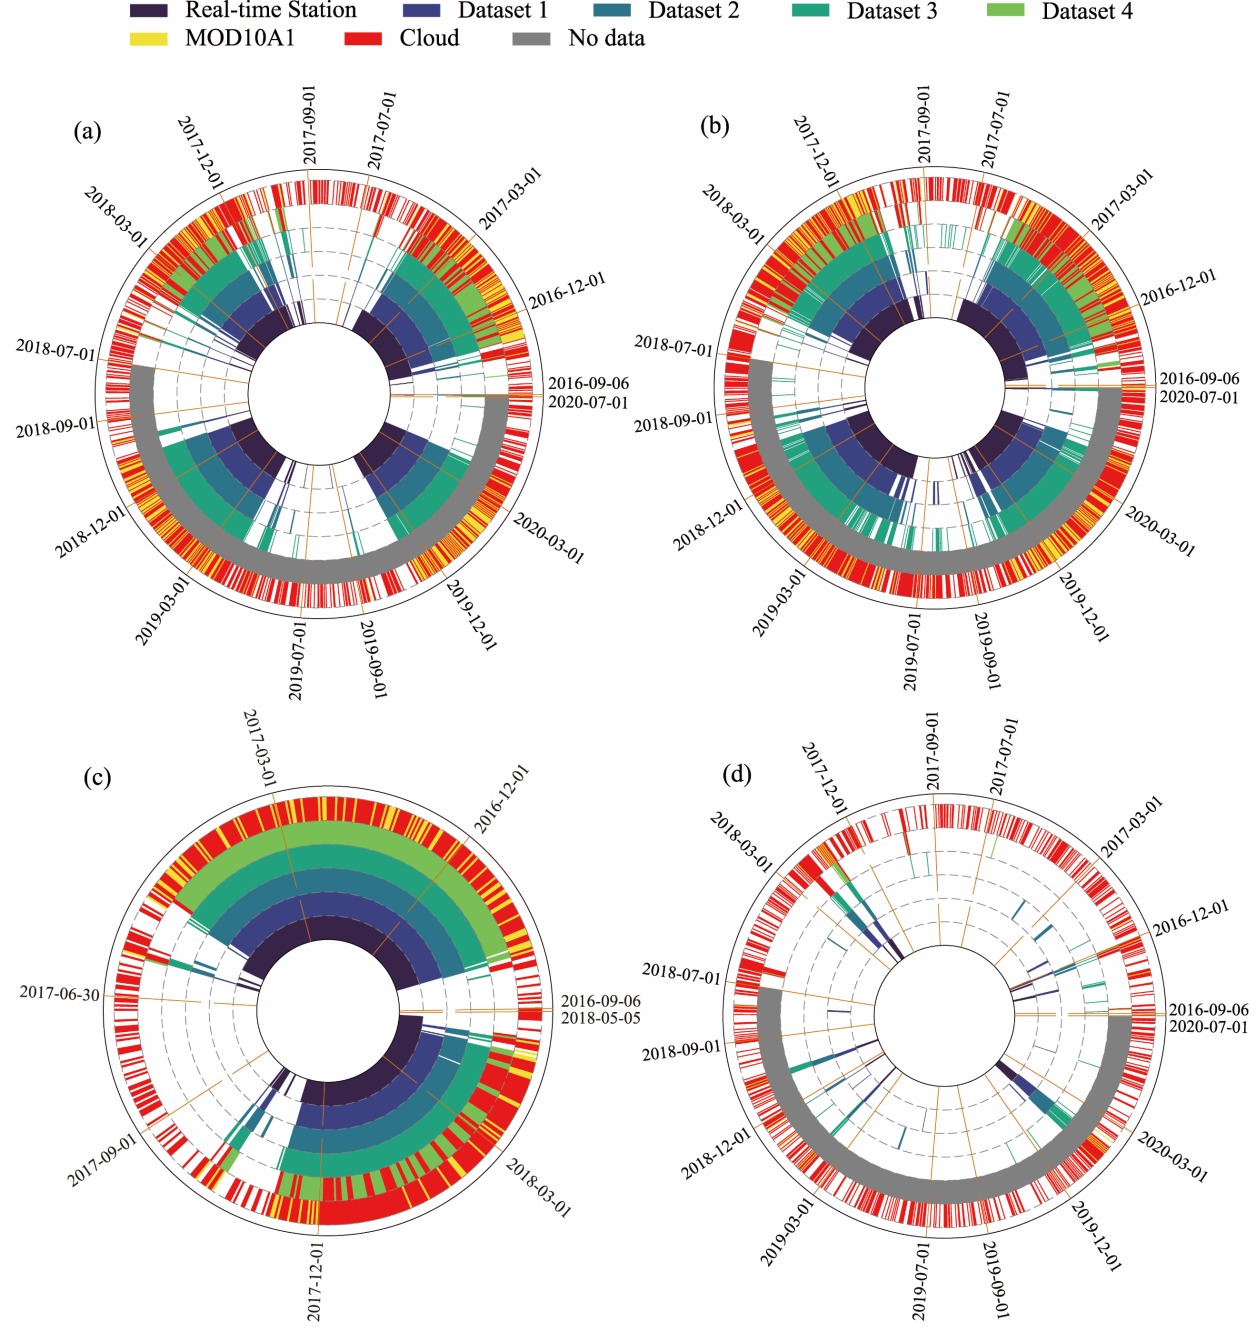
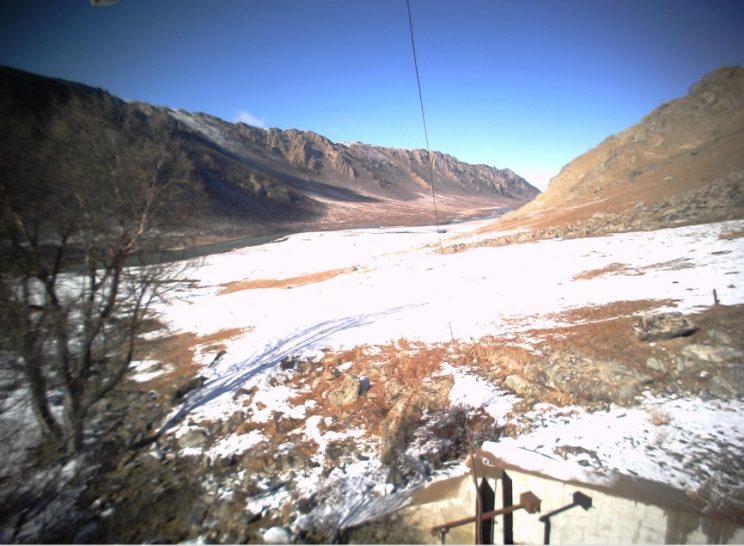
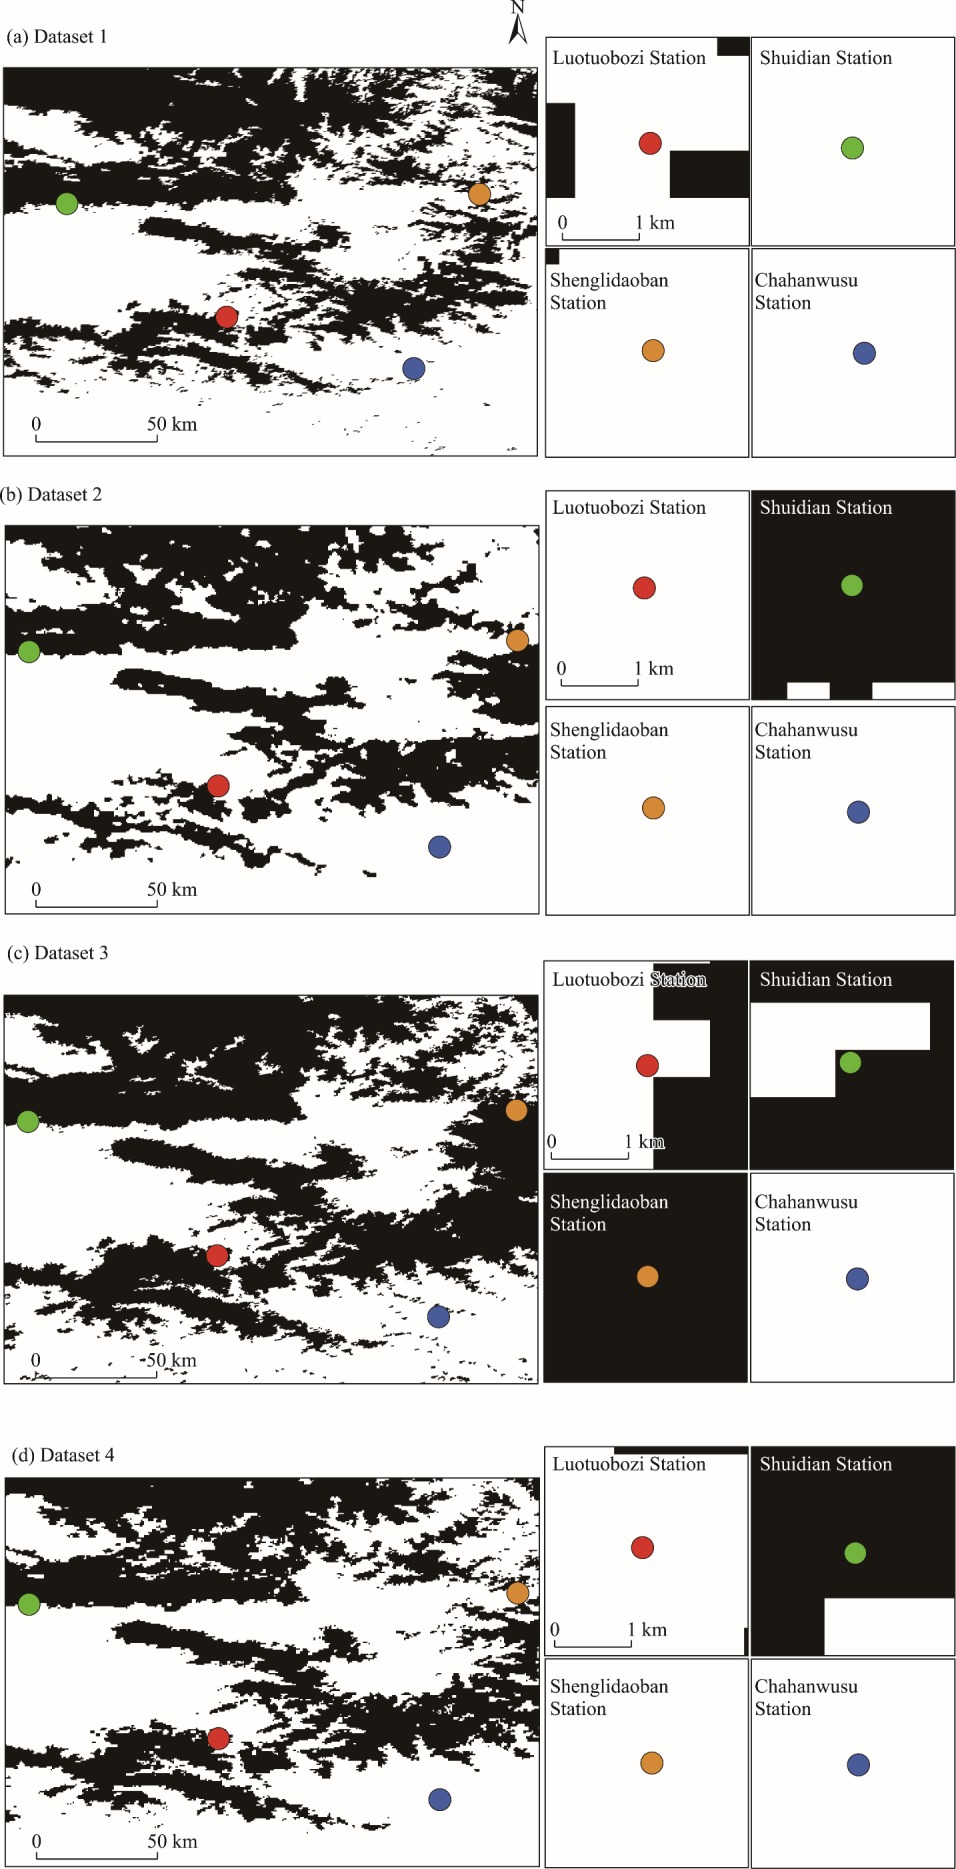
Abstract Snow cover plays a critical role in global climate regulation and hydrological processes. Accurate monitoring is essential for understanding snow distribution patterns, managing water resources, and assessing the impacts of climate change. Remote sensing has become a vital tool for snow monitoring, with the widely used Moderate-resolution Imaging Spectroradiometer (MODIS) snow products from the Terra and Aqua satellites. However, cloud cover often interferes with snow detection, making cloud removal techniques crucial for reliable snow product generation. This study evaluated the accuracy of four MODIS snow cover datasets generated through different cloud removal algorithms. Using real-time field camera observations from four stations in the Tianshan Mountains, China, this study assessed the performance of these datasets during three distinct snow periods: the snow accumulation period (September-November), snowmelt period (March-June), and stable snow period (December-February in the following year). The findings showed that cloud-free snow products generated using the Hidden Markov Random Field (HMRF) algorithm consistently outperformed the others, particularly under cloud cover, while cloud-free snow products using near-day synthesis and the spatiotemporal adaptive fusion method with error correction (STAR) demonstrated varying performance depending on terrain complexity and cloud conditions. This study highlighted the importance of considering terrain features, land cover types, and snow dynamics when selecting cloud removal methods, particularly in areas with rapid snow accumulation and melting. The results suggested that future research should focus on improving cloud removal algorithms through the integration of machine learning, multi-source data fusion, and advanced remote sensing technologies. By expanding validation efforts and refining cloud removal strategies, more accurate and reliable snow products can be developed, contributing to enhanced snow monitoring and better management of water resources in alpine and arid areas.
|
|
Received: 27 November 2024
Published: 30 April 2025
|
|
Corresponding Authors:
*MA Yonggang (E-mail: mayg@xju.edu.cn)
|
|
|
| [1] |
Bergeron J, Royer A, Turcotte R, et al. 2014. Snow cover estimation using blended MODIS and AMSR-E data for improved watershed-scale spring streamflow simulation in Quebec, Canada. Hydrological Processes, 28(16): 4626-4639.
|
|
|
| [2] |
Berman E E, Bolton D K, Coops N C, et al. 2018. Daily estimates of Landsat fractional snow cover driven by MODIS and dynamic time-warping. Remote Sensing of Environment, 216: 635-646.
|
|
|
| [3] |
Breen C, Vuyovich C, Odden J, et al. 2023. Evaluating MODIS snow products using an extensive wildlife camera network. Remote Sensing of Environment, 295: 113648, doi: 10.1016/j.rse.2023.113648.
|
|
|
| [4] |
Burgos V L, Gupta H V, Clark M. 2013. Reducing cloud obscuration of MODIS snow cover area products by combining spatio-temporal techniques with a probability of snow approach. Hydrology and Earth System Sciences, 17(5): 1809-1823.
|
|
|
| [5] |
Chen K, Cao X G, Yang J H, et al. 2014. A method of generating national snow-cover model based on C4.5 algorithm of decision tree. Electronic Design Engineering, 22(17): 44-47. (in Chinese)
|
|
|
| [6] |
Chen S Y, Wang X Y, Guo H, et al. 2020. A conditional probability interpolation method based on a space-time cube for MODIS snow cover products gap filling. Remote Sensing, 12(21): 3577, doi: 10.3390/rs12213577.
|
|
|
| [7] |
Deng G, Tang Z G, Dong C Y, et al. 2024. Development and evaluation of a cloud-gap-filled MODIS normalized difference snow index product over High Mountain Asia. Remote Sensing, 16(1): 192, doi: 10.3390/rs16010192.
|
|
|
| [8] |
Deng J, Huang X D, Feng Q S, et al. 2015. Toward improved daily cloud-free fractional snow cover mapping with multi-source remote sensing data in China. Remote Sensing, 7(6): 6986-7006.
|
|
|
| [9] |
Dietz A J, Kuenzer C, Conrad C. 2013. Snow-cover variability in central Asia between 2000 and 2011 derived from improved MODIS daily snow-cover products. International Journal of Remote Sensing, 34(11): 3879-3902.
|
|
|
| [10] |
Dong C Y, Menzel L. 2016. Improving the accuracy of MODIS 8-day snow products with in situ temperature and precipitation data. Journal of Hydrology, 534: 466-477.
|
|
|
| [11] |
Dong C Y, Menzel L. 2017. Snow process monitoring in montane forests with time-lapse photography. Hydrological Processes, 31(16): 2872-2886.
|
|
|
| [12] |
Eastman R, Warren S G, Hahn C J. 2021. Climatic Atlas of Clouds Over Land and Ocean. Department of Atmospheric Sciences University of Washington. Seattle Washington 98195-1640. [2024-03-30]. http://www.atmos.washington.edu/CloudMap/index.html.
|
|
|
| [13] |
Gafurov A, Bárdossy A. 2009. Cloud removal methodology from MODIS snow cover product. Hydrology and Earth System Sciences, 13(7): 1361-1373.
|
|
|
| [14] |
Gao Y, Wang X T, Mou N X, et al. 2024. Evaluating MODIS cloud-free snow cover datasets using massive spatial benchmark data in the Tibetan Plateau. Science of the Total Environment, 949: 175245, doi: 10.1016/j.scitotenv.2024.175245.
|
|
|
| [15] |
Garvelmann J, Pohl S, Weiler M. 2013. From observation to the quantification of snow processes with a time-lapse camera network. Hydrology and Earth System Sciences, 17(4): 1415-1429.
|
|
|
| [17] |
Gurung R D, Kulkarni A V, Giriraj A, et al. 2011. Changes in seasonal snow cover in Hindu Kush-Himalayan Region. The Cryosphere Discussions, 5(2): 755-777.
|
|
|
| [18] |
Hall D K, Riggs G A, DiGirolamo N E, et al. 2019. Evaluation of MODIS and VIIRS cloud-gap-filled snow-cover products for production of an Earth science data record. Hydrology and Earth System Sciences, 23(12): 5227-5241.
|
|
|
| [19] |
Hall D K, Riggs G A, DiGirolamo N E, et al. 2024. Comparison of the NASA standard moderate-resolution imaging spectroradiometer and visible infrared imaging radiometer suite snow-cover products for creation of a climate data record: A case study in the Great Basin of the Western United States. Remote Sensing, 16(16): 3029, doi: 10.3390/rs16163029.
|
|
|
| [20] |
Hao X H, Huang G H, Zheng Z J, et al. 2022. Development and validation of a new MODIS snow-cover-extent product over China. Hydrology and Earth System Sciences, 26(8): 1937-1952.
|
|
|
| [21] |
Haq M A, Ahmed A, Ilyas K, et al. 2022. Analysis of environmental factors using AI and ML methods. Scientific Reports, 12(1): 13267, doi: 10.1038/s41598-022-16665-7.
pmid: 35918395
|
|
|
| [22] |
Hou J L, Huang C L, Zhang Y, et al. 2022. Reconstructing a gap-free MODIS normalized difference snow index product using a long short-term memory network. IEEE Transactions on Geoscience and Remote Sensing, 60: 4304914, doi: 10.1109/TGRS.2022.3178421.
|
|
|
| [23] |
Hu R J. 2004. Physical Geography of Tianshan Mountains in China. Beijing: China Environmental Science Press, 39-57. (in Chinese)
|
|
|
| [24] |
Huang X D, Hao X H, Wang W, et al. 2012. Algorithms for cloud removal in MODIS daily snow products. Journal of Glaciology and Geocryology, 34(5): 1118-1126. (in Chinese)
|
|
|
| [25] |
Huang Y, Xu J H, Xu J Y, et al. 2022. HMRFS-TP: long-term daily gap-free snow cover products over the Tibetan Plateau from 2002 to 2021 based on hidden Markov random field model. Earth System Science Data Discussions, 14(9): 4445-4462.
|
|
|
| [26] |
Ide R, Oguma H. 2013. A cost-effective monitoring method using digital time-lapse cameras for detecting temporal and spatial variations of snowmelt and vegetation phenology in alpine ecosystems. Ecological Informatics, 16: 25-34.
|
|
|
| [27] |
Jing Y H, Li X H, Shen H F. 2022. STAR NDSI collection: a cloud-free MODIS NDSI dataset (2001-2020) for China. Earth System Science Data, 14(7): 3137-3156.
|
|
|
| [28] |
Li X H, Jing Y H, Shen H F, et al. 2019. The recent developments in cloud removal approaches of MODIS snow cover product. Hydrology and Earth System Sciences, 23(5): 2401-2416.
|
|
|
| [29] |
Li Y P, Chen Y N, Li Z. 2020. Climate and topographic controls on snow phenology dynamics in the Tienshan Mountains, Central Asia. Atmospheric Research, 236: 104813, doi: 10.1016/j.atmosres.2019.104813.
|
|
|
| [30] |
Liang T G, Zhang X T, Xie H J, et al. 2008. Toward improved daily snow cover mapping with advanced combination of MODIS and AMSR-E measurements. Remote Sensing of Environment, 112(10): 3750-3761.
|
|
|
| [31] |
Liu C Y, Huang X D, Li X B, et al. 2020. MODIS fractional snow cover mapping using machine learning technology in a mountainous area. Remote Sensing, 12(6): 962, doi: 10.3390/rs12060962.
|
|
|
| [32] |
Liu J P, Zang W C, Liu T. 2017. Monitoring recent changes in snow cover in Central Asia using improved MODIS snow-cover products. Journal of Arid Land, 9(5): 763-777.
doi: 10.1007/s40333-017-0103-6
|
|
|
| [33] |
Luo J F, Dong C Y, Lin K R, et al. 2022. Mapping snow cover in forests using optical remote sensing, machine learning and time-lapse photography. Remote Sensing of Environment, 275: 113017, doi: 10.1016/j.rse.2022.113017.
|
|
|
| [34] |
NCDC (National Cryosphere Desert Data Center). 2021 Daily fractional snow cover dataset over High Asia during 2002 to 2018. [2024-11-03]. https://cstr.cn/CSTR:11738.11.ncdc.nieer.2020.1660.
|
|
|
| [35] |
Painter T H, Brodzik M J, Racoviteanu A, et al. 2012. Automated mapping of Earth's annual minimum exposed snow and ice with MODIS. Geophysical Research Letters, 39(20): L20501, doi: 10.1029/2012GL053340.
|
|
|
| [36] |
Pan F B, Jiang L M, Wang G X, et al. 2024. MODIS daily cloud-gap-filled fractional snow cover dataset of the Asian water tower region (2000-2022). Earth System Science Data, 16(5): 2501-2523.
|
|
|
| [37] |
Parajka J, Blöschl G. 2008. Spatio-temporal combination of MODIS images - potential for snow cover mapping. Water Resources Research, 44(3): W03406, doi: 10.1029/2007WR006204.
|
|
|
| [38] |
Parajka J, Pepe M, Rampini A, et al. 2010. A regional snow-line method for estimating snow cover from MODIS during cloud cover. Journal of Hydrology, 381(3-4): 203-212.
|
|
|
| [39] |
Parajka J, Haas P, Kirnbauer R, et al. 2012. Potential of time-lapse photography of snow for hydrological purposes at the small catchment scale. Hydrological Processes, 26(22): 3327-3337.
|
|
|
| [40] |
Qiu Y B, Zhang H, Chu D, et al. 2017. Cloud removing algorithm for the daily cloud free MODIS-based snow cover product over the Tibetan Plateau. Journal of Glaciology and Geocryology, 39(3): 515-526. (in Chinese)
doi: 10.7522/j.issn.1000-0240.2017.0058
|
|
|
| [41] |
Qu J, Ding J L, Sun Y M. 2013. Improved SVM for extracting snow cover in northern Xinjiang. Resources Science, 35(2): 422-429. (in Chinese)
|
|
|
| [42] |
Stillinger T, Rittger K, Raleigh M S, et al. 2023. Landsat, MODIS, and VIIRS snow cover mapping algorithm performance as validated by airborne lidar datasets. The Cryosphere, 17(2): 567-590.
|
|
|
| [43] |
Tang Z G, Wang J, Li H Y, et al. 2013. Accuracy validation and cloud obscuration removal of MODIS fractional snow cover products over Tibetan Plateau. Remote Sensing Technology and Application, 28(3): 423-430. (in Chinese)
|
|
|
| [44] |
Tang Z G, Wang X R, Wang J, et al. 2017. Spatiotemporal variation of snow cover in Tianshan Mountains, Central Asia, based on cloud-free MODIS fractional snow cover product, 2001-2015. Remote Sensing, 9(10): 1045, doi: 10.3390/rs9101045.
|
|
|
| [45] |
Tang Z G, Deng G, Hu G J, et al. 2022. Satellite observed spatiotemporal variability of snow cover and snow phenology over High Mountain Asia from 2002 to 2021. Journal of Hydrology, 613: 128438, doi: 10.1016/j.jhydrol.2022.128438.
|
|
|
| [46] |
Thirel G, Salamon P, Burek P, et al. 2011. Assimilation of MODIS snow cover area data in a distributed hydrological model. Hydrology Earth System Sciences Discussions, 8(1): 1329-1364.
|
|
|
| [47] |
Tian F. 2023. Research on snow-based cloud removal based on machine learning and spatio-temporal change analysis. MSc Thesis. Nanjing: Nanjing University of Information Science & Technology, 15-18. (in Chinese)
|
|
|
| [48] |
Tong J, Déry S J, Jackson P L. 2009a. Interrelationships between MODIS/Terra remotely sensed snow cover and the hydrometeorology of the Quesnel River Basin, British Columbia, Canada. Hydrology and Earth System Sciences, 13(8): 1439-1452.
|
|
|
| [49] |
Tong J, Déry S J, Jackson P L. 2009b. Topographic control of snow distribution in an alpine watershed of western Canada inferred from spatially-filtered MODIS snow products. Hydrology and Earth System Sciences, 11(3): 319-326.
|
|
|
| [50] |
Wang Q X, Ma Y G, Li J L. 2023. Snow cover phenology in Xinjiang based on a novel method and MOD10A 1 data. Remote Sensing, 15(6): 1474, doi: 10.3390/rs15061474.
|
|
|
| [51] |
Wang X Y, Wang S Y, Yi H, et al. 2016. Snow phenology variability in the Qinghai-Tibetan Plateau and its response to climate change during 2002-2012. Journal of Geo-information Science, 18(11): 1573-1579. (in Chinese)
|
|
|
| [52] |
Wang Z Y, Che T. 2012. Spatiotemporal distribution of snow cover in arid regions in China. Arid Zone Research, 29(3): 464-471. (in Chinese)
|
|
|
| [53] |
Xia Q, Gao X G, Wei C, et al. 2012. Estimation of daily cloud-free, snow-covered areas from MODIS based on variational interpolation. Water Resources Research, 48(9): W09523, doi: 10.1029/2011WR011072.
|
|
|
| [54] |
Xin C, Sheng Y W. 2024. Enhancing glacier monitoring through adaptive smoothing of MODIS NDSI time series. Remote Sensing Letters, 15(10): 1047-1056.
|
|
|
| [55] |
Xing D, Hou J L, Huang C L, et al. 2022. Spatiotemporal reconstruction of MODIS normalized difference snow index products using U-net with partial convolutions. Remote Sensing, 14(8): 1795, doi: 10.3390/rs14081795.
|
|
|
| [56] |
Yu J Y, Zhang G Q, Yao T D, et al. 2016. Developing daily cloud-free snow composite products from MODIS Terra-Aqua and IMS for the Tibetan Plateau. IEEE Transactions on Geoscience and Remote Sensing, 54(4): 2171-2180.
|
|
|
| [57] |
Yuan Y C, Li B L, Gao X Z, et al. 2022. Validation of cloud-gap-filled snow cover of MODIS daily cloud-free snow cover products on the Qinghai-Tibetan Plateau. Remote Sensing, 14(22): 5642, doi: 10.3390/rs14225642.
|
|
|
| [58] |
Zhang H, Qiu Y B, Zheng Z J, et al. 2016. Comparative study of the feasibility of cloud removal methods based on MODIS seasonal snow cover data over the Tibetan Plateau. Journal of Glaciology and Geocryology, 38(3): 714-724. (in Chinese)
doi: 10.7522/j.issn.1000-0240.2016.0080
|
|
|
| [59] |
Zhang L H, Zhang H B, Sun X Y, et al. 2024. Combined use of multiple cloud-free snow cover products in China and its high-mountain region: implications from snow cover identification to snow phenology detection. Water Resources Research, 60(6): e2023WR036274, doi: 10.1029/2023WR036274.
|
|
|
| [60] |
Zhang X H, Qiu Z X, Peng C, et al. 2022a. Removing cloud cover interference from Sentinel-2 imagery in Google Earth Engine by fusing Sentinel-1 SAR data with a CNN model. International Journal of Remote Sensing, 43(1): 132-147.
|
|
|
| [61] |
Zhang Y, Gulimire H, Sulitan D, et al. 2022b. Monitoring and analysis of snow cover change in an alpine mountainous area in the Tianshan Mountains, China. Journal of Arid Land, 14(9): 962-977.
|
|
|
|
Viewed |
|
|
|
Full text
|
|
|
|
|
Abstract
|
|
|
|
|
Cited |
|
|
|
|
| |
Shared |
|
|
|
|
| |
Discussed |
|
|
|
|