| Research article |
|


|
|
|
| Spatiotemporal variations and driving mechanisms of flash droughts during 1981-2020 in the Qilian Mountains, China |
BAI Junhong1,2, WANG Jianglin1,*( ), CHEN Jie3, WANG Xuejia3 ), CHEN Jie3, WANG Xuejia3 |
1Key Laboratory of Ecological Safety and Sustainable Development in Arid Lands, Northwest Institute of Eco-Environment and Resources, Chinese Academy of Sciences, Lanzhou 730000, China
2University of Chinese Academy of Sciences, Beijing 100049, China
3Key Laboratory of Western China's Environmental Systems (Ministry of Education), College of Earth and Environmental Sciences, Lanzhou University, Lanzhou 730000, China |
|
|
|
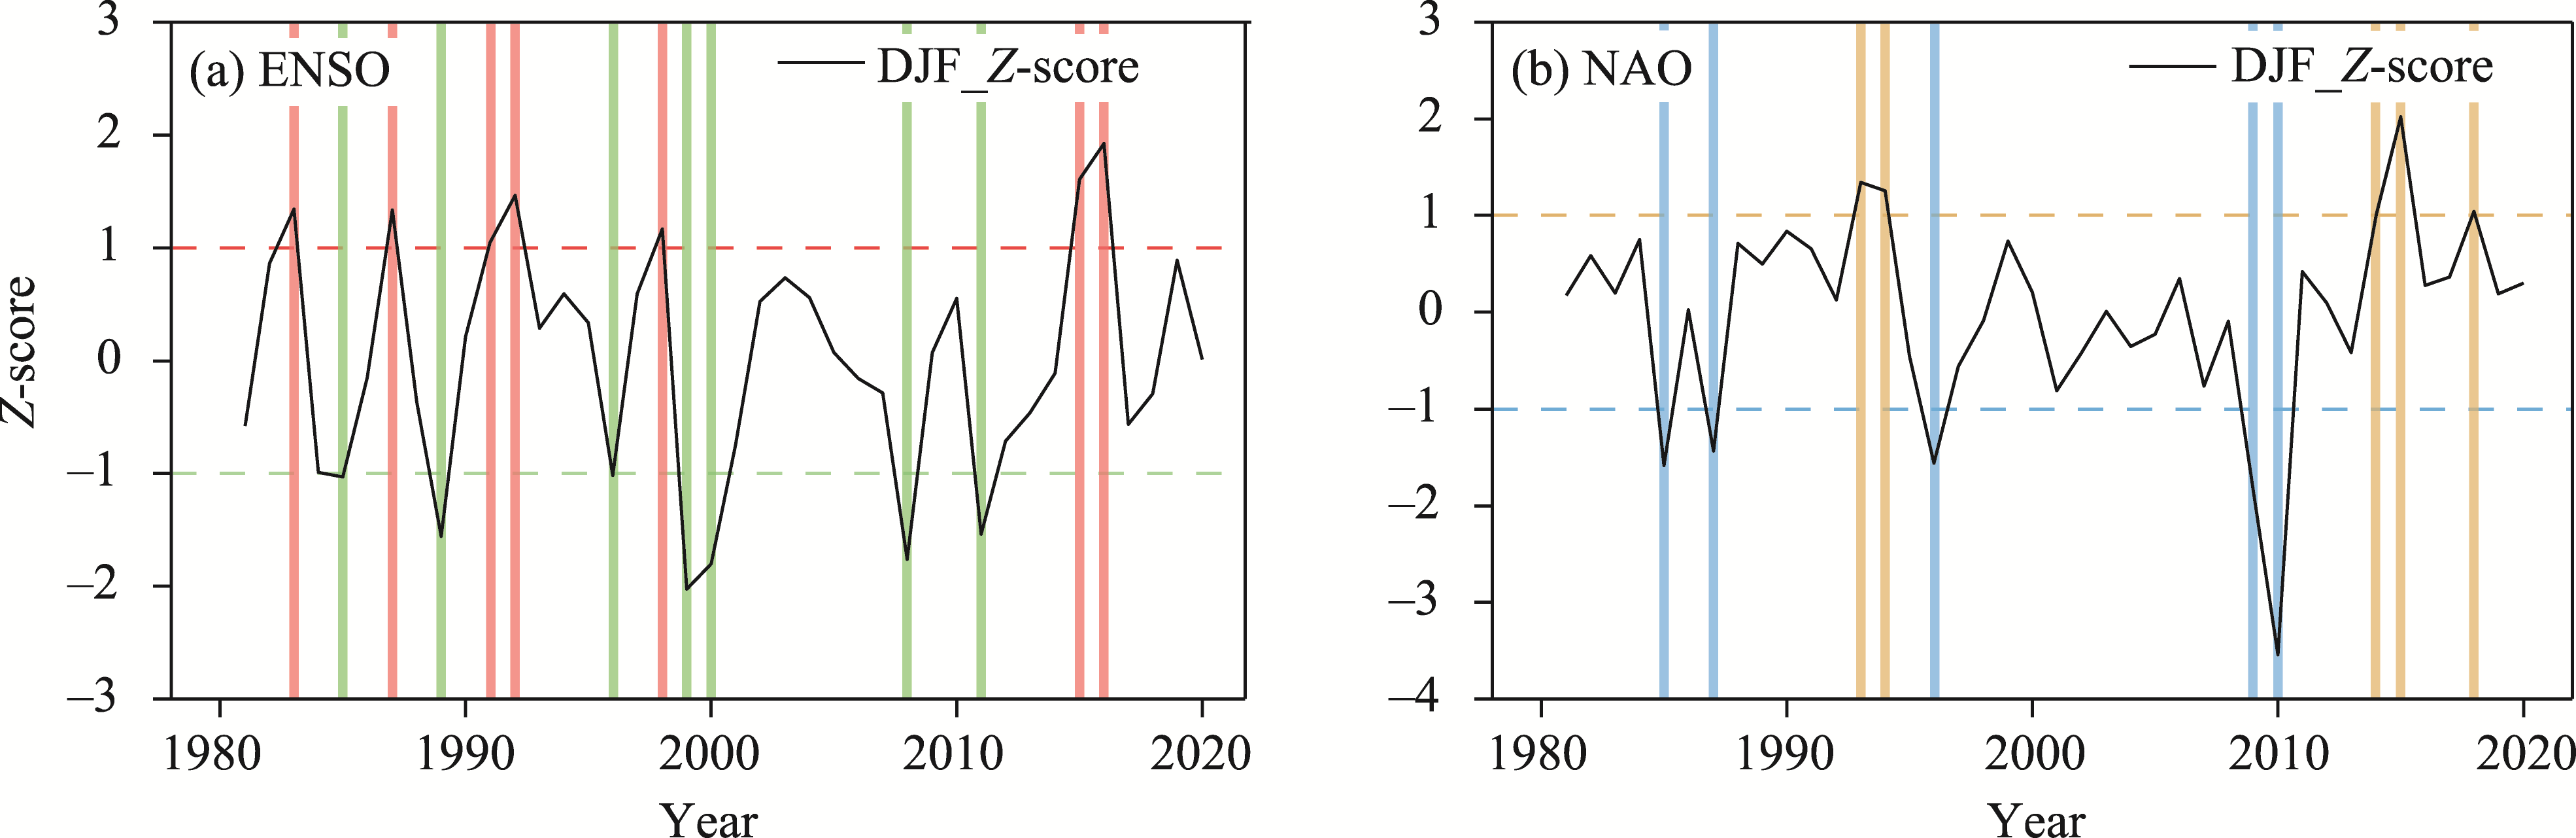
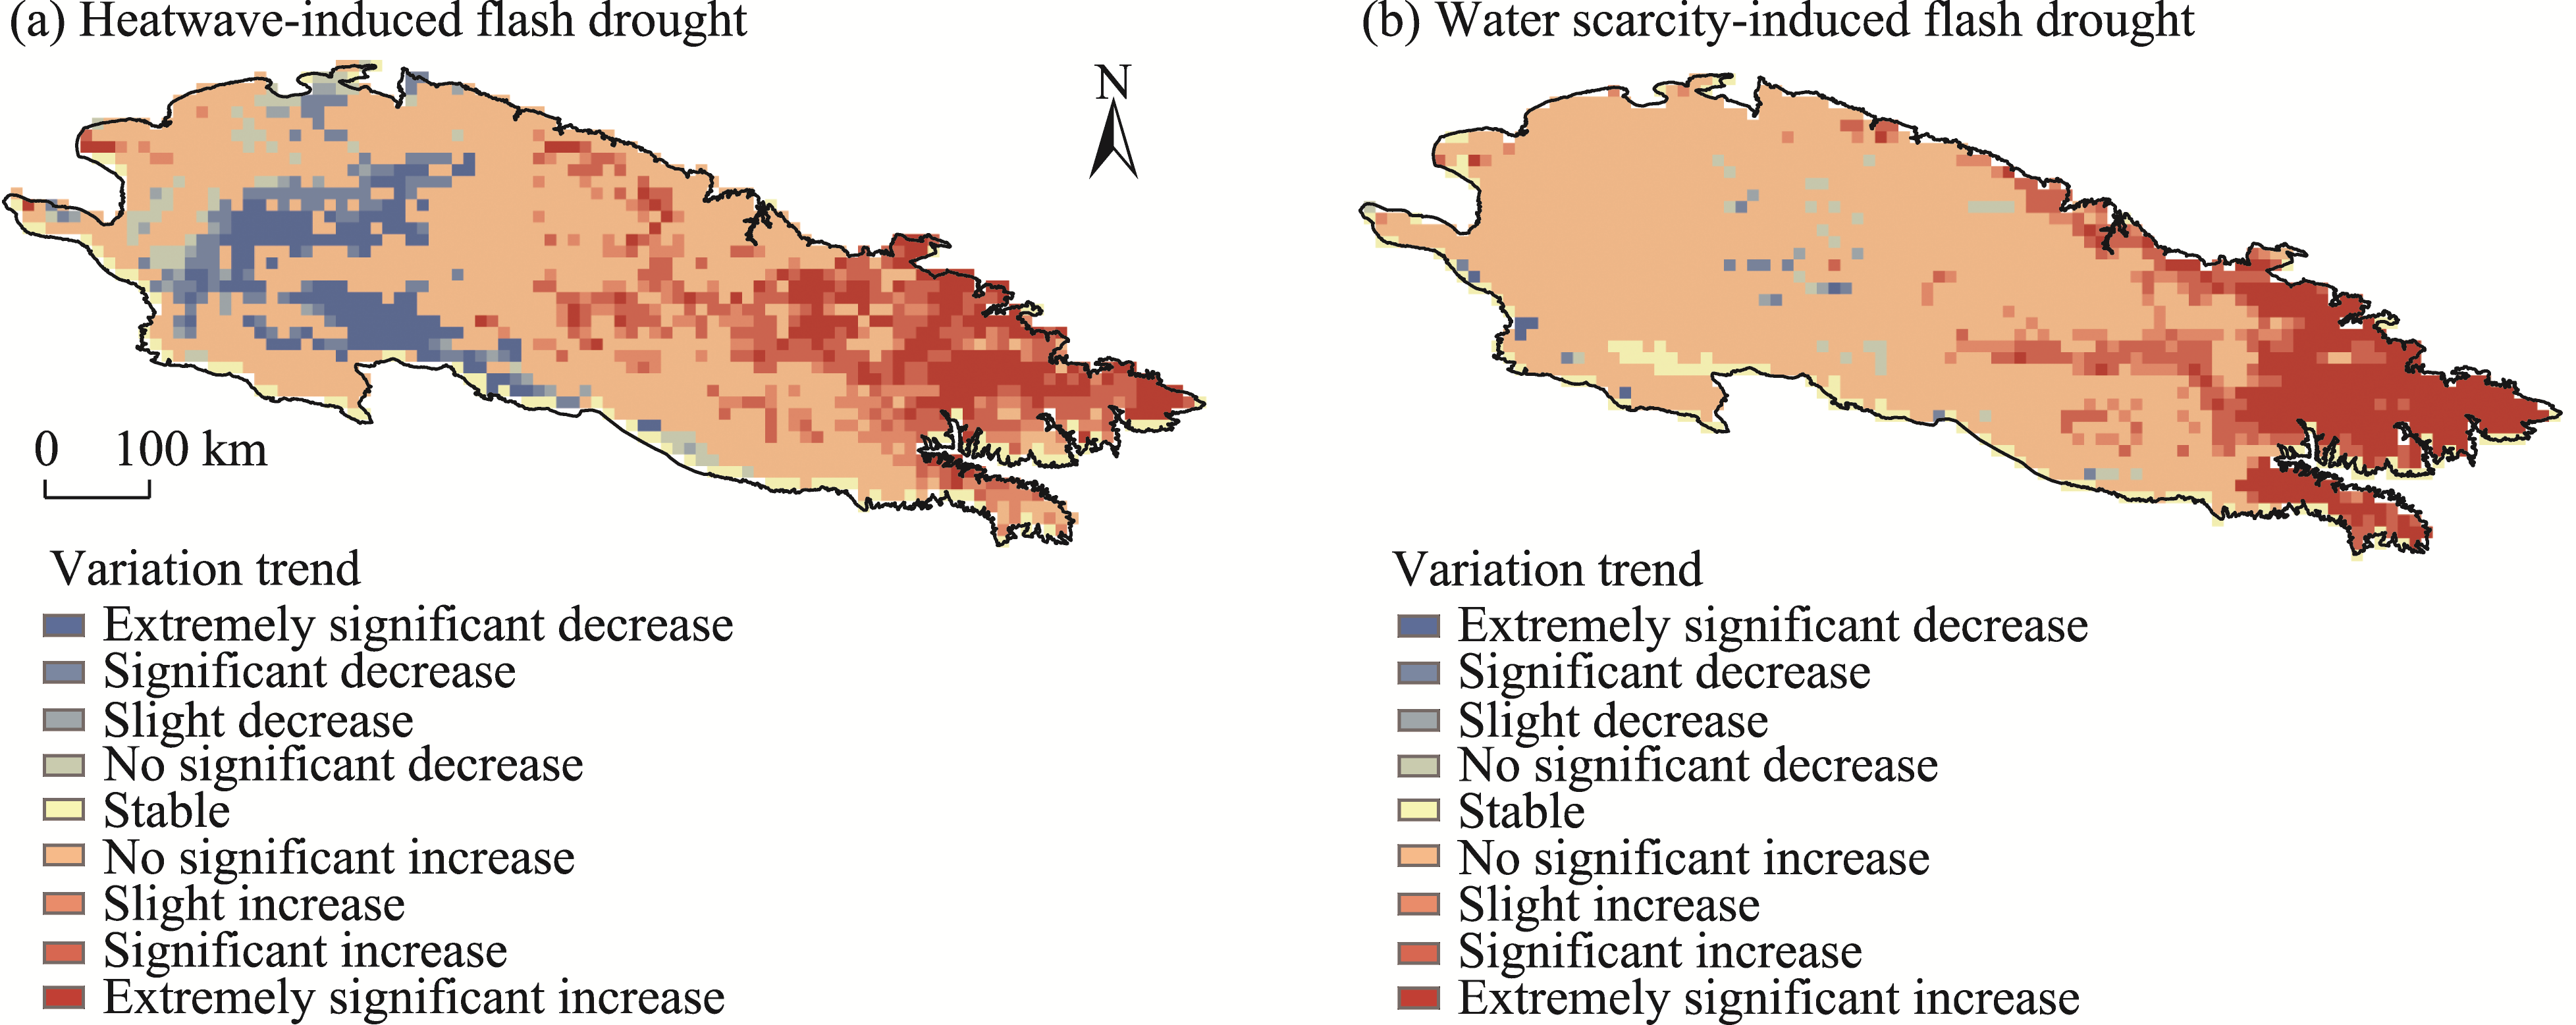
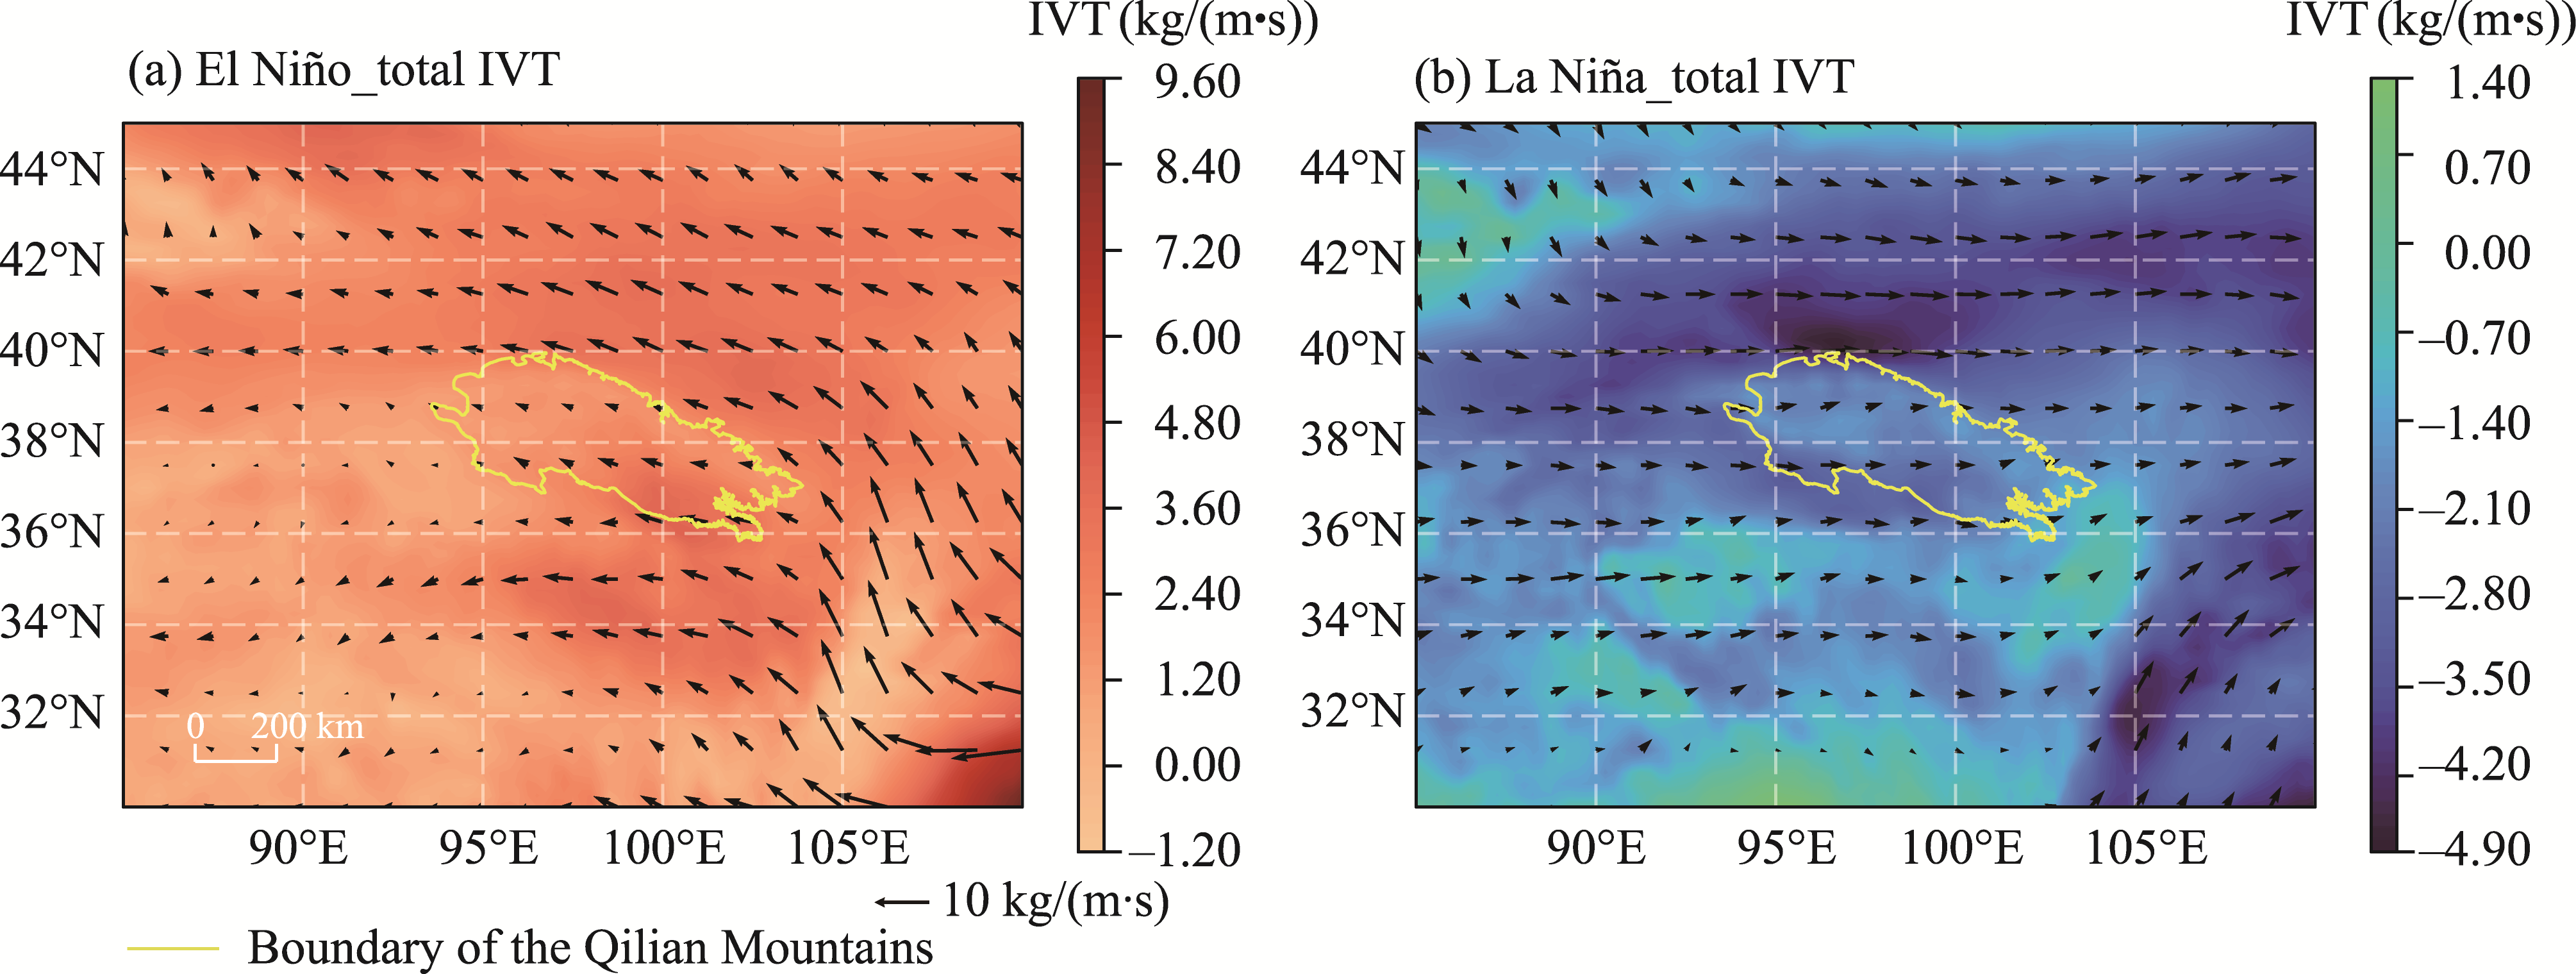
Abstract Flash drought is characterized by a period of rapid drought intensification with impacts on agriculture, water resources, ecosystems, and human environment. In the Qilian Mountains, northwestern China, flash droughts are becoming more frequently due to the global climate warming. However, the spatiotemporal variations and their driving factors of flash droughts are not clear in this region. In this study, the European Centre for Medium-range Weather Forecasts (ECMWF) Reanalysis v5-Land (ERA5-Land) dataset was utilized to identify two types of flash drought events (heatwave-induced and water scarcity-induced flash drought events) that occurred in the growing season (April‒September) during 1981-2020 in this area. The results showed that the frequency of heatwave-induced flash droughts has decreased since 2010, while the frequency of water scarcity-induced flash droughts has declined markedly. Spatially, heatwave-induced flash droughts were predominantly concentrated in the western Qilian Mountains, whereas water scarcity-induced flash droughts were primarily concentrated in the central and eastern Qilian Mountains. A significantly increasing temporal trend in both types of flash droughts in the eastern Qilian Mountains was found. Meanwhile, there was a decreasing temporal trend of heatwave-induced flash droughts in the southwestern part of the region. Additionally, the influence of two major atmospheric modes, i.e., the El Niño‒Southern Oscillation (ENSO) and North Atlantic Oscillation (NAO), on these two types of flash droughts was explored by the Superposed Epoch Analysis. The ENSO mainly influences flash droughts in the central and eastern parts of the Qilian Mountains by altering the strength of the East Asian monsoon, while the NAO mainly affects flash droughts in the entire parts of the Qilian Mountains by inducing anomalous westerlies activity. Our findings have important implications for predicting the evolution of flash drought events in the Qilian Mountains region under continued climate warming.
|
|
Received: 09 December 2024
Published: 30 April 2025
|
|
Corresponding Authors:
*WANG Jianglin (E-mail: wangjianglin2011@lzb.ac.cn)
|
|
|
| [1] |
Adib A, Soleimani M, Ashrafi S M, et al. 2024. Monitoring annual meteorological drought in arid and semi-arid watersheds by SPI 12 drought index and spatial autocorrelation pattern analysis: A case study of the Khuzestan Province, Southwest Iran. Sustainable Water Resources Management, 10(5): 160-186.
|
|
|
| [2] |
Alizadeh M R, Adamowski J, Nikoo M R, et al. 2020. A century of observations reveals increasing likelihood of continental-scale compound dry-hot extremes. Science Advances, 6(39): eaaz4571, doi: 10.1126/sciadv.aaz4571.
|
|
|
| [3] |
Ayugi B, Eresanya E O, Onyango A O, et al. 2022. Review of meteorological drought in Africa: historical trends, impacts, mitigation measures, and prospects. Pure and Applied Geophysics, 179(4): 1365-1386.
|
|
|
| [4] |
Bai B, Yue P, Zhang Q, et al. 2023. Changing characteristics of ecosystem and water storage under the background of warming and humidification in the Qilian Mountains, China. Science of the Total Environment, 893: 164959, doi: 10.1016/j.scitotenv.2023.164959.
|
|
|
| [5] |
Chen H C, Jin F F. 2020. Fundamental behavior of ENSO phase locking. Journal of Climate, 33(5): 1953-1968.
|
|
|
| [6] |
Cui X, Xu G, He X F, et al. 2022. Influences of seasonal soil moisture and temperature on vegetation phenology in the Qilian Mountains. Remote Sensing, 14(15): 3645, doi: 10.3390/rs14153645.
|
|
|
| [7] |
Dai A, Zhao T B, Chen J. 2018. Climate change and drought: a precipitation and evaporation perspective. Current Climate Change Reports, 4(3): 301-312.
|
|
|
| [8] |
Diffenbaugh N S, Singh D, Mankin J S, et al. 2017. Quantifying the influence of global warming on unprecedented extreme climate events. Proceedings of the National Academy of Sciences, 114(19): 4881-4886.
|
|
|
| [9] |
Dogar M M, Sato T. 2018. Analysis of climate trends and leading modes of climate variability for MENA Region. Journal of Geophysical Research: Atmospheres, 123(23): 13074-13091.
|
|
|
| [10] |
Fu K Q, Wang K C. 2022. Quantifying flash droughts over China from 1980 to 2017. Journal of Geophysical Research: Atmospheres, 127(24): e2022JD037152, doi: 10.1029/2022JD037152.
|
|
|
| [11] |
Gazol A, Camarero J J. 2022. Compound climate events increase tree drought mortality across European forests. Science of the Total Environment, 816: 151604, doi: 10.1016/j.scitotenv.2021.151604.
|
|
|
| [12] |
Gong Z H, Zhu J, Li T T, et al. 2022. The features of regional flash droughts in four typical areas over China and the possible mechanisms. Science of the Total Environment, 827: 154217, doi: 10.1016/j.scitotenv.2022.154217.
|
|
|
| [13] |
Güçlü Y S. 2020. Improved visualization for trend analysis by comparing with classical Mann-Kendall test and ITA. Journal of Hydrology, 584: 124674, doi: 10.1016/j.jhydrol.2020.124674.
|
|
|
| [14] |
Hamed K H, Ramachandra Rao A. 1998. A modified Mann-Kendall trend test for autocorrelated data. Journal of Hydrology, 204(1-4): 182-196.
|
|
|
| [15] |
Hoover D L, Hajek O L, Smith M D, et al. 2022. Compound hydroclimatic extremes in a semi‐arid grassland: Drought, deluge, and the carbon cycle. Global Change Biology, 28(8): 2611-2621.
|
|
|
| [16] |
Hu J Y, Yao X J, Zhang C, et al. 2024. Spatial and temporal changes of glaciers and glacial lakes in the northern Tianshan Mountains over the past 30 years. Journal of Geographical Sciences, 34(9): 1857-1880.
|
|
|
| [17] |
Huang L X, Chen J, Yang K, et al. 2023. The northern boundary of the Asian summer monsoon and division of westerlies and monsoon regimes over the Tibetan Plateau in present-day. Science China Earth Sciences, 66(4): 882-893.
|
|
|
| [18] |
Jackson R B, Mooney H A, Schulze E D. 1997. A global budget for fine root biomass, surface area, and nutrient contents. Proceedings of the National Academy of Sciences, 94(14): 7362-7366.
|
|
|
| [19] |
Jiang W G, Yuan L H, Wang W J, et al. 2015. Spatio-temporal analysis of vegetation variation in the Yellow River basin. Ecological Indicators, 51(4): 117-126.
|
|
|
| [20] |
Kosaka Y, Xie S P. 2013. Recent global-warming hiatus tied to equatorial pacific surface cooling. Nature, 501(7467): 403-407.
|
|
|
| [21] |
Lan Y C, Ding Y J, Ersi K, et al. 2003. The relationship between ENSO cycle and temperature, precipitation and runoff in the Qilian Mountain area. Journal of Geographical Sciences, 13(3): 293-298.
|
|
|
| [22] |
Lavers D A, Villarini G. 2013. The nexus between atmospheric rivers and extreme precipitation across Europe. Geophysical Research Letters, 40(12): 3259-3264.
|
|
|
| [23] |
Lee H F, Zhang D D, Pei Q, et al. 2016. Demographic impact of climate change on northwestern China in the late imperial era. Quaternary International, 425: 237-247.
|
|
|
| [24] |
Li Y, Zheng Z C, Qin Y C, et al. 2021. Relative contributions of natural and man-made factors to vegetation cover change of environmentally sensitive and vulnerable areas of China. Journal of Cleaner Production, 321: 128917-128930.
|
|
|
| [25] |
Li Y, Peng S M. 2023. Ecological and hydrologic evolution history in the sensitive zone of both East Asian summer monsoon and Westerly since the Last Glacial Maximum. Journal of Mountain Science, 20(5): 1266-1281.
|
|
|
| [26] |
Liang E, Dawadi B, Pederson N, et al. 2019. Strong link between large tropical volcanic eruptions and severe droughts prior to monsoon in the central Himalayas revealed by tree-ring records. Science Bulletin, 64(14): 1018-1023.
|
|
|
| [27] |
López-Moreno J I, Vicente-Serrano S M. 2008. Positive and negative phases of the wintertime North Atlantic Oscillation and drought occurrence over Europe: A multitemporal-scale approach. Journal of Climate, 21(6): 1220-1243.
|
|
|
| [28] |
Lu J Q, Gan R, Yang F, et al. 2022. Drought characteristics and its correlation with circulation index in Henan Province based on SPEI index. China Rural Water and Hydropower, 4: 17-24. (in Chinese)
|
|
|
| [29] |
Ma F, Yuan X. 2025. The propagation from atmospheric flash drought to soil flash drought and its changes in a warmer climate. Journal of Hydrology, 654: 132877, doi: 10.1016/j.jhydrol.2025.132877.
|
|
|
| [30] |
Mishra A K, Singh V P. 2010. A review of drought concepts. Journal of Hydrology, 391(1-2): 202-216.
|
|
|
| [31] |
Mo K C, Lettenmaier D P. 2015. Heat wave flash droughts in decline. Geophysical Research Letters, 42(8): 2823-2829.
|
|
|
| [32] |
Neelam M, Hain C. 2024. Global flash droughts characteristics: onset, duration, and extent at watershed scales. Geophysical Research Letters, 51(10): e2024GL109657, doi: 10.1029/2024GL109657.
|
|
|
| [33] |
Nogués-Bravo D, Araújo M B, Errea M P, et al. 2007. Exposure of global mountain systems to climate warming during the 21st Century. Global Environmental Change, 17(3-4): 420-428.
|
|
|
| [34] |
O S, Park S K. 2024. Global ecosystem responses to flash droughts are modulated by background climate and vegetation conditions. Communications Earth & Environment, 5(1): 88, doi: 10.1038/s43247-024-01247-4.
|
|
|
| [35] |
Ogi M, Tachibana Y, Yamazaki K. 2003. Impact of the wintertime North Atlantic Oscillation (NAO) on the summertime atmospheric circulation. Geophysical Research Letters, 30(13): 2003GL017280, doi: 10.1029/2003GL017280.
|
|
|
| [36] |
Otkin J A, Anderson M C, Hain C, et al. 2013. Examining rapid onset drought development using the thermal infrared-based evaporative stress index. Journal of Hydrometeorology, 14(4): 1057-1074.
|
|
|
| [37] |
Park S, Kang D, Yoo C, et al. 2020. Recent ENSO influence on East African drought during rainy seasons through the synergistic use of satellite and reanalysis data. ISPRS Journal of Photogrammetry and Remote Sensing, 162: 17-26.
|
|
|
| [38] |
Raymond C, Horton R M, Zscheischler J, et al. 2020. Understanding and managing connected extreme events. Nature Climate Change, 10(7): 611-621.
|
|
|
| [39] |
Řehoř J, Brázdil R, Trnka M, et al. 2024. Flash droughts in Central Europe and their circulation drivers. Climate Dynamics, 62(2): 1107-1121.
|
|
|
| [40] |
Ren J X, Wang W G, Wei J, et al. 2024. Spatial and temporal variation of summer compound dry-hot events in China and their relationship with climate modes. China Rural Water and Hydropower, 9: 173-180. (in Chinese)
|
|
|
| [41] |
Seneviratne S I, Corti T, Davin E L, et al. 2010. Investigating soil moisture-climate interactions in a changing climate: a review. Earth-Science Reviews, 99(3-4): 125-161.
|
|
|
| [42] |
Sheffield J, Wood E F, Roderick M L. 2012. Little change in global drought over the past 60 years. Nature, 491(7424): 435-438.
|
|
|
| [43] |
Shenoy S, Gorinevsky D, Trenberth K E, et al. 2022. Trends of extreme US weather events in the changing climate. Proceedings of the National Academy of Sciences, 119(47): e2207536119, doi: 10.1073/pnas.2207536119.
|
|
|
| [44] |
Shi P H, Li Y, Biswas A, et al. 2024. Spatial-temporal evolution and intrinsic drivers of compound drought and heatwave events in mainland China. Science of the Total Environment, 948: 174834, doi: 10.1016/j.scitotenv.2024.174834.
|
|
|
| [45] |
Shi W J, Wang M L, Liu Y T. 2021. Crop yield and production responses to climate disasters in China. Science of the Total Environment, 750: 141147-141157.
|
|
|
| [46] |
Spinoni J, Vogt J V, Naumann G, et al. 2018. Will drought events become more frequent and severe in Europe? International Journal of Climatology, 38(4): 1718-1736.
|
|
|
| [47] |
Svoboda M, LeComte D, Hayes M, et al. 2002. The drought monitor. Bulletin of the American Meteorological Society, 83(8): 1181-1190.
|
|
|
| [48] |
Tabari H, Willems P. 2023. Global risk assessment of compound hot-dry events in the context of future climate change and socioeconomic factors. npj Climate and Atmospheric Science, 6(1): 74-84.
|
|
|
| [49] |
Tian H Z, Yang T B, Liu Q P. 2014. Climate change and glacier area shrinkage in the Qilian Mountains, China, from 1956 to 2010. Annals of Glaciology, 55(66): 187-197.
|
|
|
| [50] |
Tuholske C, Caylor K, Funk C, et al. 2021. Global urban population exposure to extreme heat. Proceedings of the National Academy of Sciences, 118(41): e2024792118, doi: 10.1073/pnas.2024792118.
|
|
|
| [51] |
Vicente-Serrano S M, Aguilar E, Martínez R, et al. 2017. The complex influence of ENSO on droughts in Ecuador. Climate Dynamics, 48(1-2): 405-427.
|
|
|
| [52] |
Wang J L, Yang B, Qin C, et al. 2014. Spatial patterns of moisture variations across the Tibetan Plateau during the past 700 years and their relationship with atmospheric oscillation modes. International Journal of Climatology, 34(3): 728-741.
|
|
|
| [53] |
Wang L Y, Yuan X. 2018. Two types of flash drought and their connections with seasonal drought. Advances in Atmospheric Sciences, 35(12): 1478-1490.
|
|
|
| [54] |
Wang S Z, Liu F G, Zhou Q, et al. 2021. Drought evolution characteristics of the Qinghai-Tibet Plateau over the last 100 years based on SPEI. Natural Hazards and Earth System Sciences Discussions, 73: 1-20.
|
|
|
| [55] |
Wang X J, Pang G J, Yang M X, et al. 2018. Precipitation changes in the Qilian Mountains associated with the shifts of regional atmospheric water vapour during 1960-2014. International Journal of Climatology, 38(12): 4355-4368.
|
|
|
| [56] |
Wang Y H, Li D H, Lu G Y, et al. 2022. Characteristics of climate change and its impacts on water resources in Qilian Mountains, China. Chinese Journal of Applied Ecology, 33(10): 2805-2812. (in Chinese)
|
|
|
| [57] |
Wei S H, Wang X J, Wang K, et al. 2023. Rethinking spatiotemporal variations in air temperature over the Qilian Mountains, western China, from 1979 to 2018. Atmospheric Research, 286: 106671, doi: 10.1016/j.atmosres.2023.106671.
|
|
|
| [58] |
Wu T, Zhao L, Li R, et al. 2013. Recent ground surface warming and its effects on permafrost on the central Qinghai‐Tibet Plateau. International Journal of Climatology, 33(4): 920-930.
|
|
|
| [59] |
Xing G J, Cui B F. 2019. Drought characteristics variations and its relationship with atmospheric circulation in Guizhou Province. South-to-North Water Transfers and Water Science & Technology, 17(6): 75-85. (in Chinese)
|
|
|
| [60] |
Xing X Y, Fang X H, Pang D, et al. 2024. Seasonal variation of the sea surface temperature growth rate of ENSO. Advances in Atmospheric Sciences, 41(3): 465-477.
|
|
|
| [61] |
Xue Z Y, Chen Y, Yin Y X, et al. 2024. Spatio-temporal characteristics and driving factors of flash drought in northern China from 1978 to 2020. Global and Planetary Change, 232: 104326, doi: 10.1016/j.gloplacha.2023.104326.
|
|
|
| [62] |
Yang M X, Nelson F E, Shiklomanov N I, et al. 2010. Permafrost degradation and its environmental effects on the Tibetan Plateau: A review of recent research. Earth-Science Reviews, 103(1-2): 31-44.
|
|
|
| [63] |
Yao T T, Liu S X, Hu S, et al. 2022. Response of vegetation ecosystems to flash drought with solar-induced chlorophyll fluorescence over the Hai River Basin, China during 2001-2019. Journal of Environmental Management, 313: 114947, doi: 10.1016/j.jenvman.2022.114947.
|
|
|
| [64] |
Yin X W, Wu Y P, Zhao W Z, et al. 2023. Spatiotemporal responses of net primary productivity of alpine ecosystems to flash drought: The Qilian Mountains. Journal of Hydrology, 624: 129865, doi: 10.1016/j.jhydrol.2023.129865.
|
|
|
| [65] |
Zha X N, Xiong L H, Liu C K, et al. 2023. Identification and evaluation of soil moisture flash drought by a nonstationary framework considering climate and land cover changes. Science of the Total Environment, 856: 158953, doi: 10.1016/j.scitotenv.2022.158953.
|
|
|
| [66] |
Zhang L F, Yan H W, Qiu L S, et al. 2021a. Spatial and temporal analyses of vegetation changes at multiple time scales in the Qilian Mountains. Remote Sensing, 13(24): 5046, doi: 10.3390/rs13245046.
|
|
|
| [67] |
Zhang M J, Cao Q, Zhu F L, et al. 2022. The asymmetric effect of different types of ENSO and ENSO Modoki on rainy season over the Yellow River basin, China. Theoretical and Applied Climatology, 149(3-4): 1567-1581.
|
|
|
| [68] |
Zhang W J, Mao W, Jiang F, et al. 2021b. Tropical Indo‐Pacific compounding thermal conditions drive the 2019 Australian extreme drought. Geophysical Research Letters, 48(2): e2020GL090323, doi: 10.1029/2020GL090323.
|
|
|
| [69] |
Zhang Y X, Wang H L, Shao X M, et al. 2024. High-resolution reconstruction of April-September precipitation and major extreme droughts in China over the past ∼530 years. Science Bulletin, 69(17): 2756-2764.
|
|
|
| [70] |
Zhao T T G, Xiong S T, Tian Y, et al. 2024. Compound dry and hot events over major river basins of the world from 1921 to 2020. Weather and Climate Extremes, 44: 100679, doi: 10.1016/j.wace.2024.100679.
|
|
|
| [71] |
Zhong Z Q, He B, Wang Y P, et al. 2023. Disentangling the effects of vapor pressure deficit on northern terrestrial vegetation productivity. Science Advances, 9(32): eadf3166, doi: 10.1126/sciadv.adf3166.
|
|
|
| [72] |
Zhou B Q, Zhai P M, Liao Z. 2024. Bivariate attribution of the compound hot and dry summer of 2022 on the Tibetan Plateau. Science China Earth Sciences, 67(7): 2122-2136.
|
|
|
| [73] |
Zhou K, Wang Y M, Chang J X, et al. 2021. Spatial and temporal evolution of drought characteristics across the Yellow River basin. Ecological Indicators, 131: 108207, doi: 10.1016/j.ecolind.2021.108207.
|
|
|
| [74] |
Zou J, Lu N, Jiang H, et al. 2022. Performance of air temperature from ERA5-land reanalysis in coastal urban agglomeration of Southeast China. Science of the Total Environment, 828: 154459, doi: 10.1016/j.scitotenv.2022.154459.
|
|
|
| [75] |
Zscheischler J, Westra S, van den Hurk B J J M, et al. 2018. Future climate risk from compound events. Nature Climate Change, 8(6): 469-477.
|
|
|
|
Viewed |
|
|
|
Full text
|
|
|
|
|
Abstract
|
|
|
|
|
Cited |
|
|
|
|
| |
Shared |
|
|
|
|
| |
Discussed |
|
|
|
|