| Research article |
|

|
|
|
| Integrating water use systems and soil and water conservation measures into a hydrological model of an Iranian Wadi system |
MAHMOODI Nariman1,*( ), KIESEL Jens1,2, D WAGNER Paul1, FOHRER Nicola1 ), KIESEL Jens1,2, D WAGNER Paul1, FOHRER Nicola1 |
1 Department of Hydrology and Water Resources Management, Institute for Natural Resource Conservation, Kiel University, Kiel 24118, Germany
2 Department of Ecosystem Research, Leibniz-Institute of Freshwater Ecology and Inland Fisheries (IGB), Berlin 12489, Germany |
|
|
|
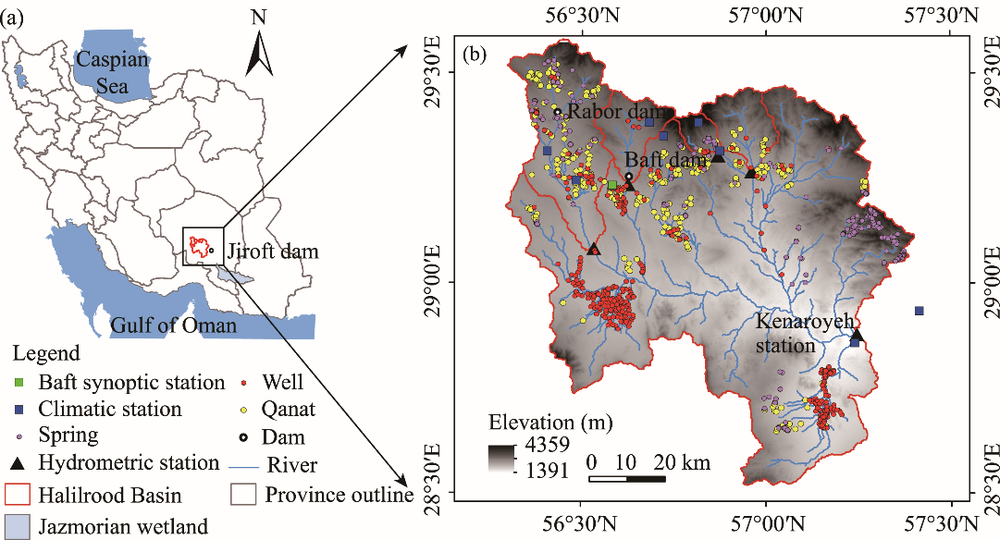
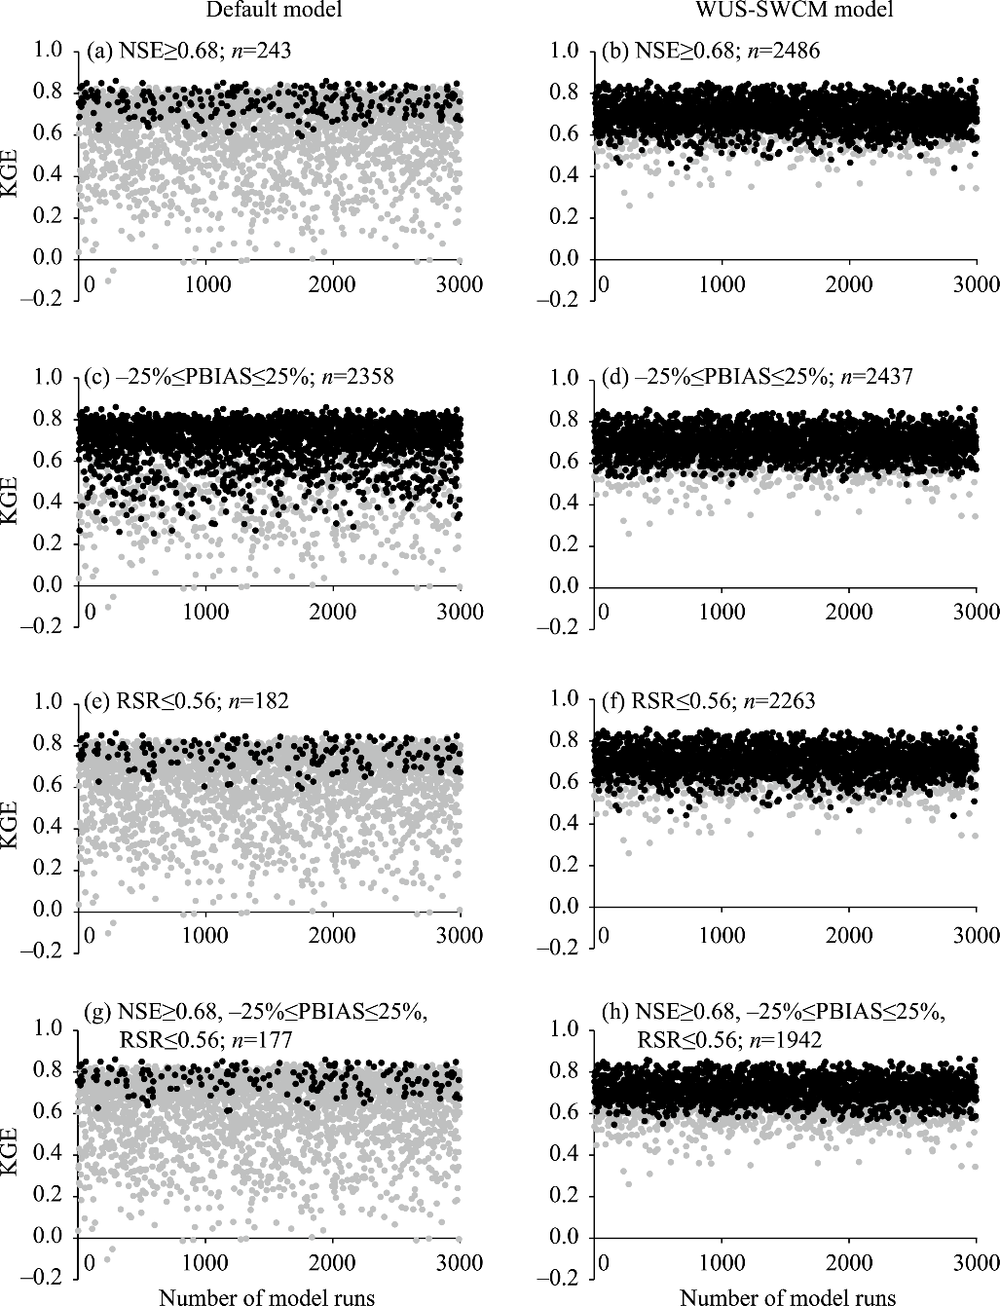
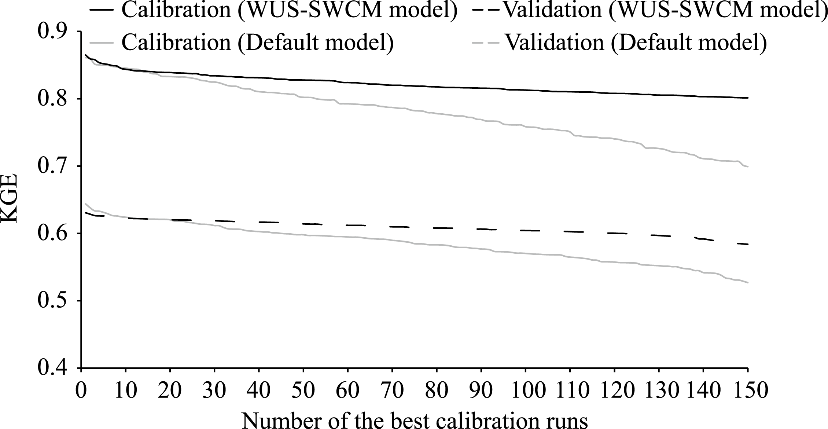
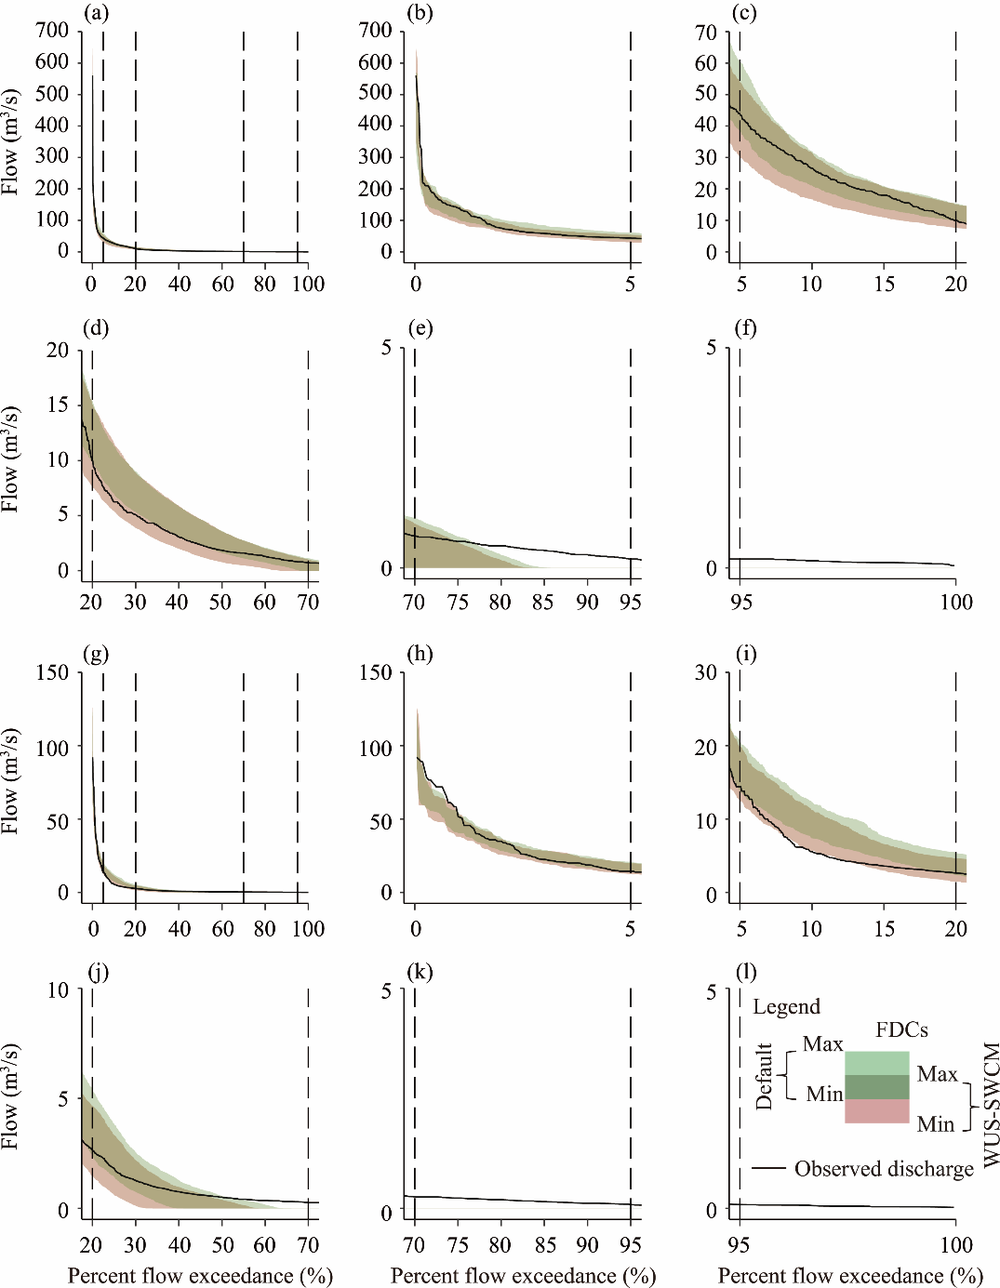
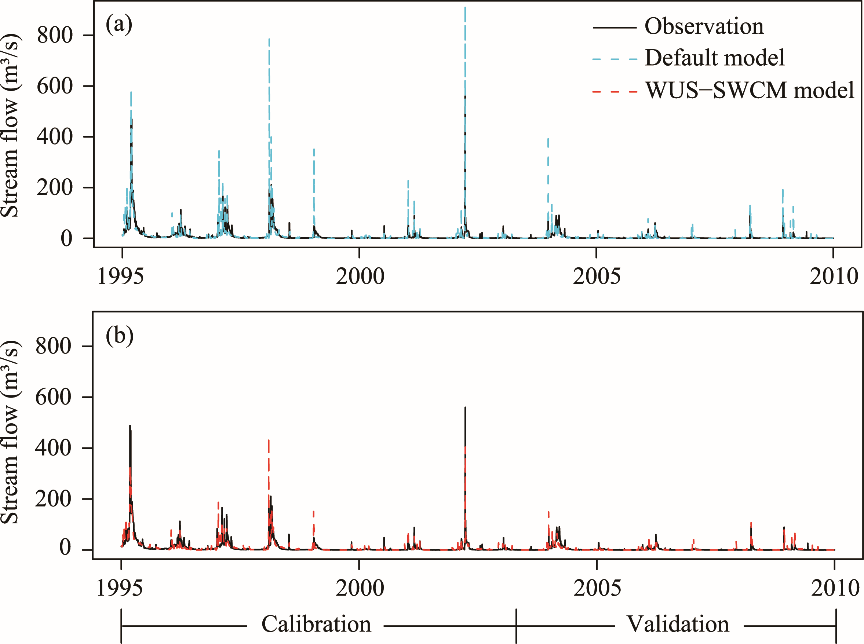
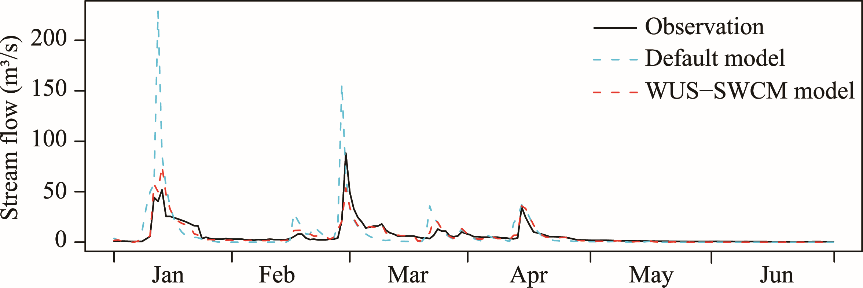
Abstract Water resources are precious in arid and semi-arid areas such as the Wadis of Iran. To sustainably manage these limited water resources, the residents of the Iranian Wadis have been traditionally using several water use systems (WUSs) which affect natural hydrological processes. In this study, WUSs and soil and water conservation measures (SWCMs) were integrated in a hydrological model of the Halilrood Basin in Iran. The Soil and Water Assessment Tool (SWAT) model was used to simulate the hydrological processes between 1993 and 2009 at daily time scale. To assess the importance of WUSs and SWCMs, we compared a model setup without WUSs and SWCMs (Default model) with a model setup with WUSs and SWCMs (WUS-SWCM model). When compared to the observed daily stream flow, the number of acceptable calibration runs as defined by the performance thresholds (Nash-Sutcliffe efficiency (NSE)≥0.68, -25%≤percent bias (PBIAS)≤25% and ratio of standard deviation (RSR)≤0.56) is 177 for the Default model and 1945 for the WUS-SWCM model. Also, the average Kling-Gupta ef?ciency (KGE) of acceptable calibration runs for the WUS-SWCM model is higher in both calibration and validation periods. When WUSs and SWCMs are implemented, surface runoff (between 30% and 99%) and water yield (between 0 and 18%) decreased in all sub-basins. Moreover, SWCMs lead to a higher contribution of groundwater flow to the channel and compensate for the extracted water by WUSs from the shallow aquifer. In summary, implementing WUSs and SWCMs in the SWAT model enhances model plausibility significantly.
|
|
Received: 11 September 2019
Published: 10 July 2020
|
|
Corresponding Authors:
|
| About author: *Corresponding author: Nariman MAHMOODI (E-mail: nmahmoodi@hydrology.uni-kiel.de) |
|
|
| [1] |
Abouabdillah A, White J, Arnold J G, et al. 2014. Evaluation of soil and water conservation measures in a semi-arid river basin in Tunisia using SWAT. Soil Use and Management, 30(4): 539-549.
doi: 10.1111/sum.12146
|
|
|
| [2] |
Adimassu Z, Mekonnen K, Yirga C, et al. 2014. Effect of soil bunds on runoff, soil and nutrient losses, and crop yield in the central highlands of Ethiopia. Land Degradation & Development, 25(6): 554-564.
|
|
|
| [3] |
Aghsaei H, Dinan N M, Moridi A, et al. 2020. Effects of dynamic land use and land cover change on water resources and sediment yied in the Anzali wetland catchment, Gilan, Iran. Science of the Total Environment, 712: 136449, doi: 10.1016/j.scitotenv.2019.136449.
doi: 10.1016/j.scitotenv.2019.136449
pmid: 32050376
|
|
|
| [4] |
Al-Qurashi A, McIntyre N, Wheater H, et al. 2008. Application of the Kineros2 rainfall-runoff model to an arid catchment in Oman. Journal of Hydrology, 355(1-4): 91-105.
doi: 10.1016/j.jhydrol.2008.03.022
|
|
|
| [5] |
Arabi M, Frankenberger J, Engel A B, et al. 2007. Representation of agricultural conservation practices with SWAT. Hydrological Processes, 22(16): 3045-3052.
|
|
|
| [6] |
Arnold J G, Srinivasan R, Muttiah R S, et al. 1998. Large area hydrologic modeling and assessment part I: Model development. JAWRA Journal of the American Water Resources Association, 34(1): 73-89.
doi: 10.1111/jawr.1998.34.issue-1
|
|
|
| [7] |
Arnold J G, Moriasi D N, Gassman P W, et al. 2012. SWAT: Model use, calibration, and validation. Transactions of the ASABE, 55(4): 1491-1508.
|
|
|
| [8] |
Ben S N C, Abida H. 2016. Runoff and sediment yield modeling using SWAT model: Case of Wadi Hatab Basin, Central Tunisia. Arabian Journal of Geosciences, 9: 579, doi: 10.1007/s12517-016-2607-3.
doi: 10.1007/s12517-016-2607-3
|
|
|
| [9] |
Boustani F. 2008. Sustainable water utilization in arid region of Iran by qanats. International Journal of Civil and Environmental Engineering, 2(7): 152-155.
|
|
|
| [10] |
Cheng M, Wang Y, Engel B, et al. 2017. Performance assessment of spatial interpolation of precipitation for hydrological process simulation in the three Gorges basin. Water, 9(11): 838, doi: 10.3390/w9110838.
doi: 10.3390/w9110838
|
|
|
| [11] |
Dile Y T, Daggupati P, George C, et al. 2016. Introducing a new open source GIS user interface for the SWAT model. Environmental Modelling and Software, 85: 129-138.
doi: 10.1016/j.envsoft.2016.08.004
|
|
|
| [12] |
ESA (the European Space Agency). 2010. Globcover 2009 (Global Land Cover Map), V2.3, 300 m resolution. [2019-09-01]. https://www.esa.int/ESA.
|
|
|
| [13] |
FAO/IIASA/ISRIC/ISS-CAS/JRC. 2009. Harmonized World Soil Database (version 1.1). FAO, Rome, Italy and IIASA, Laxenburg, Austria. [2019-09-01]. http://www.fao.org.
|
|
|
| [14] |
Ghaffari G, Keesstra S, Ghodousi J, et al. 2009. SWAT-simulated hydrological impact of land-use change in the Zanjanrood Basin, Northwest Iran. Hydrological Process, 24(7): 892-903.
doi: 10.1002/hyp.v24:7
|
|
|
| [15] |
Ghobadi Y, Pradhan B, Sayyad G A, et al2015. Simulation of hydrological processes and effects of engineering projects on the Karkheh River Basin and its wetland using SWAT2009. Quaternary International, 374: 144-153.
doi: 10.1016/j.quaint.2015.02.034
|
|
|
| [16] |
Gupta H V, Sorooshian S, Yapo P O. 1999. Status of automatic calibration for hydrologic models: Comparison with multilevel expert calibration. Journal of Hydrologic Engineering, 4(2): 135-143.
doi: 10.1061/(ASCE)1084-0699(1999)4:2(135)
|
|
|
| [17] |
Gupta H V, Kling H, Yilmaz K K, et al. 2009. Decomposition of the mean squared error and NSE performance criteria: Implications for improving hydrological modelling. Journal of Hydrology, 377(1-2): 80-91.
doi: 10.1016/j.jhydrol.2009.08.003
|
|
|
| [18] |
Guse B, Pfannerstill M, Kiesel J, et al. 2019. Analysing spatio-temporal process and parameter dynamics in models to characterise contrasting catchments. Journal of Hydrology, 570: 863-874.
doi: 10.1016/j.jhydrol.2018.12.050
|
|
|
| [19] |
Haas M B, Guse B, Pfannerstill M, et al. 2016. A joined multi-metric calibration of river discharge and nitrate loads with different performance measures. Journal of Hydrology, 536: 534-545.
doi: 10.1016/j.jhydrol.2016.03.001
|
|
|
| [20] |
Hallouz F, Meddi M, Mahé G, et al. 2018. Modeling of discharge and sediment transport through the SWAT model in the basin of Harraza (northwest of Algeria). Water Science, 32(1): 79-88.
doi: 10.1016/j.wsj.2017.12.004
|
|
|
| [21] |
Hashemi H, Berndtsson R, Persson M. 2015. Artificial recharge by floodwater spreading estimated by water balances and groundwater modelling in arid Iran. Hydrological Sciences Journal, 60(2): 336-350.
doi: 10.1080/02626667.2014.881485
|
|
|
| [22] |
Hernandez M, Miller S N, Goodrich D C, et al. 2000. Modeling runoff response to land cover and rainfall spatial variability in semi-arid watersheds. Environmental Monitoring and Assessment, 64: 285-298.
doi: 10.1023/A:1006445811859
|
|
|
| [23] |
Hussain I, Abu-Rizaiza O S, Habib M A A, et al. 2008. Revitalizing a traditional dryland water supply system: The karezes in Afghanistan, Iran, Pakistan and the Kingdom of Saudi Arabia. Journal Water International, 33(3): 333-349.
|
|
|
| [24] |
Ignatius A R, Jones J W. 2017. High resolution water body mapping for SWAT evaporative modelling in the upper Oconee watershed of Georgia, USA. Hydrological Process, 32(1): 51-65.
doi: 10.1002/hyp.v32.1
|
|
|
| [25] |
IWPCO (Iran Water & Power Resources Development Company). 2018. Annual report of the being operational dams. Tehran: Ministry of Energy. http://www.iwpco.ir.
|
|
|
| [26] |
Izady A, Davary K, Alizadeh A, et al. 2015. Groundwater conceptualization and modeling using distributed SWAT-based recharge for the semi-arid agricultural Neishaboor Plain, Iran. Hydrogeology Journal, 23: 47-68.
doi: 10.1007/s10040-014-1219-9
|
|
|
| [27] |
Jamshidi M, Tajrishy M, Maghrebi M. 2010. Modeling of point and non-point source pollution of nitrate with SWAT in the Jajrood River watershed, Iran. International Agricultural Engineering Journal, 19(2): 23-31.
|
|
|
| [28] |
Jarvis A, Reuter H I, Nelson A, et al.2008. Hole-filled SRTM for the globe. Version 4, available from the CGIAR-CSI SRTM 90 m Database. [2019-09-01]. http://srtm.csi.cgiar.org.
|
|
|
| [29] |
Khalili A, Bazrafshan Z. 2004. A trend analysis of annual seasonal and monthly precipitation over Iran during the last 116 years. Desert, 9(1): 25-34.
|
|
|
| [30] |
Khelifa W B, Hermassi T, Strohmeier S, et al. 2017. Parameterization of the effect of bench terraces on runoff and sediment yield by SWAT modeling in a small semi-arid watershed in northern Tunisia. Land Degradation & Development, 28(5): 1568-1578.
|
|
|
| [31] |
Kling H, Fuchs M, Paulin M. 2012. Runoff conditions in the upper Danube Basin under an ensemble of climate change scenarios. Journal of Hydrology, 424-425: 264-277.
|
|
|
| [32] |
Lesschen J P, Schoorl J M, Cammeraat L H. 2009. Modelling runoff and erosion for a semi-arid catchment using amulti-scale approach based on hydrological connectivity. Geomorphology, 109(3-4): 174-183.
doi: 10.1016/j.geomorph.2009.02.030
|
|
|
| [33] |
McIntyre N, Al-Qurashi A. 2009. Performance of ten rainfall-runoff models applied to an arid catchment in Oman. Environmental Modelling & Software, 24(6): 726-738.
|
|
|
| [34] |
McMichael C E, Hope A S, Loaiciga H A. 2006. Distributed hydrological modelling in California semi-arid shrublands: MIKE SHE model calibration and uncertainty estimation. Journal of Hydrology, 317(3-4): 307-324.
doi: 10.1016/j.jhydrol.2005.05.023
|
|
|
| [35] |
Moriasi D N, Arnold J G, van Liew M W, et al. 2007. Model evaluation guidelines for systematic quantification of accuracy in watershed simulations. Transactions of the ASABE, 50(3): 885-900.
doi: 10.13031/2013.23153
|
|
|
| [36] |
Mostafaeipour A. 2010. Historical background, productivity and technical issues of qanats. Water History, 2: 61-80.
doi: 10.1007/s12685-010-0018-z
|
|
|
| [37] |
Motiee H, McBean E, Semsar A, et al. 2006. Assessment of the contributions of traditional qanats in sustainable water resources management. Water Resources Development, 22(4): 575-588.
doi: 10.1080/07900620600551304
|
|
|
| [38] |
Naghibi S A, Pourghasemi H R, Abbaspour K. 2018. A comparison between ten advanced and soft computing models for groundwater qanat potential assessment in Iran using R and GIS. Theoretical and Applied Climatology, 131: 967-984.
doi: 10.1007/s00704-016-2022-4
|
|
|
| [39] |
Nash J E, Sutcliffe J E. 1970. River flow forecasting through conceptual models Part I: A discussion of principles. Journal of Hydrology, 10(3): 282-290.
doi: 10.1016/0022-1694(70)90255-6
|
|
|
| [40] |
Nasiri F, Mafakheri M S. 2015. Qanat water supply systems: A revisit of sustainability perspectives. Environmental Systems Research, 4: 13, doi: 10.1186/s40068-015-0039-9.
doi: 10.1186/s40068-015-0039-9
|
|
|
| [41] |
Neitsch S L, Arnold J, Kiniry J, et al. 2011. Soil and Water Assessment Tool Theoretical Documentation Version 2009. Texas: Texas Water Resources Institute.
|
|
|
| [42] |
Ning J, Gao Z, Lu Q. 2015. Runoff simulation using a modified SWAT model with spatially continuous HRUs. Environmental Earth Sciences, 74(7): 5895-5905.
doi: 10.1007/s12665-015-4613-2
|
|
|
| [43] |
Ouessar M, Bruggeman A, Abdelli F, et al. 2009. Modelling water-harvesting systems in the arid south of Tunisia using SWAT. Hydrology and Earth System Sciences, 13(10): 2003-2021.
doi: 10.5194/hess-13-2003-2009
|
|
|
| [44] |
Peugeot C, Cappelaere B, Vieux B E, et al. 2003. Hydrologic process simulation of a semiarid, endoreic catchment in Sahelian West Niger. 1. Model-aided data analysis and screening. Journal of Hydrology, 279(1-4): 224-243.
doi: 10.1016/S0022-1694(03)00181-1
|
|
|
| [45] |
Pfannerstill M, Guse B, Fohrer N. 2013. A multi-storage groundwater concept for the SWAT model to emphasize nonlinear groundwater dynamics in lowland catchments. Journal of Hydrology, 28(22): 5599-5612.
|
|
|
| [46] |
Pfannerstill M, Guse B, Fohrer N. 2014. Smart low flow signature metrics for an improved overall performance. Journal of Hydrology, 510: 447-458.
doi: 10.1016/j.jhydrol.2013.12.044
|
|
|
| [47] |
Qi Z, Kang G, Chu C, et al. 2017. Comparison of SWAT and GWLF model simulation performance in humid south and semi-arid north of China. Water, 9(567): 2-19.
doi: 10.3390/w9010002
|
|
|
| [48] |
Rafiei E A, Kappas M, Hosseini S Z. 2015. Assessing the impact of climate change on water resources, crop production and land degradation in a semi-arid river basin. Hydrology Research, 46(6): 854-870.
doi: 10.2166/nh.2015.143
|
|
|
| [49] |
Riad S, Mania J, Bouchaou L, et al. 2004. Rainfall-runoff model using an artificial neural network approach. Mathematical and Computer Modelling, 40(7-8): 839-846.
doi: 10.1016/j.mcm.2004.10.012
|
|
|
| [50] |
Rostamian R, Jaleh A, AfyuniI M, et al. 2008. Application of a SWAT model for estimating runoff and sediment in two mountainous basins in central Iran. Hydrological Sciences Journal, 53(5): 977-988.
doi: 10.1623/hysj.53.5.977
|
|
|
| [51] |
Sadeghi-Tabas S, Samadi S Z, Akbarpour A. 2017. Sustainable groundwater modeling using single- and multi-objective optimization algorithms. Journal of Hydroinformatics, 19(1): 97-114.
doi: 10.2166/hydro.2016.006
|
|
|
| [52] |
Shrestha M K, Recknagel F, Frizenschaf J, et al. 2016. Assessing SWAT models based on single and multi-site calibration for the simulation of flow and nutrient loads in the semi-arid Onkaparinga catchment in South Australia. Agricultural Water Management, 175: 61-71.
doi: 10.1016/j.agwat.2016.02.009
|
|
|
| [53] |
Soetaert K, Petzoldt T. 2010. Inverse modelling, sensitivity and Monte Carlo analysis in R using package FME. Journal of Statistical Software, 33(3): 1-28.
|
|
|
| [54] |
Tavakoli A R, Oweis T, Farahani H, et al. 2010. Improving rainwater productivity with supplemental irrigation in upper Karkheh River basin of Iran. In: CPWF Project: Improving On-farm Agricultural Water Productivity in the Karkheh River Basin (PN8). Research Report No. 6. Semnan, Iran.
|
|
|
| [55] |
Taye G, Poesen J, van Wesemae B, et al. 2013. Effects of land use, slope gradient, and soil and water conservation structures on runoff and soil loss in semi-arid northern Ethiopia. Physical Geography, 34(3): 236-259.
doi: 10.1080/02723646.2013.832098
|
|
|
| [56] |
Tigabu T B, Wagner D P, Hörmann G, et al. 2019. Modeling the impact of agricultural crops on the spatial and seasonal variability of water balance components in the Lake Tana basin, Ethiopia. Hydrology Research Journal, 50(5): 1376-1396.
|
|
|
| [57] |
Voss K A, Famiglietti J S, Lo M H, et al. 2013. Groundwater depletion in the Middle East from GRACE with implications for transboundary water management in the Tigris-Euphrates-Western Iran region. Water Resources Research, 49(2): 904-914.
doi: 10.1002/wrcr.20078
pmid: 23658469
|
|
|
| [58] |
Yebdri D, Errih M, Hamlet A, et al. 2007. The water resources management study of the Wadi Tafna Basin (Algeria) using the SWAT model. African Water Journal, 1(1): 33-47.
|
|
|
| [59] |
Yilmaz K K, Gupta H V, Wagener T. 2008. A process-based diagnostic approach to model evaluation: Application to the NWS distributed hydrologic model. Water Resources Research, 44(9): 1-18.
|
|
|
| [60] |
Zahabiyoun B, Goodarzi A M, Massah B R R, et al. 2013. Assessment of climate change impact on the Gharesou River basin using SWAT hydrological model. Clean-Soil, Air, Water, 41(6): 601-609.
doi: 10.1002/clen.201100652
|
|
|
| [61] |
Zettam A, Taleb A, Sauvage S, et al. 2017. Modelling hydrology and sediment transport in a semi-arid and anthropized catchment using the SWAT model: The case of the Tafna River (Northwest Algeria). Water, 9(216): 1-18.
doi: 10.3390/w9010001
|
|
|
|
Viewed |
|
|
|
Full text
|
|
|
|
|
Abstract
|
|
|
|
|
Cited |
|
|
|
|
| |
Shared |
|
|
|
|
| |
Discussed |
|
|
|
|