| Research article |
|


|
|
|
| Spatial-temporal characteristics of drought detected from meteorological data with high resolution in Shaanxi Province, China |
Yudan WANG1,2,3, Yunfeng KONG1,2,*( ), Hao CHEN3, Yongjian DING4 ), Hao CHEN3, Yongjian DING4 |
1 College of Environment and Planning, Henan University, Kaifeng 475004, China
2 Key Laboratory of Geospatial Technology for the Middle and Lower Yellow River Regions, Ministry of Education, Henan University, Kaifeng 475004, China
3 School of Geography and Environment, Baoji University of Arts and Sciences, Baoji 721013, China
4 Northwest Institute of Eco-Environment and Resources, Chinese Academy of Sciences, Lanzhou 730000, China |
|
|
|
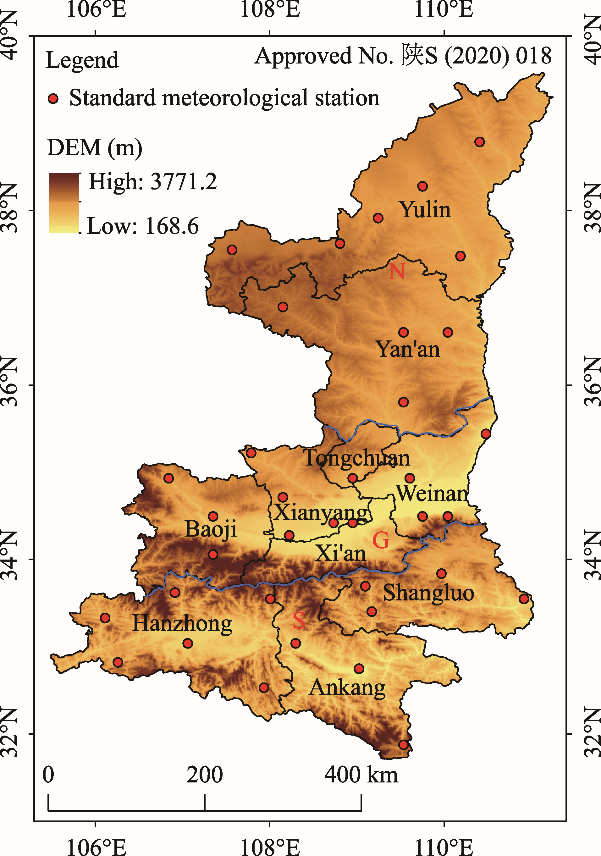
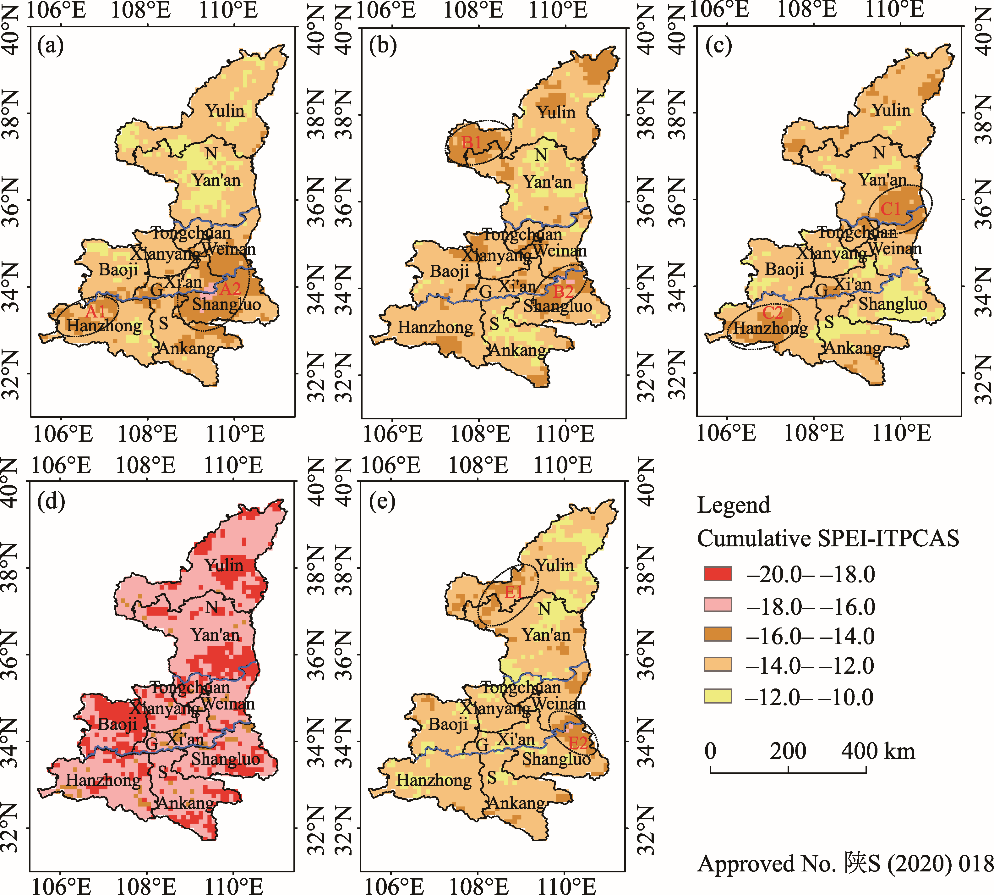
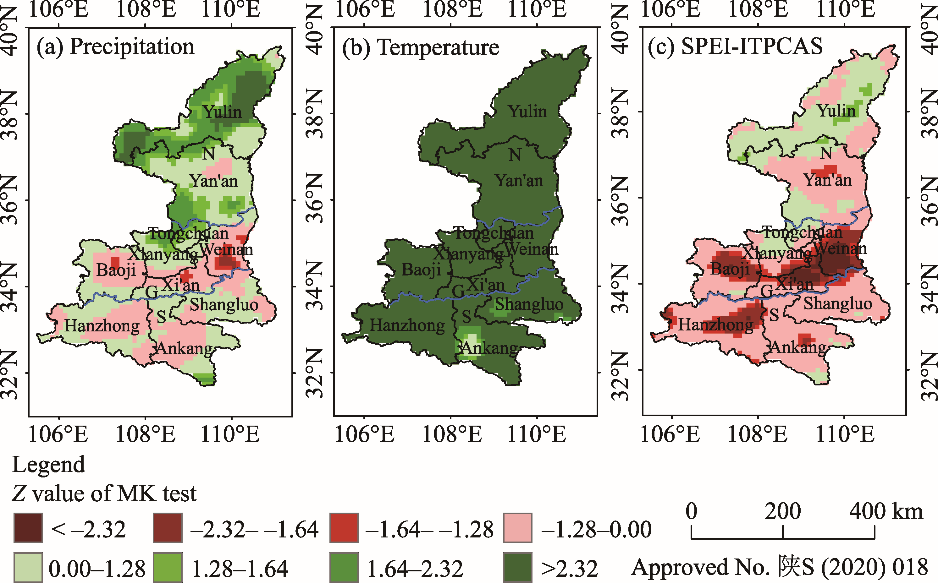
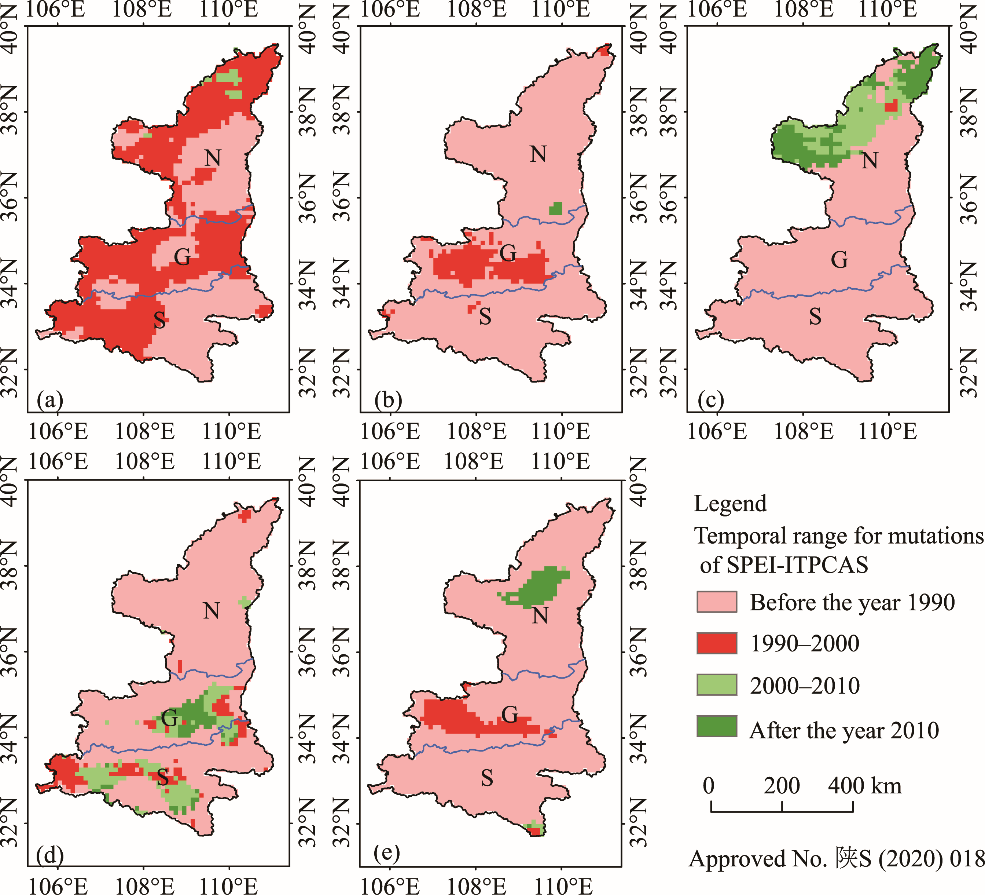
Abstract The spatial pattern of meteorological factors cannot be accurately simulated by using observations from meteorological stations (OMS) that are distributed sparsely in complex terrain. It is expected that the spatial-temporal characteristics of drought in regions with complex terrain can be better represented by meteorological data with the high spatial-temporal resolution and accuracy. In this study, Standard Precipitation Evapotranspiration Index (SPEI) calculated with meteorological factors extracted from ITPCAS (China Meteorological Forcing Dataset produced by the Institute of Tibetan Plateau Research, Chinese Academy of Sciences) was applied to identify the spatial-temporal characteristics of drought in Shaanxi Province of China, during the period of 1979-2016. Drought areas detected by SPEI calculated with data from ITPCAS (SPEI-ITPCAS) on the seasonal scale were validated by historical drought records from the Chinese Meteorological Disaster Canon-Shaanxi, and compared with drought areas detected by SPEI calculated with data from OMS (SPEI-OMS). Drought intensity, trend and temporal ranges for mutations of SPEI-ITPCAS were analyzed by using the cumulative drought intensity (CDI) index and the Mann-Kendall test. The results indicated that drought areas detected from SPEI-ITPCAS were closer to the historical drought records than those detected from SPEI-OMS. Severe and exceptional drought events with SPEI-ITPCAS lower than -1.0 occurred most frequently in summer, followed by spring. There was a general drying trend in spring and summer in Shaanxi Province and a significant wetting trend in autumn and winter in northern Shaanxi Province. On seasonal and annual scales, the regional and temporal ranges for mutations of SPEI-ITPCAS were different and most mutations occurred before the year 1990 in most regions of Shaanxi Province. The results reflect the response of different regions of Shaanxi Province to climate change, which will help to manage regional water resources.
|
|
Received: 03 July 2019
Published: 10 July 2020
|
|
Corresponding Authors:
|
| About author: *Corresponding author: KONG Yunfeng (E-mail: yfkong@henu.edu.cn) |
|
|
| [1] |
Ahmad I, Tang D S, Wang T F, et al. 2015. Precipitation trends over time using Mann-Kendall and spearman's rho tests in Swat River Basin, Pakistan. Advances in Meteorology, 2015: 431860, doi: https://doi.org/10.1155/2015/431860.
|
|
|
| [2] |
Allen K J, Ogden J, Buckley B M, et al. 2011. The potential to reconstruct broadscale climate indices associated with southeast Australian droughts from Athrotaxis species, Tasmania. Climate Dynamics, 37(9-10): 1799-1821.
doi: 10.1007/s00382-011-1011-7
|
|
|
| [3] |
Allen R, Smith M, Perrier A, et al. 1994. An update for the definition of reference evapotranspiration. ICID bulletin, 43(2): 1-34.
|
|
|
| [4] |
Beguería S, Vicente-Serrano S M, Reig F, et al. 2014. Standardized precipitation evapotranspiration index (SPEI) revisited: parameter fitting, evapotranspiration models, tools, datasets and drought monitoring. International Journal of Climatology, 34(10): 3001-3023.
doi: 10.1002/joc.3887
|
|
|
| [5] |
Changnon S A, Easterling W E. 1989. Measuring drought impacts: the illinois case. Jawra Journal of the American Water Resources Association, 25(1): 27-42.
doi: 10.1111/jawr.1989.25.issue-1
|
|
|
| [6] |
Chen Y Y, Yang K, He J, et al. 2011. Improving land surface temperature modeling for dry land of China. Journal of Geophysical Research-Atmospheres, 116(D20): 12-20.
|
|
|
| [7] |
Dai A G. 2011. Characteristics and trends in various forms of the Palmer Drought Severity Index during 1900-2008. Journal of Geophysical Research-Atmospheres, 116(D12): 1248-1256.
|
|
|
| [8] |
Duan Y, Wang W, Cai X J. 2013. Applied analyses on Palmer, SPEI and CI indices of Drought Process in Yangtze-Huaihe River Basins during Winter of 2010/Spring of 2011. Plateau Meterology, 32(4): 1126-1139. (in Chinese)
|
|
|
| [9] |
Gobena A K, Gan T Y. 2013. Assessment of trends and possible climate change impacts on summer moisture availability in western Canada based on metrics of the Palmer Drought Severity Index. Journal of Climate, 26(13): 4583-4595.
doi: 10.1175/JCLI-D-12-00421.1
|
|
|
| [10] |
Goovaerts P. 2000. Geostatistical approaches for incorporating elevation into the spatial interpolation of rainfall. Journal of Hydrology, 228(1-2): 113-129.
doi: 10.1016/S0022-1694(00)00144-X
|
|
|
| [11] |
Guo D L, Wang H J. 2013. Simulation of permafrost and seasonally frozen ground conditions on the Tibetan Plateau, 1981-2010 . Journal of Geophysical Research-Atmospheres, 118(11): 5216-5230.
doi: 10.1002/jgrd.50457
|
|
|
| [12] |
Hannaford J, Lloyd-Hughes B, Keef C, et al. 2011. Examining the large-scale spatial coherence of European drought using regional indicators of precipitation and streamflow deficit. Hydrological Processes, 25(7): 1146-1162.
doi: 10.1002/hyp.v25.7
|
|
|
| [13] |
He B, Lü A F, Wu J J, et al. 2011. Drought hazard assessment and spatial characteristics analysis in China. Journal of Geographical Sciences, 21(2): 235-249.
doi: 10.1007/s11442-011-0841-x
|
|
|
| [14] |
He S W, Nan Z T, Zhang L, et al. 2015. Spatial-temporal distribution of water and energy fluxes in the upper reaches of the Heihe River simulated with VIC model. Journal of Glaciology and Geocryology, 37(1): 211-225. (in Chinese)
doi: 10.7522/j.issn.1000-0240.2015.0024
|
|
|
| [15] |
Jia J, Wang Q, Li L H. 2016. Long-term oscillation of drought conditions in the western China: an analysis of PDSI on a decadal scale. Journal of Arid Land, 8(6): 819-831.
doi: 10.1007/s40333-016-0089-5
|
|
|
| [16] |
Jiang R G, Xie J C, He H L, et al. 2015. Use of four drought indices for evaluating drought characteristics under climate change in Shaanxi, China: 1951-2012. Natural Hazards, 75(3): 2885-2903.
doi: 10.1007/s11069-014-1468-x
|
|
|
| [17] |
Kan B Y, Su F G, Tong K, et al. 2013. Analysis of the applicability of four precipitation datasets in the upper reaches of the Yarkant River, the Karakorum. Journal of Glaciology and Geocryology, 35(3): 710-722. (in Chinese)
doi: 10.7522/j.issn.1000-0240.2013.0081
|
|
|
| [18] |
Kendall M G. 1975. Rank Correlation Methods. London: Charles Griffin, 200-202.
|
|
|
| [19] |
Kim T W, Valdés J B, Aparicio J. 2002. Frequency and spatial characteristics of droughts in the Conchos River Basin, Mexico. Water International, 27(3): 420-430
doi: 10.1080/02508060208687021
|
|
|
| [20] |
Kogan F, Adamenko T, Guo W. 2013. Global and regional drought dynamics in the climate warming era. Remote Sensing Letters, 4(4): 364-372.
doi: 10.1080/2150704X.2012.736033
|
|
|
| [21] |
Liu C R, Chen H, Ning C, et al. 2018. Analysis of drought characteristics in Shaanxi Province during 1961-2016 based on SPI. Acta Agriculturae Jiangxi, 30(4): 117-122. (in Chinese)
|
|
|
| [22] |
Liu W L, Zhang M J, Wang S J, et al. 2013. Changes in precipitation extremes over Shaanxi Province, northwestern China, during 1960-2011. Quaternary International, 313-314: 118-129.
|
|
|
| [23] |
Liu Y, Yang X L, Ren L L, et al. 2015. A new physically based self-calibrating palmer drought severity index and its performance evaluation. Water Resources Management, 29(13): 4833-4847.
doi: 10.1007/s11269-015-1093-9
|
|
|
| [24] |
Liu Y F, Yuan Z H, Feng J M, et al. 2016. Dry-wet condition of Shaanxi Province in recent 56 years based on surface humidity index. Arid Land Geography, 39(6): 1186-1196. (in Chinese)
|
|
|
| [25] |
Loukas A, Vasiliades L, Tzabiras J. 2008. Climate change effects on drought severity. Advances in Geosciences, 17: 23-29.
doi: 10.5194/adgeo-17-23-2008
|
|
|
| [26] |
Lu J, Jia L, Menenti M, et al. 2018. Performance of the standardized precipitation index based on the TMPA and CMORPH precipitation products for drought monitoring in China. IEEE Journal of Selected Topics in Applied Earth Observations and Remote Sensing, 11(5): 1387-1396.
doi: 10.1109/JSTARS.2018.2810163
|
|
|
| [27] |
Ma M W, Ren L Y, Singh V P, et al. 2015. Evaluation and application of the SPDI-JDI for droughts in Texas, USA. Journal of Hydrology, 521: 34-45.
doi: 10.1016/j.jhydrol.2014.11.074
|
|
|
| [28] |
Mann H B. 1945. Nonparametric tests against trend. Econometrico, 13(3): 245-259.
doi: 10.2307/1907187
|
|
|
| [29] |
Meza F J. 2013. Recent trends and ENSO influence on droughts in Northern Chile: An application of the Standardized Precipitation Evapotranspiration Index. Weather & Climate Extremes, 1(1): 51-58.
|
|
|
| [30] |
Naumann G, Dutra E, Barbosa P, et al. 2014. Comparison of drought indicators derived from multiple data sets over Africa. Hydrology and Earth System Sciences, 18(18): 1625-1640.
doi: 10.5194/hess-18-1625-2014
|
|
|
| [31] |
Pandey R P, Ramasastri K S. 2010. Relationship between the common climatic parameters and average drought frequency. Hydrological Processes, 15(6): 1019-1032.
doi: 10.1002/(ISSN)1099-1085
|
|
|
| [32] |
Parsons D J, Rey D, Tanguy M, et al. 2019. Regional variations in the link between drought indices and reported agricultural impacts of drought. Agricultural Systems, 173: 119-129.
doi: 10.1016/j.agsy.2019.02.015
|
|
|
| [33] |
Paulo A A, Rosa R D, Pereira L S. 2012. Climate trends and behaviour of drought indices based on precipitation and evapotranspiration in Portugal. Natural Hazards and Earth System Sciences, 12(5): 1481-1491.
|
|
|
| [34] |
Qiao L, Cheng K, Wu L R, et al. 2012. Spatial and temporal distribution of meteorological drought disasters in Shaanxi Province over past 30 year. Bulletin of Soil and Water Conservation, 46(1): 253-256. (in Chinese)
|
|
|
| [35] |
Rhee J, Im J. 2017. Meteorological drought forecasting for ungauged areas based on machine learning: Using long-range climate forecast and remote sensing data. Agricultural and Forest Meteorology, 237-238: 105-122.
doi: 10.1016/j.agrformet.2017.02.011
|
|
|
| [36] |
Salehnia N, Zare H, Kolsoumi S, et al. 2017a. Predictive value of Keetch-Byram Drought Index for cereal yields in a semi-arid environment. Theoretical & Applied Climatology, 134(3-4): 1005-1014.
|
|
|
| [37] |
Salehnia N, Alizadeh A, Sanaeinejad H, et al. 2017b. Estimation of meteorological drought indices based on AgMERRA precipitation data and station-observed precipitation data. Journal of Arid Land, 9(6): 797-809.
doi: 10.1007/s40333-017-0070-y
|
|
|
| [38] |
Spinoni J, Barbosa P, de Jager A, et al. 2019. A new global database of meteorological drought events from 1951 to 2016. Journal of Hydrology: Regional Studies, 22(4): 100593-100616.
doi: 10.1016/j.ejrh.2019.100593
|
|
|
| [39] |
Szcześniak M, Piniewski M. 2015. Improvement of hydrological simulations by applying daily precipitation interpolation schemes in meso-scale catchments. Water, 7(2): 747-779.
doi: 10.3390/w7020747
|
|
|
| [40] |
Thornthwaite C W. 1937. Microclimatic studies in Oklahoma and Ohio. Science, 86(2222): 100-101.
doi: 10.1126/science.86.2222.100
pmid: 17733943
|
|
|
| [41] |
Tian M, Li W G. 2015. Analysis of spatial and temporal characteristics of drought and flood based on TRMM remote sensing data. Transactions of the Chinese Society for Agricultural Machinery, 46(5): 252-257. (in Chinese)
|
|
|
| [42] |
Tsakiris G, Pangalou D, Vangelis H. 2007. Regional drought assessment based on the Reconnaissance Drought Index (RDI). Water Resources Management, 21(5): 821-833.
doi: 10.1007/s11269-006-9105-4
|
|
|
| [43] |
Vasiliades L, Loukas A. 2009. Hydrological response to meteorological drought using the Palmer drought indices in Thessaly, Greece. Desalination, 237(1-3): 3-21.
doi: 10.1016/j.desal.2007.12.019
|
|
|
| [44] |
Vicente-Serrano S M, Beguería S, López-Moreno J I. 2010a. A multiscalar drought index sensitive to global warming: the Standardized Precipitation Evapotranspiration Index. Journal of Climate, 23(7): 1696-1718.
doi: 10.1175/2009JCLI2909.1
|
|
|
| [45] |
Vicente-Serrano S M, Begueria S, López-Moreno J I, et al. 2010b. A new global 0.5 degrees gridded dataset (1901-2006) of a multiscalar drought index: comparison with current drought index datasets based on the Palmer Drought Severity Index. Journal of Hydrometeorology, 11(4): 1033-1043.
doi: 10.1175/2010JHM1224.1
|
|
|
| [46] |
Vicente-Serrano S M, Beguería S, López-Moreno J I. 2011. Comment on "characteristics and trends in various forms of the Palmer Drought Severity Index (PDSI) during 1900-2008" by Aiguo Dai. Journal of Geophysical Research-Atmospheres, 116(D19): 4-13.
|
|
|
| [47] |
Wan X J, Ren Z Y, Zhang C. 2013. Research on spatial-temporal distribution of temperature and precipitation changes in Shaanxi. Journal of Arid Land Resources and Environment, 27(6): 140-147. (in Chinese)
|
|
|
| [48] |
Wang F, Wang Z M, Yang H B, et al. 2018. Study of the temporal and spatial patterns of drought in the Yellow River basin based on SPEI. Science China Earth Sciences, 61(8): 1098-1111.
doi: 10.1007/s11430-017-9198-2
|
|
|
| [49] |
Wang X Y, Zhuo L, Li C, et al. 2019. Temporal and spatial evolution trends of drought in northern Shaanxi of China: 1960-2100. Theoretical and Applied Climatology, 139(3-4): 965-979.
doi: 10.1007/s00704-019-03024-2
|
|
|
| [50] |
Wang Y D, Chen H, Liu C R, et al. 2018. Applicability of ITPCAS and CMORPH precipitation datasets over Shaanxi Province. Arid Zone Research, 35(3): 579-588. (in Chinese)
|
|
|
| [51] |
Wang Z, Guan K Y, Sheffield J, et al. 2016. Depiction of drought over sub-Saharan Africa using reanalyses precipitation data sets. Journal of Geophysical Research Atmospheres, 121(18): 10555-10574.
doi: 10.1002/jgrd.v121.18
|
|
|
| [52] |
Wells N, Goddard S, Hayes M J. 2004. A self-calibrating Palmer Drought Severity Index. Journal of Climate, 17(12): 2335-2351.
doi: 10.1175/1520-0442(2004)017<2335:ASPDSI>2.0.CO;2
|
|
|
| [53] |
Xue B L, Wang L, Yang K, et al. 2013. Modeling the land surface water and energy cycles of a mesoscale watershed in the central Tibetan Plateau during summer with a distributed hydrological model. Journal of Geophysical Research-Atmospheres, 118(16): 8857-8868.
doi: 10.1002/jgrd.50696
|
|
|
| [54] |
Yang M J, Yan D H, Yu Y D, et al. 2016. SPEI-based spatiotemporal analysis of drought in Haihe River Basin from 1961 to 2010. Advances in Meteorology, 2016: 7658015, doi: 10.1155/2016/7658015.
|
|
|
| [55] |
Yang Q, Li M X, Zheng Z Y, et al. 2017. Regional applicability of seven meteorological drought indices in China. Science China Earth Sciences. 60(4): 745-760.
doi: 10.1007/s11430-016-5133-5
|
|
|
| [56] |
Yu F K, Huang X H, Liang Q B, et al. 2015. Ecological water demand of regional vegetation: the example of the 2010 severe drought in southwest China. Plant Biosystems-An International Journal Dealing with all Aspects of Plant Biology, 149(1): 100-110.
doi: 10.1080/11263504.2013.817488
|
|
|
| [57] |
Yu M X, Li Q F, Hayes M J, et al. 2014. Are droughts becoming more frequent or severe in China based on the Standardized Precipitation Evapotranspiration Index: 1951-2010? International Journal of Climatology, 34(3): 545-558.
doi: 10.1002/joc.3701
|
|
|
| [58] |
Yuan F, Ma M W, Ren L L, et al. 2015. Possible future climate change impacts on the hydrological drought events in the Weihe River Basin, China. Advances in Meteorology, 2016: 2905198, doi: https://doi.org/10.1155/2016/2905198.
|
|
|
| [59] |
Zhai Y A. 2005. China Meteorological Disaster Canon-Shaanxi Volume. Beijing: Meteorological Press, 30-41. (in Chinese)
|
|
|
| [60] |
Zhang R, Chen Z Y, Xu L J, et al. 2019. Meteorological drought forecasting based on a statistical model with machine learning techniques in Shaanxi Province, China. Science of the Total Environment, 665: 338-346.
doi: 10.1016/j.scitotenv.2019.01.431
pmid: 30772564
|
|
|
| [61] |
Zhang X S, Srinivasan R. 2009. GIS-Based spatial precipitation estimation: A comparison of geostatistical approaches. Journal of the American Water Resources Association, 45(4): 894-906.
doi: 10.1111/jawr.2009.45.issue-4
|
|
|
|
Viewed |
|
|
|
Full text
|
|
|
|
|
Abstract
|
|
|
|
|
Cited |
|
|
|
|
| |
Shared |
|
|
|
|
| |
Discussed |
|
|
|
|