| Research article |
|

|
|
|
| Spectral parameter-based models for leaf potassium concentration estimation in Ping'ou hybrid hazelnut |
ZHAO Shanchao, PAN Cunde*( ) ) |
| College of Forestry and Horticulture, Xinjiang Agricultural University, Urumqi 830052, China |
|
|
|
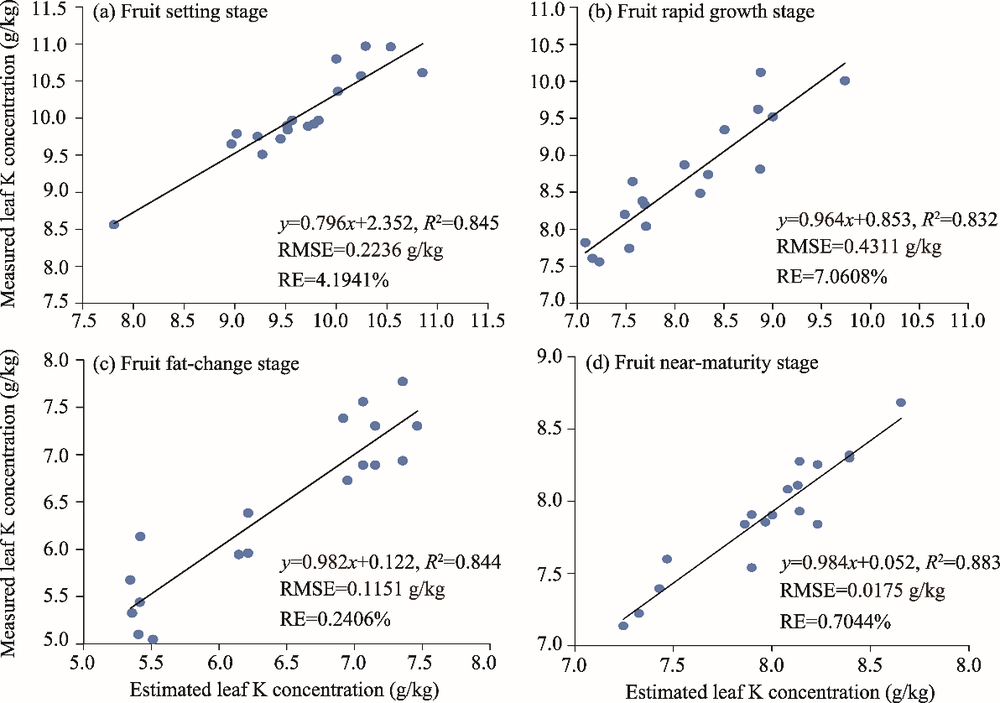
Abstract Ping′ou hybrid hazelnut is produced by cross cultivation and is widely cultivated in northern China with good development prospects. Based on a field experiment of fertilizer efficiency, the leaf spectral reflectance and leaf potassium (K) concentration were measured with different quantities of K fertilizer applied at four fruit growth stages (fruit setting stage, fruit rapid growth stage, fruit fat-change stage, and fruit near-maturity stage) of Ping′ou hybrid hazelnut in 2019. Spectral parameters that were significantly correlated with leaf K concentration were selected using Pearson correlation analysis, and spectral parameter estimation models of leaf K concentration were established by employing six different modelling methods (exponential function, power function, logarithmic function, linear function, quadratic function, and cubic function). The results indicated that at the fruit setting period, leaf K concentration was significantly correlated with Dy (spectra slope of yellow edge), Rg (reflectance of the green peak position), λo (red valley position), SDb (blue edge area), SDr/SDb (where SDr represents red edge area), and (SDr-SDb)/(SDr+SDb) (P<0.01). There were significant correlations of leaf K concentration with Dy, Rg, SDb, Rg/Ro (where Ro is the reflectance of the red valley position), and (Rg-Ro)/(Rg+Ro) at the fruit rapid growth stage (P<0.01). Further, significant correlations of leaf K concentration with Rg, Ro, RNIR/Green, and RNIR/Blue were obtained at the fruit fat-change period (P<0.01). Finally, leaf K concentration showed significant correlations with Dr, Rg, Ro, SDy (yellow edge area), and SDr at the fruit near-maturity stage (P<0.01). Through a cubic function analysis, regression estimation model of leaf K concentration with highest fitting degree (R2) values at the four fruit growth stages was established. The findings in this study demonstrated that it is feasible to estimate leaf K concentration of Ping′ou hybrid hazelnut at the various phenological stages of fruit development by establishing regression models between leaf K concentration and spectral parameters.
|
|
Received: 17 August 2020
Published: 10 November 2020
|
|
Corresponding Authors:
|
About author: *PAN Cunde (E-mail: pancunde@163.com)
|
|
|
| [1] |
Alex C W. 2006. Plant Nutrition. New York: InfoBase Publishing, 14-17.
|
|
|
| [2] |
Allen V B, David J P. 2007. Handbook of Plant Nutrition. Florida: Chemical Rubber Company Press, 21-50.
|
|
|
| [3] |
Davies W, Zhang J. 1991. Root signals and the regulation of growth and the development of plants in drying soil. Annual Review of Plant Physiology and Plant Molecular Biology, 42:55-76.
doi: 10.1146/annurev.pp.42.060191.000415
|
|
|
| [4] |
Fisher R A. 1968. Stomatal opening: role of potassium uptake by guard cells. Science, 160(3829):784-785.
doi: 10.1126/science.160.3829.784
pmid: 5646418
|
|
|
| [5] |
Hu Z Z, Pan C D, Zhao S C. 2019. Spectral inversion of the water content of Hazelnut leaves at various phenolobical periods of fruit development. Northern Horticulture, 2019(09):20-26. (in Chinese)
|
|
|
| [6] |
Izhar A, Frans J M M. 2014. Cellular and tissue distribution of potassium: Physiological relevance, mechanisms and regulation. Journal of Plant Physiology, 171(9):708-714.
doi: 10.1016/j.jplph.2013.10.016
pmid: 24810768
|
|
|
| [7] |
Jiao W J, Min Q W, Lin K, et al. 2006. Progress and perspective on nutrition diagnosis of plant nitrogen. Chinese Agricultural Science Bulletin, 22(12):351-355. (in Chinese)
|
|
|
| [8] |
Lu J S, Li W Y, Yu M L, et al. 2020. Estimation of rice plant potassium accumulation based on non-negative matrix factorization using hyperspectral reflectance. Precision Agriculture, 5:1-24.
|
|
|
| [9] |
Koch K, Mengel K. 1974. The influence of the level of K supply to young tobacco plants on short-term uptake and utilization of nitrate. Journal of the Science of Food and Agriculture, 25:465-471.
doi: 10.1002/(ISSN)1097-0010
|
|
|
| [10] |
Maathuis F J M, Oosterhuis D, Berkowitz G. 1999. Frontiers in Potassium Nutrition: New Perspectives on the Effects of Potassium on Physiology of Plants. Georgia: Potash and Phosphate Institute, 58-95.
|
|
|
| [11] |
Marschner H. 2011. Mineral Nutrition of Higher Plants. (3rd ed.). San Diego: Academic Press, 35-49.
|
|
|
| [12] |
Mengel K, Kirkby E A. 1987. Principles of Plant Nutrition. Bern: International Potash Institute, 481-511.
|
|
|
| [13] |
Nieves-Cordones M, Alemán F, Martínez V, et al. 2014. K+ uptake in plant roots. The systems involved, their regulation and parallels in other organisms. Journal of Plant Physiology, 171(9):14-22.
|
|
|
| [14] |
Payal B, Bably P. 2020. Determination of concentration of total sodium and potassium in surface and ground water using a flame photometer. Applied Water Science, 10(1):16-21.
doi: 10.1007/s13201-019-1103-9
|
|
|
| [15] |
Shan X C, Song F H, Shi Y J, et al. 2015. Effects of spraying plant growth regulators on photosynthetic characteristics traits and fructify growth of the major Hybrid Hazel. Xinjiang Agricultural Sciences, 52(6):1063-1070. (in Chinese)
|
|
|
| [16] |
Stiles K A, Van V E. 2004. Role of K+ in leaf growth: K+ uptake is required for light-stimulated H+ efflux but not solute accumulation. Plant Cell and Environment, 27:315-325.
doi: 10.1111/pce.2004.27.issue-3
|
|
|
| [17] |
Tallman G. 1992. The chemiosmotic model of stomatal opening revisited. Critical Reviews in Plant Sciences, 11(1):35-57.
|
|
|
| [18] |
Thomas J R, Oerther G F. 1972. Estimating nitrogen concentration of sweet pepper leaves by reflectance measurements. Agronomy Journal, 64(1):11-13.
doi: 10.2134/agronj1972.00021962006400010004x
|
|
|
| [19] |
Walker D J, Leigh R A, Miller A J. 1996. Potassium homeostasis in vacuolate plant cells. Proceedings of the National academy of Sciences of the United States of America, 93:10510-10514.
|
|
|
| [20] |
Wang L Z, Song F H, Shi Y J, et al. 2020. Effects of different N P K fertilizer application rates on photosynthetic characteristics, yield and quality of Corylus heterophylla × C. avellana. Forest Research, 33(1):55-61. (in Chinese)
|
|
|
| [21] |
Wang Z, Zhou L D, Li H. 2011. Predicting nitrogen concentrations in fresh peach leaf from hyper spectral remote sensing. Chinese Agricultural Science Bulletin, 27(4):85-90. (in Chinese)
|
|
|
| [22] |
Zhang S F, Jiang R F, Chen X P, et al. 2011. Soil Testing and Fertilization. Beijing: China Agricultural University Press, 80. (in Chinese)
|
|
|
| [23] |
Zhao H B, Wang J, Dong C X, et al. 2014. Fast determination of potassium content in fresh pear leaves using visible/near infrared spectroscopy technique. Soil, 46(2):256-261. (in Chinese)
|
|
|
|
Viewed |
|
|
|
Full text
|
|
|
|
|
Abstract
|
|
|
|
|
Cited |
|
|
|
|
| |
Shared |
|
|
|
|
| |
Discussed |
|
|
|
|