Spatiotemporal patterns of the forage-livestock balance in the Xilin Gol steppe, China: implications for sustainably utilizing grassland-ecosystem services
QU Yingbo1, ZHAO Yuanyuan1,2,*(), DING Guodong1,2, CHI Wenfeng3, GAO Guanglei1,2
1Key Laboratory of State Forestry Administration on Soil and Water Conservation, Beijing Forestry University, Beijing 100083, China 2Yanchi Research Station, School of Soil and Water Conservation, Beijing Forestry University, Beijing 100083, China 3College of Resources and Environmental Economics, Inner Mongolia University of Finance and Economics, Hohhot 010017, China
Understanding the spatiotemporal patterns of the forage-livestock balance is imperative for regionally arranging animal husbandry production while ensuring sustainable grassland-ecosystem service use. The Xilin Gol steppe is an important native grassland resource in Inner Mongolia Autonomous Region, China. This study aimed to elucidate the dynamics of the forage-livestock balance in the Xilin Gol steppe during the period 2000-2015. We evaluated the forage production and corresponding livestock carrying capacity (LCC) in the growing seasons of 2000-2015 using remote sensing data and field surveys. The spatiotemporal patterns of the forage-livestock balance were then assessed at regional, city (including city, county and banner), and village scales using statistical and household survey data. The results showed that both forage production and LCC decreased in the Xilin Gol steppe from east to west. During the period 2000-2015, the regional average forage production and corresponding LCC fluctuated without following a distinct trend, but were consistent with the variations in precipitation. The forage-livestock balance varied with time, space, and scale. At the regional scale, steppes were overgrazed in the early 2000s, but a forage-livestock balance or even grazing potential was achieved in other years. At the city scale, approximately half of the region exhibited a "forage-livestock balance" since 2000. However, about half of the region still experienced overgrazing, which mainly located in the southwest sandy zones. Such changes may have been affected by the variations in grassland quality, forage production, compensation payment, and so on. We suggest a location-specific management scheme for grazing constraints, ecological compensation payment, and industry development to aid in harmonizing animal husbandry and environmental restoration, while promoting sustainable development goals by 2030.
Received: 16 August 2020
Published: 10 February 2021
QU Yingbo, ZHAO Yuanyuan, DING Guodong, CHI Wenfeng, GAO Guanglei. Spatiotemporal patterns of the forage-livestock balance in the Xilin Gol steppe, China: implications for sustainably utilizing grassland-ecosystem services. Journal of Arid Land, 2021, 13(2): 135-151.
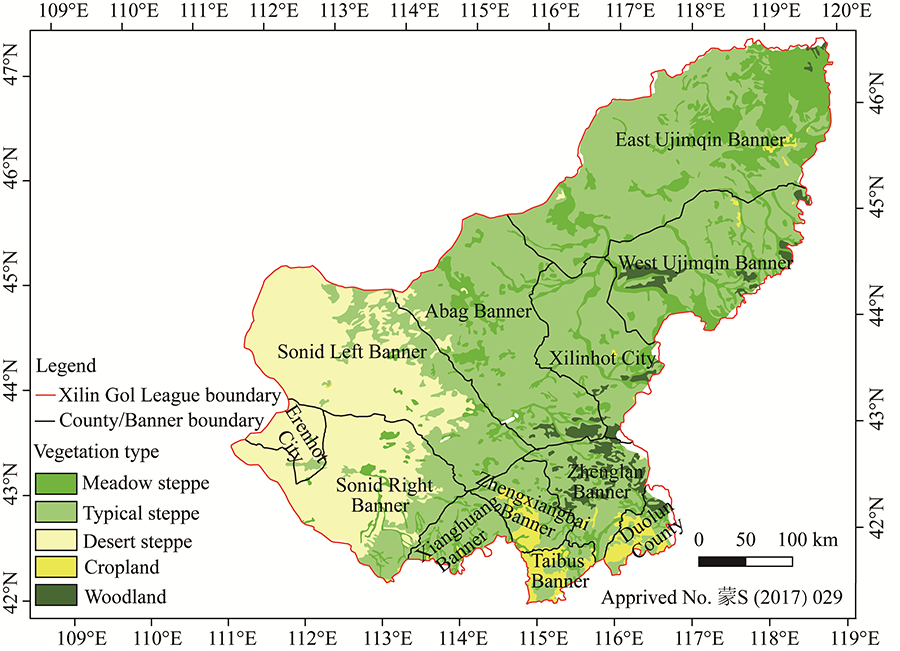
Fig. 1Vegetation types in the Xilin Gol League, China
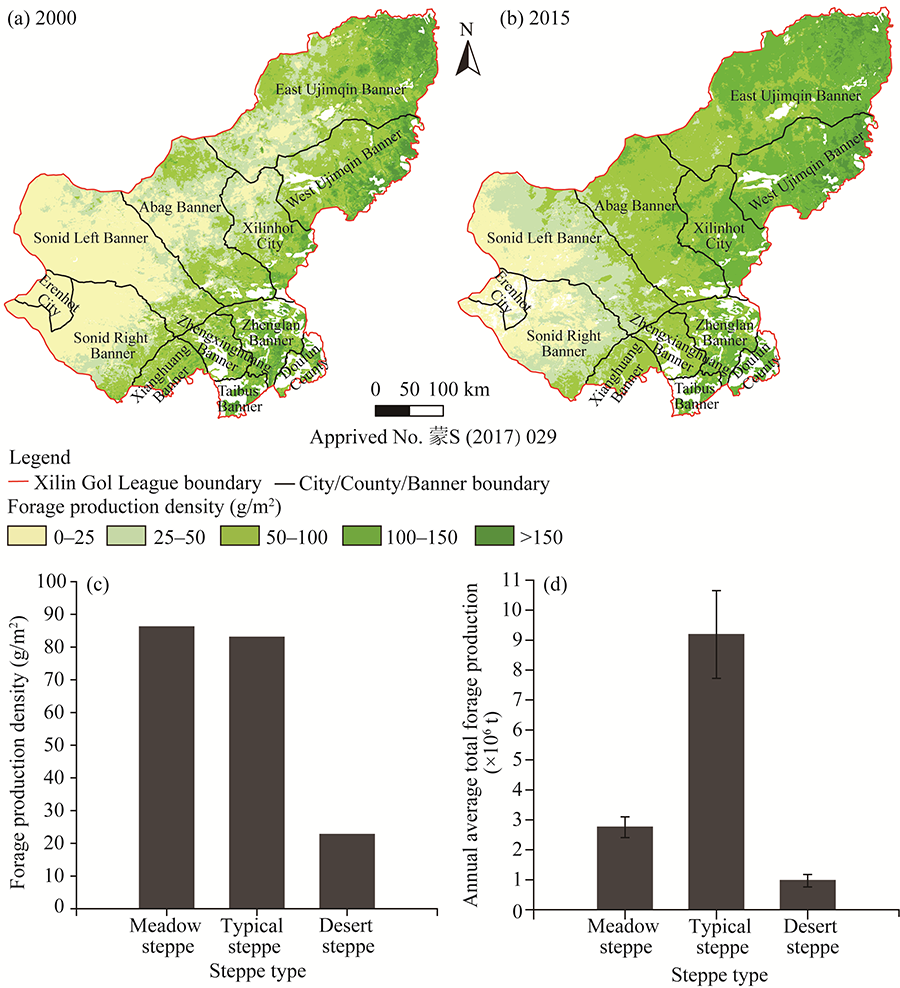
Fig. 2Spatial patterns of forage production density in the Xilin Gol League in 2005 (a) and 2015 (b) and forage production density (c) and annual average total forage production (d) of different steppe types. Bars mean standard errors.
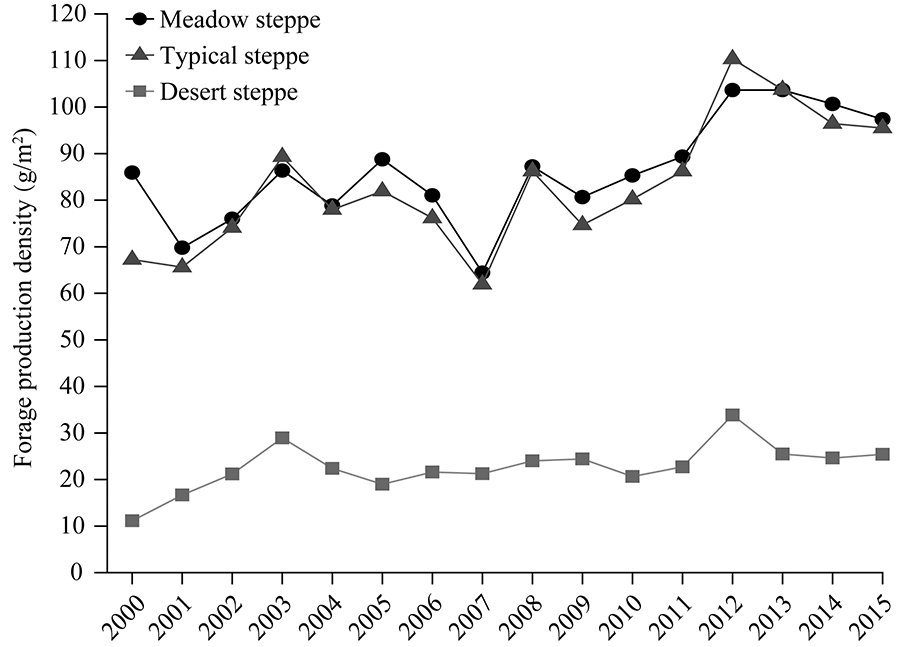
Fig. 3Variations in the forage production density of different steppe types from 2000 to 2015
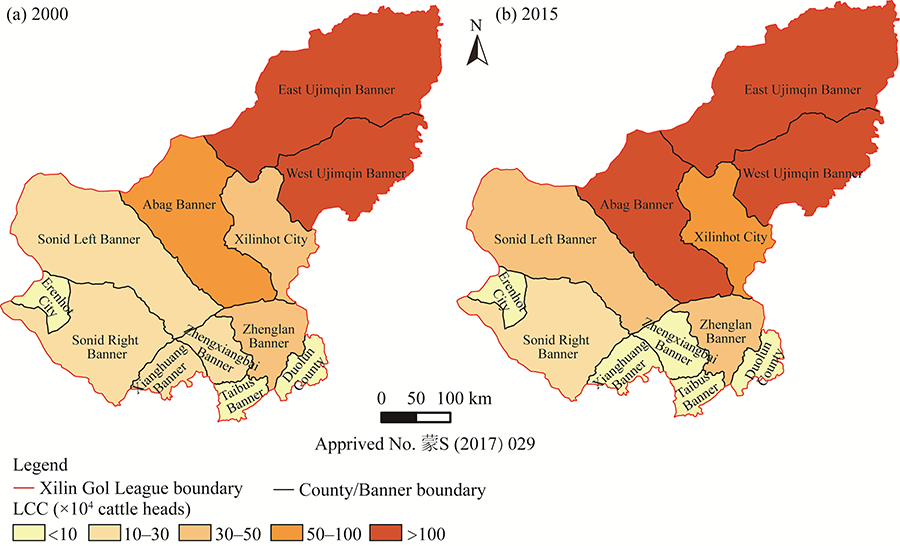
Fig. 4Spatial patterns of the livestock carrying capacity (LCC) in the Xilin Gol League in 2000 (a) and 2015 (b)
Year
Proper LCC (×106 cattle heads)
Actual livestock (×106 cattle heads)
Overgrazing rate (%)
2000
2.76
4.09
48.15
2001
2.61
3.34
28.03
2002
2.95
2.92
-0.82
2003
3.54
3.26
-8.12
2004
3.10
3.23
4.24
2005
3.26
3.15
-3.29
2006
3.06
3.15
3.14
2007
2.50
2.80
11.97
2008
3.41
2.93
-14.03
2009
3.03
2.94
-2.88
2010
3.19
2.94
-8.05
2011
3.42
2.83
-17.14
2012
4.33
2.95
-31.86
2013
4.07
3.20
-21.44
2014
3.73
4.08
9.55
2015
3.78
3.75
-0.66
Table 1 Forage-livestock balance dynamics from 2000 to 2015 in the Xilin Gol League
Fig. 5Overgrazing rate of different cities, counties and banners in the Xilin Gol League from 2000 to 2015. Overgrazing rate >0 means the actual carrying capacity is higher than the reasonable carrying capacity, and overgrazing rate <0 means actual carrying capacity is lower than the reasonable carrying capacity.
Town
Village
Proper LCC (cattle heads)
Actual livestock (cattle heads)
Overgrazing rate (%)
Baoshaodai Town
Halagaitu
1034
1791
73.21
Zhalute
1524
1271
-16.60
Chahannao
2114
1123
-46.88
Nairinao
2173
1959
-9.85
Nudugai
951
1320
38.80
Gaogesitai
1033
1649
59.63
Mandulatu
1985
2021
1.81
Dengji
1488
2073
39.31
Xiarinao
1568
2336
48.98
Herimutu
1257
1218
-3.10
Engeer
2124
1830
-13.84
Kuisuhe
1514
1690
11.62
Sumutuhe
456
1124
146.49
Bayinbaogeli
1161
1664
43.32
Zagstei Town
Bayinwulan
4820
4059
-15.79
Bayinnaoer
5332
4020
-24.61
Bayinhanggai
2979
4532
52.13
Bayinbaogela
1531
3049
99.15
Saihannaoer
7001
6304
-9.96
Hugejiletu
1215
1424
17.20
Xiretu
2958
2616
-11.56
Table 2 Overgrazing rate in 21 villages of the Zhenglan Banner
Study area
Study period
Steppe type
Forage production density (g/m2)
Reference
Inner Mongolia
2002-2005
Meadow steppe
196.70a (68.30-358.40)b
Ma et al. (2008)
Typical steppe
133.40a (17.00-310.10)b
Desert steppe
56.60a (9.50-175.10)b
Inner Mongolia
Scenario analysis and prediction 1981-1990
Forest steppe
204.00a
Niu (2001)
Typical steppe
150.00a
Desert steppe
63.00a
Inner Mongolia
1981-2010
Typical steppe
186.30a (Leymus chinensis steppe)
Han and Li (2012)
138.30a (Stipa grandis steppe)
Xilin Gol steppe
2005-2012
Temperate meadow-steppe
115.23a
Zhao et al. (2014)
Temperate steppe
69.10a
Temperate desert-steppe
27.23a
Xilin Gol steppe
2000-2015
Meadow steppe
86.18±10.95c
This study
Typical steppe
82.97±13.22c
Desert steppe
22.70±4.87c
Table 3 Comparison of the results of different studies
Fig. 6Correlation between overgrazing rate and forage production from 2000 to 2015
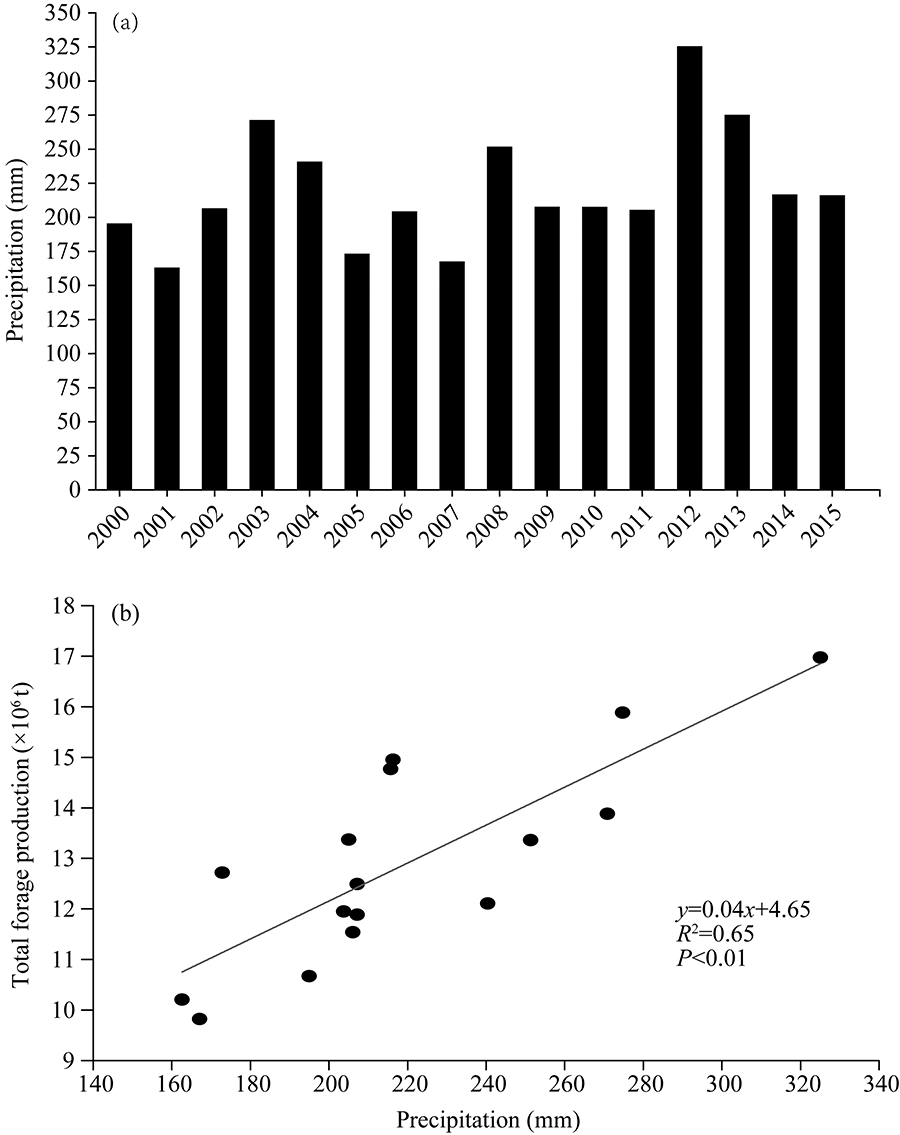
Fig. S1Changes in precipitation (a) from 2000 to 2015 and relationship between precipitation and total forage production (b) in the Xilin Gol steppe
Year
Forage production (×106 t)
Abag Banner
East Ujimqin Banner
Duolun County
Erenhot City
Sonid Right Banner
Sonid Left Banner
2000
1.17
3.36
0.20
0.03
0.50
0.68
2001
1.37
3.23
0.18
0.03
0.39
0.81
2002
1.66
3.57
0.19
0.05
0.48
1.01
2003
2.02
3.88
0.21
0.07
0.72
1.28
2004
1.52
3.59
0.22
0.06
0.64
0.99
2005
1.61
4.30
0.22
0.05
0.47
0.87
2006
1.58
3.53
0.23
0.05
0.56
0.98
2007
1.45
2.66
0.19
0.05
0.47
1.00
2008
1.89
4.20
0.23
0.06
0.58
1.09
2009
1.77
3.85
0.21
0.06
0.52
1.15
2010
1.65
4.15
0.21
0.05
0.52
0.95
2011
1.64
4.37
0.25
0.05
0.59
1.03
2012
2.66
5.09
0.24
0.08
0.79
1.55
2013
2.20
5.01
0.26
0.06
0.68
1.20
2014
1.99
5.01
0.25
0.06
0.58
1.13
2015
2.01
4.78
0.24
0.06
0.58
1.18
Year
Forage production (×106 t)
Taibus Banner
West Ujimqin Banner
Xilinhot City
Xianghuang Banner
Zhenglan Banner
Zhengxiangbai Banner
2000
0.21
1.99
0.82
0.41
0.82
0.38
2001
0.14
2.02
0.82
0.22
0.56
0.25
2002
0.16
2.00
1.03
0.29
0.61
0.28
2003
0.21
2.37
1.31
0.40
0.78
0.38
2004
0.20
2.07
1.09
0.38
0.77
0.38
2005
0.18
2.41
1.16
0.26
0.69
0.29
2006
0.20
2.13
1.07
0.33
0.75
0.35
2007
0.15
1.64
0.95
0.23
0.60
0.26
2008
0.20
2.34
1.21
0.30
0.71
0.31
2009
0.17
1.76
0.97
0.26
0.65
0.29
2010
0.17
2.27
1.19
0.25
0.60
0.26
2011
0.20
2.37
1.14
0.38
0.75
0.36
2012
0.21
2.88
1.60
0.38
0.80
0.39
2013
0.24
2.75
1.43
0.45
0.89
0.45
2014
0.21
2.65
1.34
0.29
0.80
0.37
2015
0.19
2.62
1.44
0.29
0.77
0.33
Table S1 Total annual forage production in the Xilin Gol League
[1]
Abbasi T, Abbasi S A. 2016. Reducing the global environmental impact of livestock production: the mini livestock option. Journal of Cleaner Production, 112(112):1754-1766.
[2]
Adler P B, Hall S A. 2005. The development of forage production and utilization gradients around livestock watering points. Landscape Ecology, 20(3):319-333.
[3]
Atsbha T, Desta A B, Zewdu T. 2019. Carbon sequestration potential of natural vegetation under grazing influence in Southern Tigray, Ethiopia: implication for climate change mitigation. Heliyon, 5(8), doi: 10.1016/j.heliyon.2019.e02329.
doi: 10.1016/j.heliyon.2019.e02264
pmid: 31517087
[4]
Batunacun, Nendel C, Hu Y F, et al. 2018. Land-use change and land degradation on the Mongolian Plateau from 1975 to 2015—A case study from Xilingol, China. Land Degradation & Development, 29(6):1595-1606.
[5]
Bryan B A, Gao L, Ye Y Q, et al. 2018. China's response to a national land-system sustainability emergency. Nature, 559(7713):193-204.
doi: 10.1038/s41586-018-0280-2
pmid: 29995865
[6]
Bureau of Statistics of Inner Mongolia Autonomous Region. 2000-2015. Inner Mongolia Statistical Yearbook. Beijing: China Statistics Press. (in Chinese)
[7]
Cao L G, Liu P X, Zhang K X, et al. 2011. Analysis on Response of Grasslands to Climate Change and Its Spatial Difference in Xilin Gol League. Arid Zone Research, 28(5):789-794. (in Chinese)
[8]
Chen Y. 2014. Research of the farmers' illegal grazing behavior under the grazing prohibition policy-A case of Yanchi county in Ningxia, China. Journal of Arid Land Resources and Environment, 28(10):31-36. (in Chinese)
[9]
Chi D K, Wang H, Li X B, et al. 2018. Assessing the effects of grazing on variations of vegetation NPP in the Xilingol Grassland, China, using a grazing pressure index. Ecological Indicators. 88:372-383.
[10]
Editorial Committee for Vegetation Map of China. 2007. Vegetation Atlas of China. Beijing: Geological Publishing House. (in Chinese)
[11]
Fang J Y, Liu G H, Xu S L. 1996. Carbon pool of terrestrial ecosystem in China. Beijing: China Environmental Science Press, 391-397. (in Chinese)
[12]
Galt D, Molinar F, Navarro J, et al. 2000. Grazing Capacity and Stocking Rate. Rangelands Archives, 22(6):7-11.
[13]
Gao T, Yang X C, Jin Y X, et al. 2013. Spatio-Temporal Variation in Vegetation Biomass and Its Relationships with Climate Factors in the Xilingol Grasslands, Northern China. PLoS ONE, 8(12), doi: 10.1371/journal.pone.0083824.
doi: 10.1371/journal.pone.0085737
pmid: 24392029
[14]
Guo B, Zang W Q, Yang F, et al. 2020. Spatial and temporal change patterns of net primary productivity and its response to climate change in the Qinghai-Tibet Plateau of China from 2000 to 2015. Journal of Arid Land, 12(1):1-17.
[15]
Han X G, Li L H. 2012. Mechanism of grassland ecosystem maintenance in Inner Mongolia. Beijing: China Agricultural University Press, 5-6. (in Chinese)
[16]
Hao L Z, Liu S J, Wu K X, et al. 2011. Study on the evaluation of grass nutrition and carrying capacity in alpine grassland of Kobresia hastily in Maduo County. Chinese Journal of Grassland, 33(1):84-89. (in Chinese)
[17]
Hao L, Sun G, Liu Y Q, et al. 2014. Effects of precipitation on grassland ecosystem restoration under grazing exclusion in Inner Mongolia, China. Landscape Ecology, 29(10):1657-1673.
[18]
Hao R F, Yu D Y, Liu Y P, et al. 2017. Impacts of changes in climate and landscape pattern on ecosystem services. Science of The Total Environment, 579:718-728.
[19]
Hobbs N T, Swift D M. 1985. Estimates of habitat carrying capacity incorporating explicit nutritional constraints. Journal of Wildlife Management, 49(3):814-822.
[20]
Hu Z M., Zhao Z, Zhang Y, et al. 2019. Does 'Forage-Livestock Balance' policy impact ecological efficiency of grasslands in China? Journal of Cleaner Production, 207:343-349.
[21]
Huang W, Bruemmer B, Huntsinger L. 2017. Technical efficiency and the impact of grassland use right leasing on livestock grazing on the Qinghai-Tibetan Plateau. Land Use Policy, 64(64):342-352.
[22]
Jia X Q, Fu B J, Feng X M, et al. 2014. The tradeoff and synergy between ecosystem services in the Grain-for-Green areas in Northern Shaanxi, China. Ecological Indicators, 43(1):103-113.
[23]
Jin Y X, Xu B, Yang X C, et al. 2011. Remote Sensing Dynamic Estimation of Grass Production in Xilinguole, Inner Mongolia. Scientia Sinica (Vitae), 41(12):1185-1195. (in Chinese)
[24]
Kemp D, Han G D, Hou X Y, et al. 2013. Innovative grassland management systems for environmental and livelihood benefits. Proceedings of the National Academy of Sciences of the United States of America, 110(21):8369-8374.
[25]
Li A, Wu J G, Huang J H. 2012. Distinguishing between human-induced and climate-driven vegetation changes: a critical application of RESTREND in Inner Mongolia. Landscape Ecology, 27(7):969-982.
[26]
Li A, Wu J G, Zhang X Y, et al. 2018. China's new rural "separating three property rights" land reform results in grassland degradation: Evidence from Inner Mongolia. Land Use Policy, 71:170-182.
[27]
Li G, Wang D L, Xin, X P, et al. 2009. Analysis of grassland carrying capacity and grassland livestock balance in Xilinhot City. Pratacultural Science, 26(1):87-93. (in Chinese)
[28]
Li W J, Ali S H, Zhang Q. 2007. Property rights and grassland degradation: A study of the Xilingol Pasture, Inner Mongolia, China. Journal of Environmental Management, 85(2):461-470.
doi: 10.1016/j.jenvman.2006.10.010
pmid: 17129663
[29]
Liu H J, Yin S Y, Sun C, et al. 2015. Temporal and spatial variation of net primary productivity (NPP) and its responses with climatic changes in the Xilingol grassland from 2000 to 2010. Pratacultural Science, 32(11):1709-1720. (in Chinese)
[30]
Ma W H, Yang Y H, He J S, et al. 2008. Above- and belowground biomass in relation to environmental factors in temperate grasslands, Inner Mongolia. Science China C: Life Sciences, 51(3):263-270.
[31]
Ministry of Agriculture of the People's Republic of China. 2015. Calculation of Rangeland Carrying Capacity (NY/T635-2015). [S/OL]. [2019-07-18]. https://www.lddoc.cn/p-106633.html.
[32]
Ni J. 2002. Carbon storage in grasslands of China. Journal of Arid Environments, 50(2):205-218.
[33]
Niu J M. 2001. Impacts Prediction of Climatic Change on Distribution and Production of Grassland in Inner Mongolia. Acta Agrestia Sinica, 9(4):277-282. (in Chinese)
[34]
OECD-FAO (Organisation for Economic Cooperation and Development-Food and Agriculture Organization). 2011. OECD-FAO Agricultural Outlook 2011. [2020-08-01]. https://www.oecd-ilibrary.org/.
[35]
Onatibia G R, Aguiar M R. 2019. Grasses and grazers in arid rangelands: Impact of sheep management on forage and non-forage grass populations. Journal of Environmental Management, 235:42-50.
doi: 10.1016/j.jenvman.2019.01.037
pmid: 30669092
[36]
Piao S L, Fang J Y, He J S, et al. 2004. Spatial distribution of grassland biomass in China. Chinese Journal of Plant Ecology, 28(4):491-498. (in Chinese)
[37]
Ren H R, Shang Y J, Zhang S. 2020. Measuring the spatiotemporal variations of vegetation net primary productivity in Inner Mongolia using spatial autocorrelation. Ecological Indicators, 112:106108, doi: 10.1016/j.ecolind.2020.106108.
[38]
Running S W, Nemani R R, Heinsch F A, et al. 2004. A continuous satellite-derived measure of global terrestrial primary production. BioScience, 54(6):547-560.
[39]
Running S W, Mu Q Z, Zhao M S. 2015. MOD17A3 MODIS/Terra Gross Primary Productivity Yearly L4 Global 1km SIN Grid. NASA EOSDIS Land Processes DAAC. [2019-04-17]. https://lpdaac.usgs.gov/products/mod17a3hgfv006/.
[40]
Running S W, Zhao M S. . User's Guide: Daily GPP and Annual NPP (MOD17A2/A3) Products. NASA Earth Observing System MODIS Land Algorithm.[2020-04-23]. http://www.ntsg.umt.edu/files/modis/MOD17UsersGuide2015_v3.pdf
[41]
Shao H Y, Sun X F, Wang H X, et al. 2016. A method to the impact assessment of the returning grazing land to grassland project on regional eco-environmental vulnerability. Environmental Impact Assessment Review, 56:155-167.
[42]
Tilman D, Reich P B, Knops J M H, et al. 2001. Diversity and productivity in a long-term grassland experiment. Science, 294(5543):843-845.
[43]
Tong C, Wu J G, Yong S, et al. 2004. A landscape-scale assessment of steppe degradation in the Xilin River Basin, Inner Mongolia, China. Journal of Arid Environments, 59(1):133-149.
[44]
White R P, Murray S, Rohweder M, et al. 2000. Pilot analysis of global ecosystems: grassland ecosystems. Washington D.C.: World Resources Institute.
[45]
Xu B, Yang X C. 2009. Calculation of grass production and balance of livestock carrying capacity in rangeland region of Northeast China. Geographical Research, 28(2):402-408. (in Chinese)
[46]
Xu M Y. 2014. A review of grassland carrying capacity: perspective and dilemma for research in China on "forage-livestock balance". Acta Prataculturae Sinica, 23(5):321-329. (in Chinese)
[47]
Yu M, Ellis J E, Epstein H E. 2004. Regional analysis of climate, primary production, and livestock density in inner Mongolia. Journal of Environmental Quality, 33(5):1675-1681.
doi: 10.2134/jeq2004.1675
pmid: 15356227
[48]
Zhang J P, Zhang L B, Liu W L, et al. 2014. Livestock-carrying capacity and overgrazing status of alpine grassland in the Three-River Headwaters region, China. Journal of Geographical Sciences, 24(2):303-312.
[49]
Zhao F, Xu B, Yang X C, et al. 2014. Remote sensing estimates of grassland aboveground biomass based on MODIS net primary productivity (NPP): A case study in the Xilingol grassland of Northern China. Remote Sensing, 6:5368-5386.
[50]
Zhao M S, Running S W. 2010. Drought-induced reduction in global terrestrial net primary production from 2000 through 2009. Science, 329(5994):940-943.
doi: 10.1126/science.1192666
pmid: 20724633
[51]
Zhao Y Y, He C Y, Zhang Q F. 2012. Monitoring vegetation dynamics by coupling linear trend analysis with change vector analysis: a case study in the Xilingol steppe in northern China. International Journal of Remote Sensing, 33(1):287-308.
[52]
Zhao Y Y, Wu J G, He C Y, et al. 2017. Linking wind erosion to ecosystem services in drylands: a landscape ecological approach. Landscape Ecology, 32(12):2399-2417.
[53]
Zhao Y Y, Xin Z B, Ding G D. 2018. Spatiotemporal variation in the occurrence of sand-dust events and its influencing factors in the Beijing-Tianjin Sand Source Region, China, 1982-2013. Regional Environmental Change, 18(8):2433-2444.
[54]
Zhao Y Y, Liu Z F, Wu J G. 2020. Grassland ecosystem services: a systematic review of research advances and future directions. Landscape Ecology, 35(4):793-814.
[55]
Zhen L, Li F, Yan H M, et al. 2014. Herders' willingness to accept versus the public sector's willingness to pay for grassland restoration in the Xilingol League of Inner Mongolia, China. Environmental Research Letters, 9(4):045003, doi: 10.1088/1748-9326/9/4/045003.