| Research article |
|


|
|
|
| Impact of utility-scale solar photovoltaic array on the aeolian sediment transport in Hobq Desert, China |
TANG Guodong, MENG Zhongju, GAO Yong*( ), DANG Xiaohong ), DANG Xiaohong |
| College of Desert Control Science and Engineering, Inner Mongolia Agricultural University, Hohhot 010018, China |
|
|
|
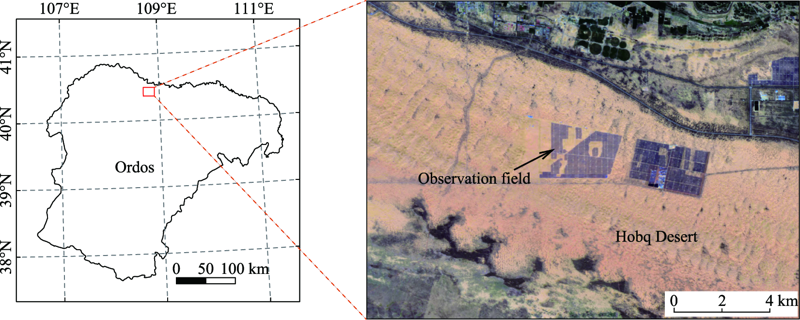
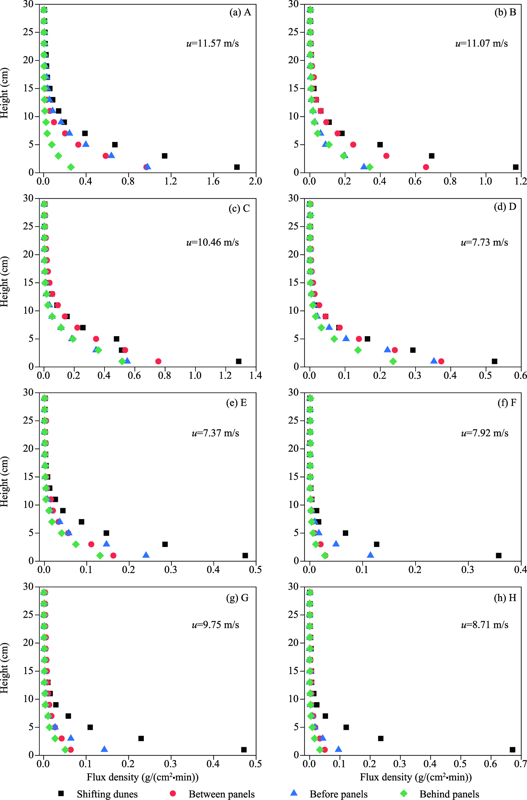
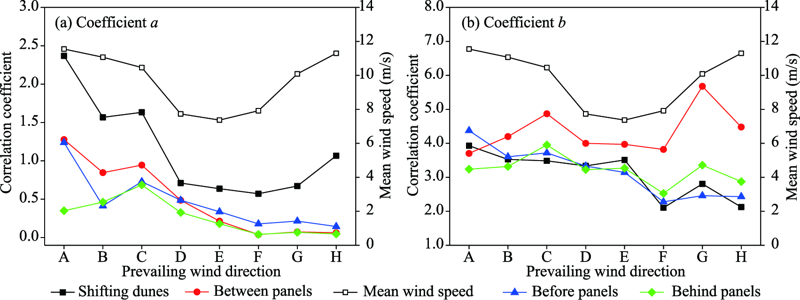
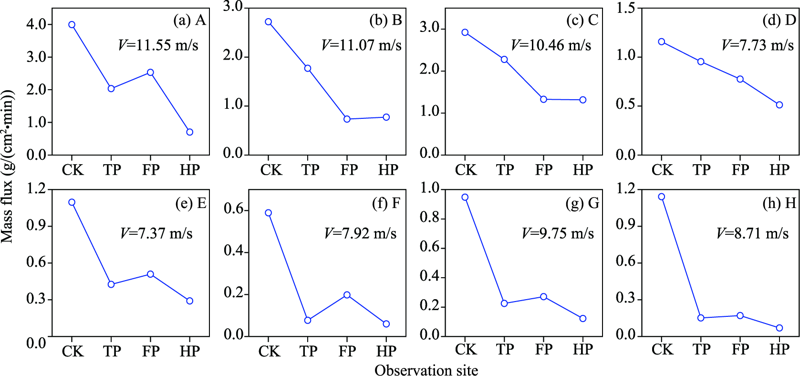
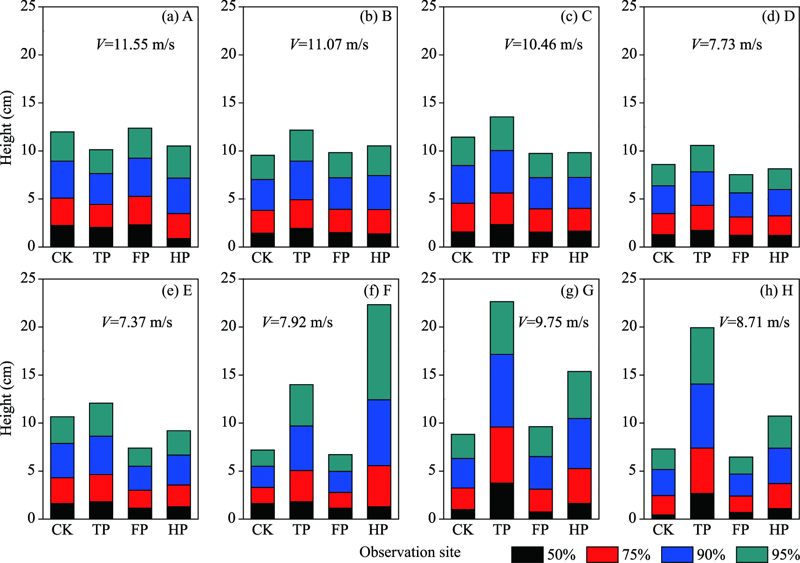
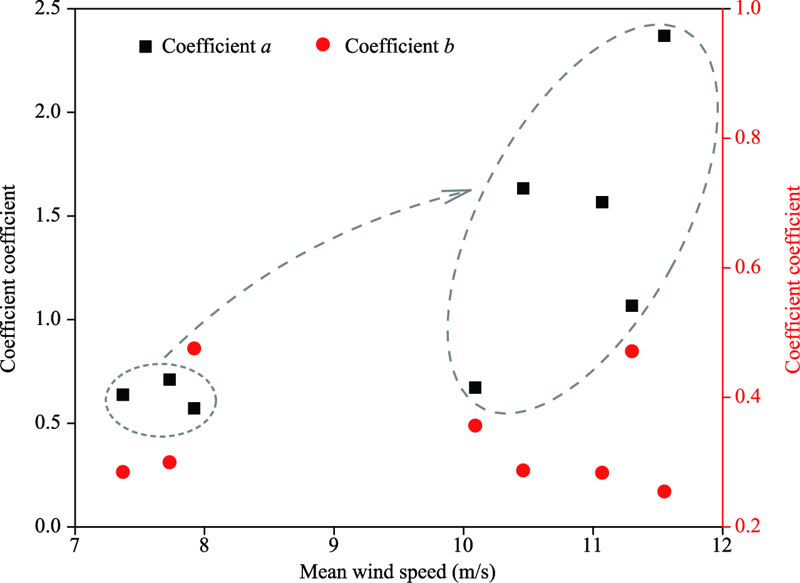
Abstract Deserts are ideal places to develop ground-mounted large-scale solar photovoltaic (PV) power station. Unfortunately, solar energy production, operation, and maintenance are affected by geomorphological changes caused by surface erosion that may occur after the construction of the solar PV power station. In order to avoid damage to a solar PV power station in sandy areas, it is necessary to investigate the characteristics of wind-sand movement under the interference of solar PV array. The study was undertaken by measuring sediment transport of different wind directions above shifting dunes and three observation sites around the PV panels in the Hobq Desert, China. The results showed that the two-parameter exponential function provides better fit for the measured flux density profiles to the near-surface of solar PV array. However, the saltation height of sand particles changes with the intersection angle between the solar PV array and wind direction exceed 45°. The sediment transport rate above shifting dunes was always the greatest, while that around the test PV panels varied accordingly to the wind direction. Moreover, the aeolian sediment transport on the solar PV array was significantly affected by wind direction. The value of sand inhibition rate ranged from 35.46% to 88.51% at different wind directions. When the intersection angle exceeds 45°, the mean value of sediment transport rate above the solar PV array reduces to 82.58% compared with the shifting dunes. The results of our study expand our understanding of the formation and evolution of aeolian geomorphology at the solar PV footprint. This will facilitate the design and control engineering plans for solar PV array in sandy areas that operate according to the wind regime.
|
|
Received: 17 August 2020
Published: 10 March 2021
|
|
Corresponding Authors:
|
About author: * GAO Yong (E-mail: 13948815709@163.com)
First author contact:TANG Guodong and MENG Zhongju contributed equally to this work. |
|
|
| [1] |
Adinoyi M J, Said S A M. 2013. Effect of dust accumulation on the power outputs of solar photovoltaic modules. Renewable Energy, 60:633-636.
|
|
|
| [2] |
Al-hasan A, Ghoneim A. 2005. A new correlation between photovoltaic panel's efficiency and amount of sand dust accumulated on their surface. International Journal of Sustainable Energy, 24(4):187-197.
|
|
|
| [3] |
Appels R, Lefevre B, Herteleer B, et al. 2013. Effect of soiling on photovoltaic modules. Solar Energy, 96:283-291.
|
|
|
| [4] |
Bechtel National, Inc. 1980. Wind design of flat panel photovoltaic array structures. Sand 79-7057. Springfield: National Technical Information Service, U S Department of Commerce.
|
|
|
| [5] |
Boyle L, flinchpaugh H, Hannigan M P. 2015. Natural soiling of photovoltaic cover plates and the impact on transmission. Renewable Energy, 77:166-173.
|
|
|
| [6] |
Cabanillas R E, Munguia H. 2011. Dust accumulation effect on efficiency of Si photovoltaic modules. Journal of Renewable and Sustainable Energy, 3(4), doi: 10.1063/1.3622609.
|
|
|
| [7] |
Dong Z, Liu X, Wang H, et al. 2002. The flux profile of a blowing sand cloud: a wind tunnel investigation. Geomorphology, 49(3-4):219-230.
|
|
|
| [8] |
Dong Z, Lu J, Man D, et al. 2011. Equations for the near-surface mass flux density profile of wind-blown sediments. Earth Surface Processes and Landforms, 36(10):1292-1299.
|
|
|
| [9] |
Dong Z, Lü P, Zhang Z, et al. 2012. Aeolian transport in the field: A comparison of the effects of different surface treatments. Journal of Geophysical Research: Atmospheres, 117(D9). doi: 10.1029/2012JD017538.
|
|
|
| [10] |
Ellis J T, Li B, Farrell E J, et al. 2009. Protocols for characterizing aeolian mass-flux profiles. Aeolian Research, 1(1-2):19-26.
|
|
|
| [11] |
Elminir H K, Ghitas A E, Hamid R H, et al. 2006. Effect of dust on the transparent cover of solar collectors. Energy Conversion and Management, 47(18-19):3192-3203.
|
|
|
| [12] |
Etyemezian V, Nikolich G, Gillies J A. 2017. Mean flow through utility scale solar facilities and preliminary insights on dust impacts. Journal of Wind Engineering and Industrial Aerodynamics, 162:45-56.
|
|
|
| [13] |
Garcia E T, Ogueta-Gutierrez M, Avila S, et al. 2014. On the effects of windbreaks on the aerodynamic loads over parabolic solar troughs. Applied Energy, 115:293-300.
|
|
|
| [14] |
Guo C, Han Z, Li A, et al. 2018. Dynamic mechanism research on the secondary blown sand disaster in the 110-MW photovoltaic arrays of the Hobq Desert. Journal of Desert Research, 38:225-232.
|
|
|
| [15] |
Houser C A, Nickling W G. 2001. The emission and vertical flux of particulate matter <10 mm from a disturbed clay-crusted surface. Sedimentology, 48(2):255-267.
|
|
|
| [16] |
Huang B, Li Z, Zhao Z, et al. 2018. Near-ground impurity-free wind and wind-driven sand of photovoltaic power stations in a desert area. Journal of Wind Engineering and Industrial Aerodynamics, 179:483-502.
|
|
|
| [17] |
Jackson P S, Hunt J C R. 1975. Turbulent wind flow over a low hill. Quarterly Journal of the Royal Meteorological Society, 101(430):929-955.
|
|
|
| [18] |
Jubayer C M, Hangan H. 2014. Numerical simulation of wind effects on a stand-alone ground mounted photovoltaic (PV) system. Journal of Wind Engineering and Industrial Aerodynamics, 134:56-64.
|
|
|
| [19] |
Jubayer C M, Hangan H. 2016. A numerical approach to the investigation of wind loading on an array of ground mounted solar photovoltaic (PV) panels. Journal of Wind Engineering and Industrial Aerodynamics, 153:60-70.
|
|
|
| [20] |
Kopp G A, Farquhar S, Morrison M J. 2012. Aerodynamic mechanisms for wind loads on tilted, roof-mounted, solar arrays. Journal of Wind Engineering and Industrial Aerodynamics, 111, 40-52.
|
|
|
| [21] |
Kopp G A, Surry D. 2002. Wind loads on a solar array. Wind and Structures, 5(5), 393-406.
|
|
|
| [22] |
Li K, He F. 2010. Analysis on mainland China's solar energy distribution and potential to utilize solar energy as an alternative energy source. Progress in Geography, 29:1049-1054.
|
|
|
| [23] |
Li S, Li C, Yao D, et al. 2020. Feasibility of microbially induced carbonate precipitation and straw checkerboard barriers on desertification control and ecological restoration. Ecological Engineering, 105883, doi: 10.1016/j.ecoleng.2020.105883.
|
|
|
| [24] |
Li X R, Xiao H L, He M Z, et al. 2006. Sand barriers of straw checkerboards for habitat restoration in extremely arid desert regions. Ecological Engineering, 28(2):149-157.
|
|
|
| [25] |
Lü P, Dong Z, Ma X. 2016. Aeolian sand transport above three desert surfaces in northern China with different characteristics (shifting sand, straw checkerboard, and gravel): field observations. Environmental Earth Sciences, 577, doi: 10.1007/s12665-016-5361-7.
|
|
|
| [26] |
Macpherson T, Nickling W G, Gillies J A, et al. 2008. Dust emissions from undisturbed and disturbed supply-limited desert surfaces. Journal of Geophysical Research, 113(F2), doi: 10.1029/2007JF000800.
|
|
|
| [27] |
Mani M, Pillai R. 2010. Impact of dust on solar photovoltaic (PV) performance: Research status, challenges and recommendations. Renewable and Sustainable Energy Reviews, 14(9):3124-3131.
|
|
|
| [28] |
Mertia R S, Santra P, Kandpal B K, et al. 2010. Mass-height profile and total mass transport of wind eroded aeolian sediments from rangelands of the Indian Thar Desert. Aeolian Research, 2(2-3):135-142.
|
|
|
| [29] |
Nahar N M, Gupta J P. 1990. Effect of dust on transmittance of glazing materials for solar collectors under arid zone conditions of India. Solar & Wind Technology, 7(2-3):237-243.
|
|
|
| [30] |
Namikas S L. 2003. field measurement and numerical modelling of aeolian mass flux distributions on a sandy beach. Sedimentology, 50(2):303-326.
|
|
|
| [31] |
Ni J R, Li Z S, Mendoza C. 2002. Vertical profiles of aeolian sand mass flux. Geomorphology, 49(3-4):205-218.
|
|
|
| [32] |
Said S A M. 1990. Effects of dust accumulation on performances of thermal and photovoltaic flat-plate collectors. Applied Energy, 37(1):73-84.
|
|
|
| [33] |
Schellenberg A, Maffei J, Telleen K, et al. 2013. Structural analysis and application of wind loads to solar arrays. Journal of Wind Engineering and Industrial Aerodynamics, 123:261-272.
|
|
|
| [34] |
Shademan M, Barron R M, Balachandar R, et al. 2014. Numerical simulation of wind loading on ground-mounted solar panels at different flow configurations. Canadian Journal of Civil Engineering, 41(8):728-738.
|
|
|
| [35] |
Shen Y, Wang X, Cong R, et al. 2013. Eco-geographical zoning of deserts and gobi in China. Journal of Arid Land Resources and Environment, 27(1):1-13.
|
|
|
| [36] |
Warsido W P, Bitsuamlak G T, Barata J, et al. 2014. Influence of spacing parameters on the wind loading of solar array. Journal of fluids and Structures, 48:295-315.
|
|
|
| [37] |
Zhang C, Li Q, Zhou N, et al. 2016. field observations of wind profiles and sand fluxes above the windward slope of a sand dune before and after the establishment of semi-buried straw checkerboard barriers. Aeolian Research, 20:59-70.
|
|
|
| [38] |
Zhang Z, Dong Z. 2013. field Observation of Aeolian Sediment flux in the Southeast Tengger Desert. Journal of Desert Rresearch, 23(4):973-980.
|
|
|
| [39] |
Zhang Z, Dong Z. 2014. Characteristics of aeolian sediment transport over different land surfaces in northern China. Soil and Tillage Research, 143:106-115.
|
|
|
| [40] |
Zhang Z, Dong Z, Li C. 2015. Wind regime and sand transport in China's Badain Jaran Desert. Aeolian Research, 17:1-13.
|
|
|
| [41] |
Zhang Z, Dong Z, Wu G. 2017. field observations of sand transport over the crest of a transverse dune in northwestern China Tengger Desert. Soil and Tillage Research, 166:67-75.
|
|
|
| [42] |
Zingg A W. 1953. Some characteristics of aeolian sand movement by saltation process. Edition du Centre National de la Recherche Scientifique, 7:197-208.
|
|
|
| [43] |
Zorrilla-Casanova J, Piliougine M, Carretero J, et al. 2013. Losses produced by soiling in the incoming radiation to photovoltaic modules. Progress in Photovoltaics, 21(4):790-796.
|
|
|
|
Viewed |
|
|
|
Full text
|
|
|
|
|
Abstract
|
|
|
|
|
Cited |
|
|
|
|
| |
Shared |
|
|
|
|
| |
Discussed |
|
|
|
|