| Research article |
|


|
|
|
| Optimization designs of artificial facilities in deserts based on computational simulation |
DUN Hongchao, HUANG Ning*( ), ZHANG Jie*() ), ZHANG Jie*() |
| Key Laboratory of Mechanics on Disaster and Environment in Western China, Lanzhou University, Lanzhou 730000, China |
|
|
|
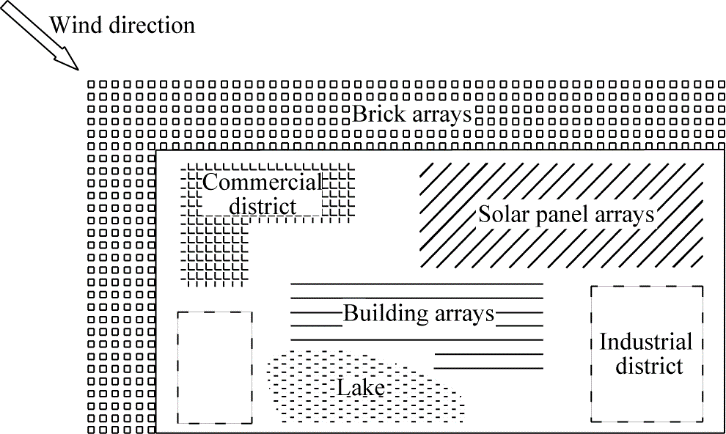
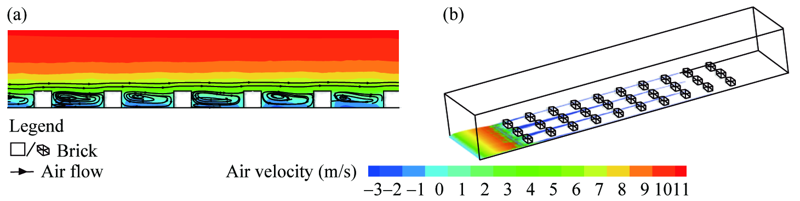
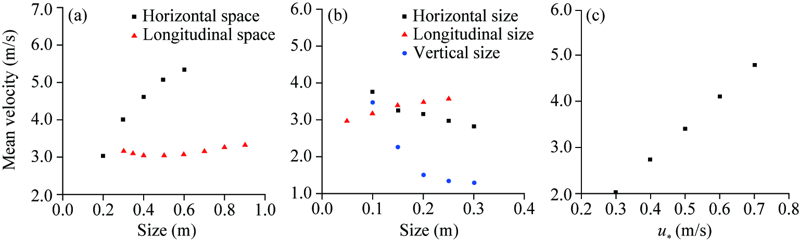
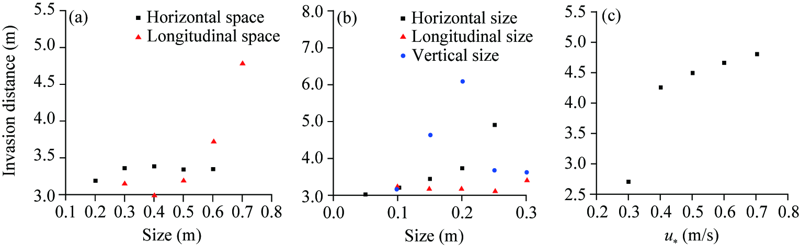
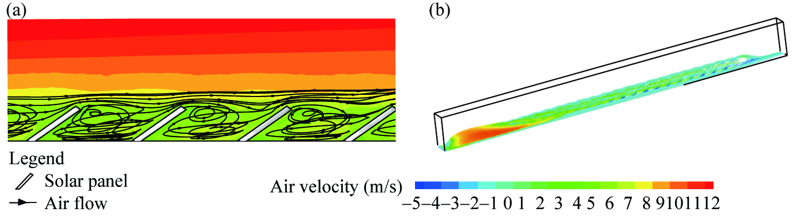
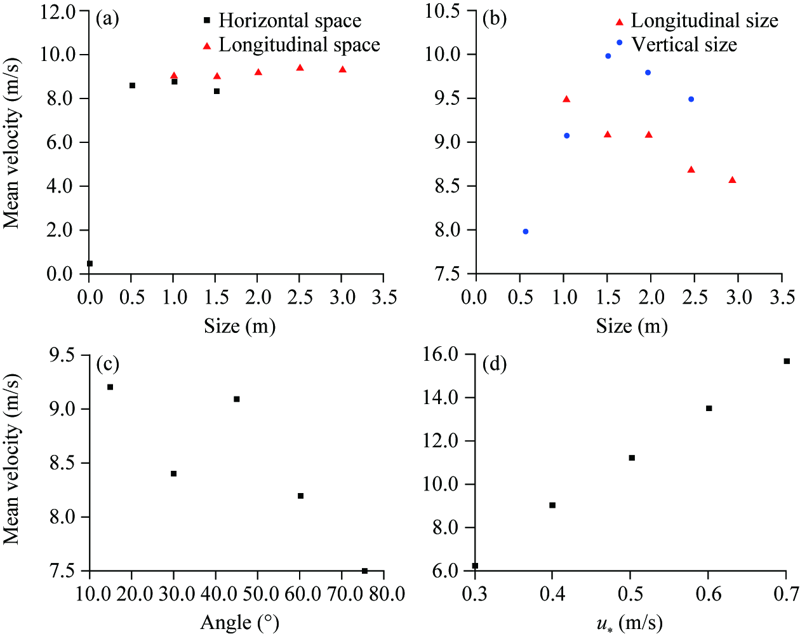
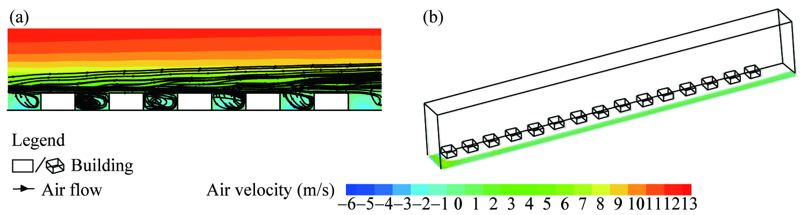
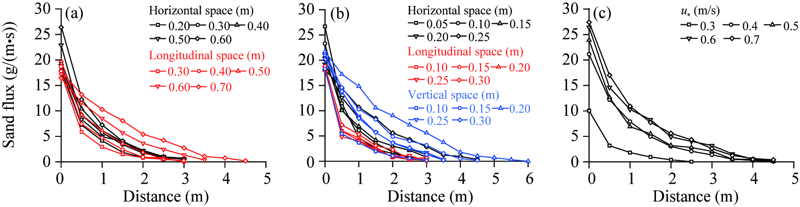
Abstract Sediment transport of sand particles by wind is one of the main processes leading to desertification in arid regions, which severely impairs the ability of mankind to produce and live by drifting sand into settlements. Optimization designs of artificial facilities have lately attracted extensive interest for human settlement systems in deserts because of their acceptable protection effect, convenience of implementation, and low material cost. However, the complexity of a settlement system poses challenges concerning finding suitable materials, artificial facilities, and optimization designs for sand deposition protection. In an effort to overcome these challenges, we propose a settlement system built with brick, solar panel, and building arrays to meet the basic needs of human settlements in arid regions while preventing wind-sand disasters. The wind flow and movement characteristics of sand particles in the brick, panel, and building arrays were calculated using computational fluid dynamics and discrete phase model. The performance of three types of arrays in wind-sand flow in terms of decreasing the wind velocity and sand-particle invasion distance was evaluated. The results show that the wind velocity near the surface and the sand invasion distance were significantly decreased in the space between the brick arrays through properly selected vertical size and interspaces, indicating that the brick arrays have an impressive sand fixing and blocking performance; their effective protection distance was 3-4 m. The building arrays increased the near-surface wind velocity among buildings, resulting in less deposition of sand particles. The solar panel arrays were similar to the building arrays in most cases, but the deposition of sand particles on solar panels exerted a negative effect on energy utilization efficiency. Therefore, taking the optimal configuration of the settlement system into consideration, this study concludes that (1) brick arrays, which were proven effective in preventing sand particles, must be arranged in an upwind area; (2) solar panel arrays could accelerate the wind flow, so they are best to be arranged at the place where sand particles deposited easily; and (3) building arrays present a better arrangement in downwind areas.
|
|
Received: 29 October 2020
Published: 10 March 2021
|
|
Corresponding Authors:
|
About author: * HUANG Ning (huangn@lzu.edu.cn);
|
|
|
| [1] |
Batchelor G K. 2000. An Introduction to Fluid Dynamics. Cambridge: Cambridge University Press, 241.
|
|
|
| [2] |
Behrouzi F, Sidik N A C, Malik A M A, et al. 2014. Prediction of wind flow around high-rise buildings using RANS models. Applied Mechanics and Materials, 554:724-729.
|
|
|
| [3] |
Bitog J P, Lee I B, Shin M H, et al. 2009. Numerical simulation of an array of fences in Saemangeum reclaimed land. Atmospheric Environment, 43(30):4612-4621.
|
|
|
| [4] |
Blocken B. 2014. 50 years of computational wind engineering: past, present and future. Journal of Wind Engineering and Industrial Aerodynamics, 129:69-102.
|
|
|
| [5] |
Bo T L, Ma P, Zheng X J. 2015. Numerical study on the effect of semi-buried straw checkerboard sand barriers belt on the wind speed. Aeolian Research, 16:101-107.
|
|
|
| [6] |
Chen G H, Wang W W, Sun C F, et al. 2012. 3D numerical simulation of wind flow behind a new porous fence. Powder Technology, 230:118-126.
|
|
|
| [7] |
Chiu P H, Raghavan V S G, Poh H J, et al. 2017. CFD methodology development for Singapore green mark building application. Procedia Engineering, 180:1596-1602.
|
|
|
| [8] |
Christo F C. 2012. Numerical modelling of wind and dust patterns around a full-scale paraboloidal solar dish. Renewable Energy, 39(1):356-366.
|
|
|
| [9] |
Christopherson R W, Byrne M L, Aitken A E. 2002. Geosystems: An Introduction to Physical Geography. Upper Saddle River: Prentice Hall, 52.
|
|
|
| [10] |
Darwish Z A, Kazem H A, Sopian K, et al. 2015. Effect of dust pollutant type on photovoltaic performance. Renewable and Sustainable Energy Reviews, 41:735-744.
|
|
|
| [11] |
Dun H C, Huang N, Zhang J, et al. 2018. Effects of shape and rotation of sand particles in saltation. Journal of Geophysical Research: Atmospheres, 123(23): 13,462-13,471.
|
|
|
| [12] |
Golany G. 1978. Urban Planning for Arid Zones: American Experiences and Directions. New York: John Wiley & Sons, Inc., 142-146.
|
|
|
| [13] |
Hatanaka K, Hotta S. 1997. Finite element analysis of air flow around permeable sand fences. International Journal for Numerical Methods in Fluids, 24:1291-1306.
|
|
|
| [14] |
Huang N, Zheng X J, Zhou Y H, et al. 2006. Simulation of wind-blown sand movement and probability density function of liftoff velocities of sand particles. Journal of Geophysical Research: Atmospheres, 111:D20201, doi: 10.1029/2005JD006559.
|
|
|
| [15] |
Huang N, Xia X P, Tong D. 2013. Numerical simulation of wind sand movement in straw checkerboard barriers. The European Physical Journal E, 36:99, doi: 10.1140/epje/i2013-13099-6.
|
|
|
| [16] |
Huang N, Gong K, Xu B, et al. 2019. Investigations into the law of sand particle accumulation over railway subgrade with wind-break wall. The European Physical Journal E, 42:145, doi: 10.1140/epje/i2019-11910-0.
|
|
|
| [17] |
Hunter L J, Watson I D, Johson G T. 1990. Modeling air flow regimes in urban canyons. Energy Build, 15:315-324.
|
|
|
| [18] |
Jiang H, Dun H C, Tong D, et al. 2017. Sand transportation and reverse patterns over leeward face of sand dune. Geomorphology, 283:41-47.
|
|
|
| [19] |
Kanda M, Moriwaki R, Kasamatsu F. 2004. Large-eddy simulation of turbulent organized structures within and above explicitly resolved cube arrays. Boundary-Layer Meteorology, 112:343-368.
|
|
|
| [20] |
Kazem A A, Chaichan M T, Kazem H A. 2014. Effect of dust on photovoltaic utilization in Iraq: review article. Renewable and Sustainable Energy Reviews, 37:734-749.
|
|
|
| [21] |
Lee S J, Lim H C. 2001. A numerical study on flow around a triangular prism located behind a porous fence. Fluid Dynamics Research, 28:209-221.
|
|
|
| [22] |
Lien F S, Yee E, Cheng Y. 2004. Simulation of mean flow and turbulence over a 2D building array using high-resolution CFD and a distributed drag force approach. Journal of Wind Engineering and Industrial Aerodynamics, 92(2):117-158.
|
|
|
| [23] |
Liu H J, Wang J H, Li Y, et al. 2011. Effects of plastic checkerboard sand-barrier on wind-sand flux of leeward of crescentic dune. Journal of Soil and Water Conservation, 25(5):26-29, 34. (in Chinese)
|
|
|
| [24] |
Mani M, Pillai R. 2010. Impact of dust on solar photovoltaic (PV) performance: research status, challenges and recommendations. Renewable and Sustainable Energy Reviews, 14:3124-3131.
|
|
|
| [25] |
Mohamed A M I, Khalaf F I. 2005. Development of computer software for the calculation of the rate of aeolian sand transport. Port-Said Engineering Research Journal, 9:251-266.
|
|
|
| [26] |
Montazeri H, Blocken B. 2013. CFD simulation of wind-induced pressure coefficients on buildings with and without balconies: validation and sensitivity analysis. Building and Environment, 60:137-149.
|
|
|
| [27] |
Pye K, Tsoar H. 2009. Aeolian Sand and Sand Dunes. Berlin: Springer Berlin Heidelberg, 329-367, https://link.springer.com/book/10.1007%2F978-3-540-85910-9.
|
|
|
| [28] |
Ramponi R, Blocken B. 2012. CFD simulation of cross-ventilation for a generic isolated building: impact of computational parameters. Building and Environment, 53:34-48.
|
|
|
| [29] |
Raupach M R, Thom A S, Edwards I. 1980. A wind-tunnel study of turbulent flow close to regularly arrayed rough surfaces. Boundary-Layer Meteorology, 18:373-397.
|
|
|
| [30] |
Raupach M R, Lu H. 2004. Representation of land-surface processes in aeolian transport models. Environmental Modelling & Software, 19(2):93-112.
|
|
|
| [31] |
Sun T, Liu H J, Zhu G Q, et al. 2012. Timeliness of reducing wind and stabilizing sand functions of three mechanical sand barriers in arid region. Journal of Soil and Water Conservation, 26(4):12-16, 22. (in Chinese)
|
|
|
| [32] |
Tian L H, Wu W Y, Zhang D S, et al. 2015. Characteristics of erosion and deposition of straw checkerboard barriers in alpine sandy land. Environmental Earth Sciences, 74:573-584.
|
|
|
| [33] |
Tsuchiya K, Igarshi T, Qong M. 2010. Land cover change detection based on satellite data for an arid area to the south of Aksu in Taklimakan desert. Journal of Arid Land, 2(1):14-19.
|
|
|
| [34] |
Wang T, Qu J J, Ling Y Q, et al. 2017. Wind tunnel test on the effect of metal net fences on sand flux in a Gobi Desert, China. Journal of Arid Land, 9(6):888-899.
|
|
|
| [35] |
Wang T, Qu J J, Niu Q H. 2020. Comparative study of the shelter efficacy of straw checkerboard barriers and rocky checkerboard barriers in a wind tunnel. Aeolian Research, 43:100575, doi: 10.1016/j.aeolia.2020.100575.
|
|
|
| [36] |
Wang Z T, Zheng X J. 2002. A simple model for calculating measurements of straw checkerboard barriers. Journal of Desert Research, 22(3), 229-232. (in Chinese)
|
|
|
| [37] |
Warner T T. 2004. Desert Meteorology. Cambridge: Cambridge University Press, 1-4.
|
|
|
| [38] |
Xu B, Zhang J, Huang N, et al. 2018. Characteristics of turbulent aeolian sand movement over straw checkerboard barriers and formation mechanisms of their internal erosion form. Journal of Geophysical Research: Atmospheres, 123:6907-6919.
|
|
|
| [39] |
Yakhot V, Orszag S A. 1986. Renormalization group analysis of turbulence. I. basic theory. Journal of Scientific Computing, 1(1):3-49.
|
|
|
| [40] |
Yazid A W M, Sidik N A C, Salim S M, et al. 2014. A review on the flow structure and pollutant dispersion in urban street canyons for urban planning strategies. Simulation, 90(8):892-916.
|
|
|
| [41] |
Zhang N, Kang J H, Lee S J. 2010. Wind tunnel observation on the effect of a porous wind fence on shelter of saltating sand particles. Geomorphology, 120(3-4):224-232.
|
|
|
| [42] |
Zhao W J, Wang L R, Ji H, et al. 2012. Effect of blended wheat straw on evaporation of seeding bricks with different soils. Bulletin of Soil and Water Conservation, 32(5):253-256. (in Chinese)
|
|
|
|
Viewed |
|
|
|
Full text
|
|
|
|
|
Abstract
|
|
|
|
|
Cited |
|
|
|
|
| |
Shared |
|
|
|
|
| |
Discussed |
|
|
|
|