| Geography, geology and natural resources in Central Asia (Guest Editorial Board Member:Prof. Dr. XIAO Wenjiao) |
|

|
|
|
| A new method of searching for concealed Au deposits by using the spectrum of arid desert plant species |
CUI Shichao1,2,3,4, ZHOU Kefa1,2,3,4,*( ), ZHANG Guanbin5,*(), DING Rufu6, WANG Jinlin1,2,3,4, CHENG Yinyi1,2,3,4, JIANG Guo1,2,3,4 ), ZHANG Guanbin5,*(), DING Rufu6, WANG Jinlin1,2,3,4, CHENG Yinyi1,2,3,4, JIANG Guo1,2,3,4 |
1State Key Laboratory of Desert and Oasis Ecology, Xinjiang Institute of Ecology and Geography, Chinese Academy of Sciences, Urumqi 830011, China
2Xinjiang Key Laboratory of Mineral Resources and Digital Geology, Urumqi 830011, China
3Xinjiang Research Centre for Mineral Resources, Chinese Academy of Sciences, Urumqi 830011, China
4University of Chinese Academy of Sciences, Beijing 100049, China
5Xinjiang Academy of Science and Technology for Development, Urumqi 830011, China
6China Non-Ferrous Metals Resources Geological Survey, Beijing 100012, China |
|
|
|
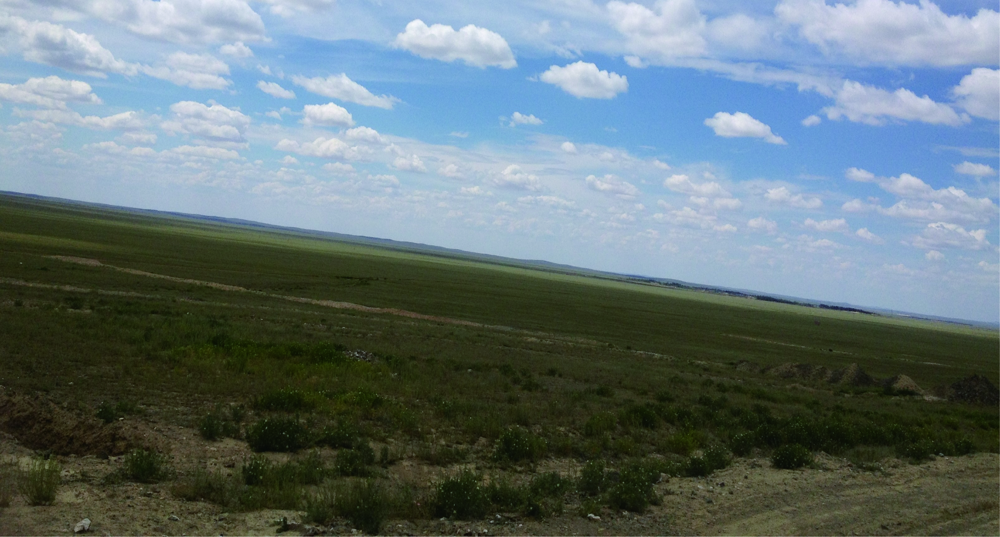
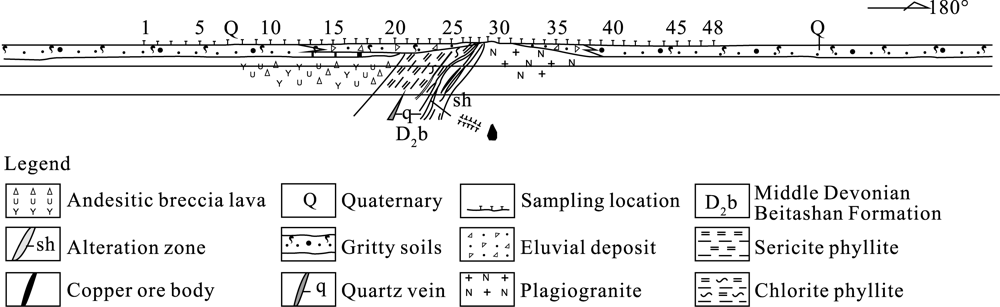
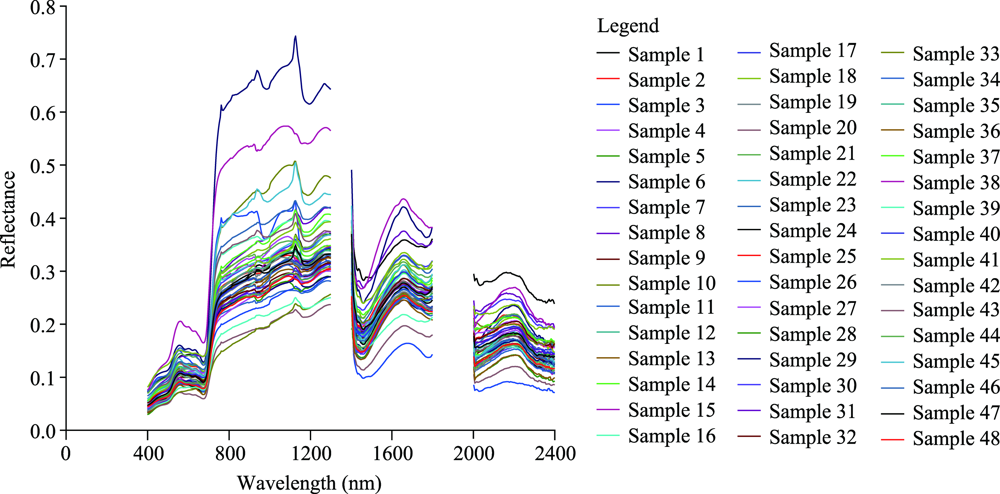
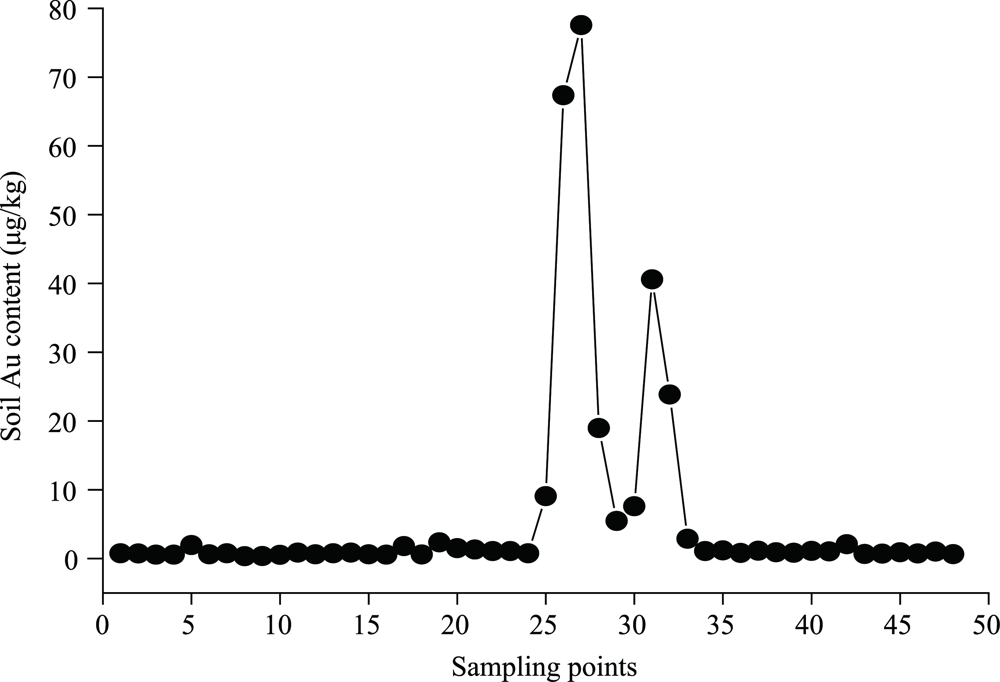
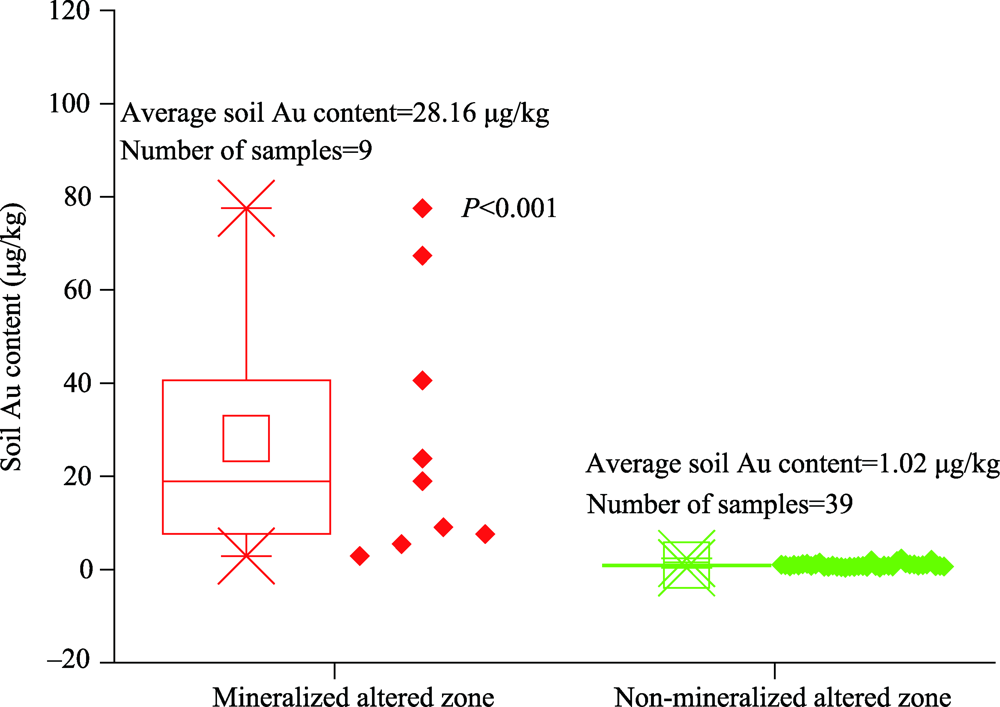
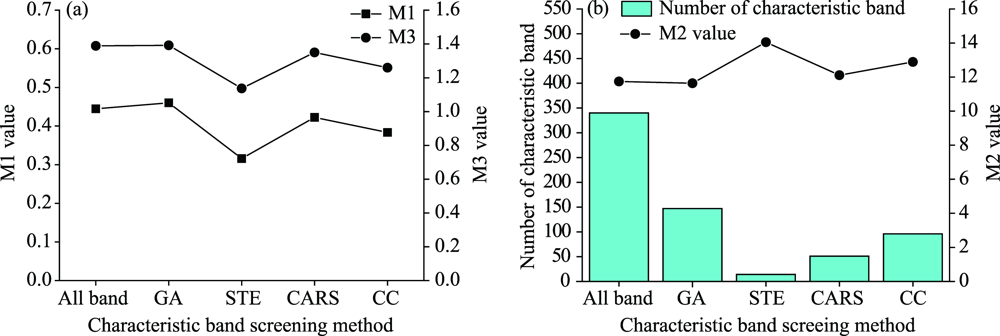
Abstract With the increase of exploration depth, it is more and more difficult to find Au deposits. Due to the limitation of time and cost, traditional geological exploration methods are becoming increasingly difficult to be effectively applied. Thus, new methods and ideas are urgently needed. This study assessed the feasibility and effectiveness of using hyperspectral technology to prospect for hidden Au deposits. For this purpose, 48 plant (Seriphidium terrae-albae) and soil (aeolian gravel desert soil) samples were first collected along a sampling line that traverses an Au mineralization alteration zone (Aketasi mining region in an arid region of China) and were used to obtain soil Au contents by a chemical analysis method and the reflectance spectra of plants obtained with an Analytical Spectral Device (ASD) FieldSpec3 spectrometer. Then, the corresponding relationship between the soil Au content anomaly and concealed Au deposits was investigated. Additionally, the characteristic bands were selected from plant spectra using four different methods, namely, genetic algorithm (GA), stepwise regression analysis (STE), competitive adaptive reweighted sampling (CARS), and correlation coefficient method (CC), and were then input into the partial least squares (PLS) method to construct a model for estimating the soil Au content. Finally, the quantitative relationship between the soil Au content and the 15 different plant transformation spectra was established using the PLS method. The results were compared with those of a model based on the full spectrum. The results obtained in this study indicate that the location of concealed Au deposits can be predicted based on soil geochemical anomaly information, and it is feasible and effective to use the full plant spectrum and PLS method to estimate the Au content in the soil. The cross-validated coefficient of determination (R2) and the ratio of the performance to deviation (RPD) between the predicted value and the measured value reached the maximum of 0.8218 and 2.37, respectively, with a minimum value of 6.56 μg/kg for the root-mean-squared error (RMSE) in the full spectrum model. However, in the process of modeling, it is crucial to select the appropriate transformation spectrum as the input parameter for the PLS method. Compared with the GA, STE, and CC methods, CARS was the superior characteristic band screening method based on the accuracy and complexity of the model. When modeling with characteristic bands, the highest accuracy, R2 of 0.8016, RMSE of 7.07 μg/kg, and RPD of 2.20 were obtained when 56 characteristic bands were selected from the transformed spectra (1/lnR)' (where it represents the first derivative of the reciprocal of the logarithmic spectrum) of sampled plants using the CARS method and were input into the PLS method to construct an inversion model of the Au content in the soil. Thus, characteristic bands can replace the full spectrum when constructing a model for estimating the soil Au content. Finally, this study proposes a method of using plant spectra to find concealed Au deposits, which may have promising application prospects because of its simplicity and rapidity.
|
|
Received: 28 September 2020
Published: 10 November 2021
|
|
Corresponding Authors:
*ZHOU Kefa (E-mail: zhoukf@ms.xjb.ac.cn);ZHANG Guanbin (E-mail: zhanggb2021@163.com)
|
|
|
| [1] |
Arias D. 1996. A case of successful soil geochemistry: the Rubiales Zn-Pb orebody (NW Spain). Journal of Geochemical Exploration, 56(3): 229-235.
doi: 10.1016/S0375-6742(96)00045-3
|
|
|
| [2] |
Bandaru V, Daughtry, C S, Codling E E, et al. 2016. Evaluating leaf and canopy reflectance of stressed rice plants to monitor arsenic contamination. International Journal of Environmental Research and Public Health, 13(6): 606, doi: 10.3390/ijerph13060606.
doi: 10.3390/ijerph13060606
|
|
|
| [3] |
Bhargava D S, Mariam D W. 1992. Cumulative effects of salinity and sediment concentration on reflectance measurements. International Journal of Remote Sensing, 13(11): 2151-2159.
doi: 10.1080/01431169208904258
|
|
|
| [4] |
Chakraborty S, Weindorf D C, Paul S, et al. 2015. Diffuse reflectance spectroscopy for monitoring lead in landfill agricultural soils of India. Geoderma Regional, 5: 77-85.
doi: 10.1016/j.geodrs.2015.04.004
|
|
|
| [5] |
Cheng H, Shen R L, Chen Y Y, et al. 2019. Estimating heavy metal concentrations in suburban soils with reflectance spectroscopy. Geoderma, 336: 59-67.
doi: 10.1016/j.geoderma.2018.08.010
|
|
|
| [6] |
Cui S C, Zhou K F, Ding R F, et al. 2018. Comparing the effects of different spectral transformations on the estimation of the copper content of Seriphidium terrae-albae. Journal of Applied Remote Sensing, 12(3): 036003, doi: 10.1117/1.JRS.12.036003.
doi: 10.1117/1.JRS.12.036003
|
|
|
| [7] |
Cui S C, Zhou K F, Ding R F, et al. 2021. Absorption and aggregation characteristics and changes in the reflectance spectrum of an arid desert plant under gold, copper, zinc and nickel stress. Natural Resources Research, 30(3): 2715-2731.
doi: 10.1007/s11053-021-09825-5
|
|
|
| [8] |
Demetriades-Shah T H, Steven M D, Clark J A. 1990. High resolution derivative spectra in remote sensing. Remote Sensing of Environment, 33(1): 55-64.
doi: 10.1016/0034-4257(90)90055-Q
|
|
|
| [9] |
Dunagan S C, Gilmore M S, Varekamp J C. 2007. Effects of mercury on visible/near-infrared reflectance spectra of mustard spinach plants (Brassica rapa P.). Environmental Pollution, 148(1): 301-311.
pmid: 17188786
|
|
|
| [10] |
Gong P, Pu R L, Yu B. 2001. Conifer species recognition: effects of data transformation. International Journal of Remote Sensing, 22(17): 3471-3481.
doi: 10.1080/01431160110034654
|
|
|
| [11] |
Han L, Chen R, Zhu H L, et al. 2020. Estimating soil arsenic content with visible and near-infrared hyperspectral reflectance. Sustainability, 12(4): 1476, doi: 10.3390/su12041476.
doi: 10.3390/su12041476
|
|
|
| [12] |
Hede A N H, Kashiwaya K, Koike K, et al. 2015. A new vegetation index for detecting vegetation anomalies due to mineral deposits with application to a tropical forest area. Remote Sensing of Environment, 171: 83-97.
doi: 10.1016/j.rse.2015.10.006
|
|
|
| [13] |
Hong Y S, Chen Y Y, Yu L, et al. 2018. Combining fractional order derivative and spectral variable selection for organic matter estimation of homogeneous soil samples by VIS-NIR spectroscopy. Remote Sensing, 10(3): 479, doi: 10.3390/rs10030479.
doi: 10.3390/rs10030479
|
|
|
| [14] |
Hoque E, Huntzler J S. 1992. Spectral blue-shift of red edge minitors damage class of beech trees. Remote Sensing of Environment, 39(1): 81-84.
doi: 10.1016/0034-4257(92)90142-7
|
|
|
| [15] |
Horler D N H, Barber J, Barringer A R. 1980. Effects of heavy metals on the absorbance and reflectance spectra of plants. International Journal of Remote Sensing, 1(2): 121-136.
doi: 10.1080/01431168008547550
|
|
|
| [16] |
Huang Z, Turner B J, Dury S J, et al. 2004. Estimating foliage nitrogen concentration from HYMAP data using continuum removal analysis. Remote Sensing of Environment, 93(1-2): 18-29.
doi: 10.1016/j.rse.2004.06.008
|
|
|
| [17] |
Jarvis R M, Goodacre R. 2005. Genetic algorithm optimization for pre-processing and variable selection of spectroscopic data. Bioinformatics, 21(7): 860-868.
pmid: 15513990
|
|
|
| [18] |
Jin J, Wang Q. 2019. Selection of informative spectral bands for PLS models to estimate foliar chlorophyll content using hyperspectral reflectance. IEEE Transactions on Geoscience and Remote Sensing, 57(5): 3064-3072.
doi: 10.1109/TGRS.36
|
|
|
| [19] |
Kemper T, Sommer S. 2002. Estimate of heavy metal contamination in soils after a mining accident using reflectance spectroscopy. Environmental Science & Technology, 36(12): 2742-2747.
doi: 10.1021/es015747j
|
|
|
| [20] |
Kooistra L, Wehrens R, Leuven R S E W, et al. 2001. Possibilities of visible-near-infrared spectroscopy for the assessment of soil contamination in river floodplains. Analytica Chimica Acta, 446(1-2): 97-105.
doi: 10.1016/S0003-2670(01)01265-X
|
|
|
| [21] |
Kooistra L, Leuven R S E W, Wehrens R, et al. 2003. A comparison of methods to relate grass reflectance to soil metal contamination. International Journal of Remote Sensing, 24(24): 4995-5010.
doi: 10.1080/0143116031000080769
|
|
|
| [22] |
Li H D, Liang Y Z, Xu Q S, et al. 2009. Key wavelengths screening using competitive adaptive reweighted sampling method for multivariate calibration. Analytica Chimica Acta, 648(1): 77-84.
doi: 10.1016/j.aca.2009.06.046
|
|
|
| [23] |
Liu M L, Liu X N, Ding W C, et al. 2011. Monitoring stress levels on rice with heavy metal pollution from hyperspectral reflectance data using wavelet-fractal analysis. International Journal of Applied Earth Observation and Geoinformation, 13(2): 246-255.
doi: 10.1016/j.jag.2010.12.006
|
|
|
| [24] |
Liu M L, Wang T J, Skidmore A K, et al. 2018. Heavy metal-induced stress in rice crops detected using multi-temporal Sentinel-2 satellite images. Science of the Total Environment, 637-638: 18-29.
doi: 10.1016/j.scitotenv.2018.04.415
|
|
|
| [25] |
Liu Z H, Lu Y, Peng Y P, et al. 2019. Estimation of soil heavy metal content using hyperspectral data. Remote Sensing, 11(12): 1464, doi: 10.3390/rs11121464.
doi: 10.3390/rs11121464
|
|
|
| [26] |
Moros J, de Vallejuelo S F O, Gredilla A, et al. 2009. Use of reflectance infrared spectroscopy for monitoring the metal content of the estuarine sediments of the Nerbioi-Ibaizabal River (Metropolitan Bilbao, Bay of Biscay, Basque Country). Environmental Science & Technology, 43(24): 9314-9320.
doi: 10.1021/es9005898
|
|
|
| [27] |
Philpot W D. 1991. The derivative ratio algorithm: avoiding atmospheric effects in remote sensing. IEEE Transactions on Geoscience and Remote Sensing, 29(3): 350-357.
doi: 10.1109/36.79425
|
|
|
| [28] |
Ren H Y, Zhuang D F, Pan J J, et al. 2008. Hyper-spectral remote sensing to monitor vegetation stress. Journal of Soils and Sediments, 8(5): 323-326.
doi: 10.1007/s11368-008-0030-4
|
|
|
| [29] |
Sawut R, Kasim N, Abliz A, et al. 2018. Possibility of optimized indices for the assessment of heavy metal contents in soil around an open pit coal mine area. International Journal of Applied Earth Observation and Geoinformation, 73: 14-25.
doi: 10.1016/j.jag.2018.05.018
|
|
|
| [30] |
Shi T Z, Chen Y Y, Liu Y L, et al. 2014. Visible and near-infrared reflectance spectroscopy-An alternative for monitoring soil contamination by heavy metals. Journal of Hazardous Materials, 265: 166-176.
doi: 10.1016/j.jhazmat.2013.11.059
|
|
|
| [31] |
Shi T Z, Liu H Z, Chen Y Y, et al. 2016a. Estimation of arsenic in agricultural soils using hyperspectral vegetation indices of rice. Journal of Hazardous Materials, 308: 243-252.
doi: 10.1016/j.jhazmat.2016.01.022
|
|
|
| [32] |
Shi T Z, Wang J J, Chen Y Y, et al. 2016b. Improving the prediction of arsenic contents in agricultural soils by combining the reflectance spectroscopy of soils and rice plants. International Journal of Applied Earth Observation and Geoinformation, 52: 95-103.
doi: 10.1016/j.jag.2016.06.002
|
|
|
| [33] |
Shi T Z, Guo L, Chen Y Y, et al. 2018. Proximal and remote sensing techniques for mapping of soil contamination with heavy metals. Applied Spectroscopy Reviews, 53(10): 783-805.
doi: 10.1080/05704928.2018.1442346
|
|
|
| [34] |
Smee B W. 1998. A new theory to explain the formation of soil geochemical responses over deeply covered gold mineralization in arid environments. Journal of Geochemical Exploration, 61(1-3): 149-172.
doi: 10.1016/S0375-6742(98)00007-7
|
|
|
| [35] |
Smith D B, Cannon W F, Woodruff L G. 2011. A national-scale geochemical and mineralogical survey of soils of the conterminous United States. Applied Geochemistry, 26: S250-S255.
|
|
|
| [36] |
Smith K L, Steven M D, Colls J J. 2004. Use of hyperspectral derivative ratios in the red-edge region to identify plant stress responses to gas leaks. Remote Sensing of Environment, 92(2): 207-217.
doi: 10.1016/j.rse.2004.06.002
|
|
|
| [37] |
Song C A, Song W, Ding R F, et al. 2017. Phytogeochemical characteristics of Seriphidium terrae-albae (Krasch) Poljak in the metallic ore deposits in North part of East Junggar desert area, Xinjiang and their prospecting significance. Geotectonica et Metallogenia, 41(1): 122-132. (in Chinese)
|
|
|
| [38] |
Song W, Lei L Q, Song C A, et al. 2016. Characteristics of phytogeochemistry and prospecting choices of effective plants and elements in Kalatongke Cu-Ni ore field, Xinjiang. Journal of Guiling University of Technology, 36(2): 195-206. (in Chinese)
|
|
|
| [39] |
Sun W C, Zhang X. 2017. Estimating soil zinc concentrations using reflectance spectroscopy. International Journal of Applied Earth Observation and Geoinformation, 58: 126-133.
doi: 10.1016/j.jag.2017.01.013
|
|
|
| [40] |
Sun W C, Zhang X, Sun X J, et al. 2018. Predicting nickel concentration in soil using reflectance spectroscopy associated with organic matter and clay minerals. Geoderma, 327: 25-35.
doi: 10.1016/j.geoderma.2018.04.019
|
|
|
| [41] |
Tan K, Ma W B, Chen L H, et al, 2021. Estimating the distribution trend of soil heavy metals in mining area from HyMap airborne hyperspectral imagery based on ensemble learning. Journal of Hazardous, 401: 123288, 10.1016/j.jhazmat.2020.123288.
doi: 10.1016/j.jhazmat.2020.123288
|
|
|
| [42] |
Timofeev I V, Kasimov N S, Kosheleva N E. 2016. Soil cover geochemistry of mining landscapes in the south-east of Transbaikalia (City of Zakamensk). Geography and Natural Resources, 37: 200-211.
|
|
|
| [43] |
Vega F A, Covelo E F, Andrade M L. 2006. Competitive sorption and desorption of heavy metals in mine soils: Influence of mine soil characteristics. Journal of Colloid and Interface Science, 298(2): 582-592.
pmid: 16458917
|
|
|
| [44] |
Von Steiger B, Webster R, Schulin R. 1996. Mapping heavy metals in polluted soil by disjunctive kriging. Environmental Pollution, 94(2): 205-215.
pmid: 15093507
|
|
|
| [45] |
Wang F H, Gao J, Zha Y, et al. 2018. Hyperspectral sensing of heavy metals in soil and vegetation: Feasibility and challenges. ISPRS Journal of Photogrammetry and Remote Sensing, 136: 73-84.
doi: 10.1016/j.isprsjprs.2017.12.003
|
|
|
| [46] |
Wang J J, Wang T J, Shi T Z, et al. 2015. A wavelet-based area parameter for indirectly estimating copper concentration in Carex leaves from canopy reflectance. Remote Sensing, 7(11): 15340-15360.
doi: 10.3390/rs71115340
|
|
|
| [47] |
Wang L, Bai Y L, Lu Y L, et al. 2011. Effect on retrieval precision for corn N content by spectrum data transformation. Remote Sensing Technology and Application, 26(2): 220-225. (in Chinese)
|
|
|
| [48] |
Wang R, Wu S, Wu K, et al. 2021. Estimation and spatial analysis of heavy metals in metal tailing pond based on improved PLS with multiple factors. IEEE Access, 9: 64880-64894.
doi: 10.1109/ACCESS.2021.3073933
|
|
|
| [49] |
Wang Z, Pan W, Yang X, et al. 2013. Soil geochemical anomaly characteristics and the geological significance of soil geochemical survey at Kavanga area in Kigoma, Tanzania. Contributions to Geology & Mineral Resources Research, 28(4): 634-640. (in Chinese)
|
|
|
| [50] |
Yang K M, Zhuo W, Zhang W W, et al. 2016. Study on the red edge response on derivative spectra of potted corn leaves stressed by lead ions. Science Technology and Engineering, 16(11): 110-114, 127. (in Chinese)
|
|
|
| [51] |
Yang X X, Luo X R, Zheng C J, et al. 2018. Geochemical characteristics of soil and prospecting direction in the Guoqing Area, Northern Margin of the Hengyang Basin. Geology and Exploration, 54(4): 762-771. (in Chinese)
|
|
|
| [52] |
Yousefi G, Homaee M, Norouzi A A. 2018. Estimating soil heavy metals concentration at large scale using visible and near-infrared reflectance spectroscopy. Environmental Monitoring and Assessment, 190(9): 513, doi: 10.1007/s10661-018-6898-6.
doi: 10.1007/s10661-018-6898-6
|
|
|
| [53] |
Zhang C Y, Ren H Z, Qin Q M, et al. 2017a. A new narrow band vegetation index for characterizing the degree of vegetation stress due to copper: the copper stress vegetation index (CSVI). Remote Sensing Letters, 8(6): 576-585.
doi: 10.1080/2150704X.2017.1306135
|
|
|
| [54] |
Zhang C Y, Ren H Z, Liang Y Z, et al. 2017b. Advancing the PROSPECT-5 model to simulate the spectral reflectance of copper-stressed leaves. Remote Sensing, 9(11): 1191, doi: 10.3390/rs9111191.
doi: 10.3390/rs9111191
|
|
|
| [55] |
Zhang C Y, Ren H Z, Dai X J, et al. 2019. Spectral characteristics of copper-stressed vegetation leaves and further understanding of the copper stress vegetation index. International Journal of Remote Sensing, 40(12): 4473-4488.
doi: 10.1080/01431161.2018.1563842
|
|
|
| [56] |
Zhang C, Yang K M, Li Y, et al. 2020. Spectral characteristics and the study of pollution degree of maize leaves under copper and lead stress. Journal of the Indian Society of Remote Sensing, 48(1): 21-33.
doi: 10.1007/s12524-019-01055-w
|
|
|
| [57] |
Zhang L P, Zheng L F, Tong Q X. 1997. The estimation of vegetation variables based on high resolution spectra. Journal of Remote Sensing, 2(1): 111-114. (in Chinese)
|
|
|
| [58] |
Zhang Z J, Liu M L, Liu X N, et al. 2018. A new vegetation index based on multitemporal sentinel-2 images for discriminating heavy metal stress levels in rice. Sensors, 18(7): 2172, doi: 10.3390/s18072172.
doi: 10.3390/s18072172
|
|
|
|
Viewed |
|
|
|
Full text
|
|
|
|
|
Abstract
|
|
|
|
|
Cited |
|
|
|
|
| |
Shared |
|
|
|
|
| |
Discussed |
|
|
|
|