| Research article |
|


|
|
|
| Effects of different types of guardrails on sand transportation of desert highway pavement |
GAO Li1, CHENG Jianjun1,*( ), WANG Haifeng2,*(), YUAN Xinxin2 ), WANG Haifeng2,*(), YUAN Xinxin2 |
1College of Water Resources and Architectural Engineering, Shihezi University, Shihezi 832003, China
2Xinjiang Institute of Ecology and Geography, Chinese Academy of Sciences, Urumqi 830000, China |
|
|
|
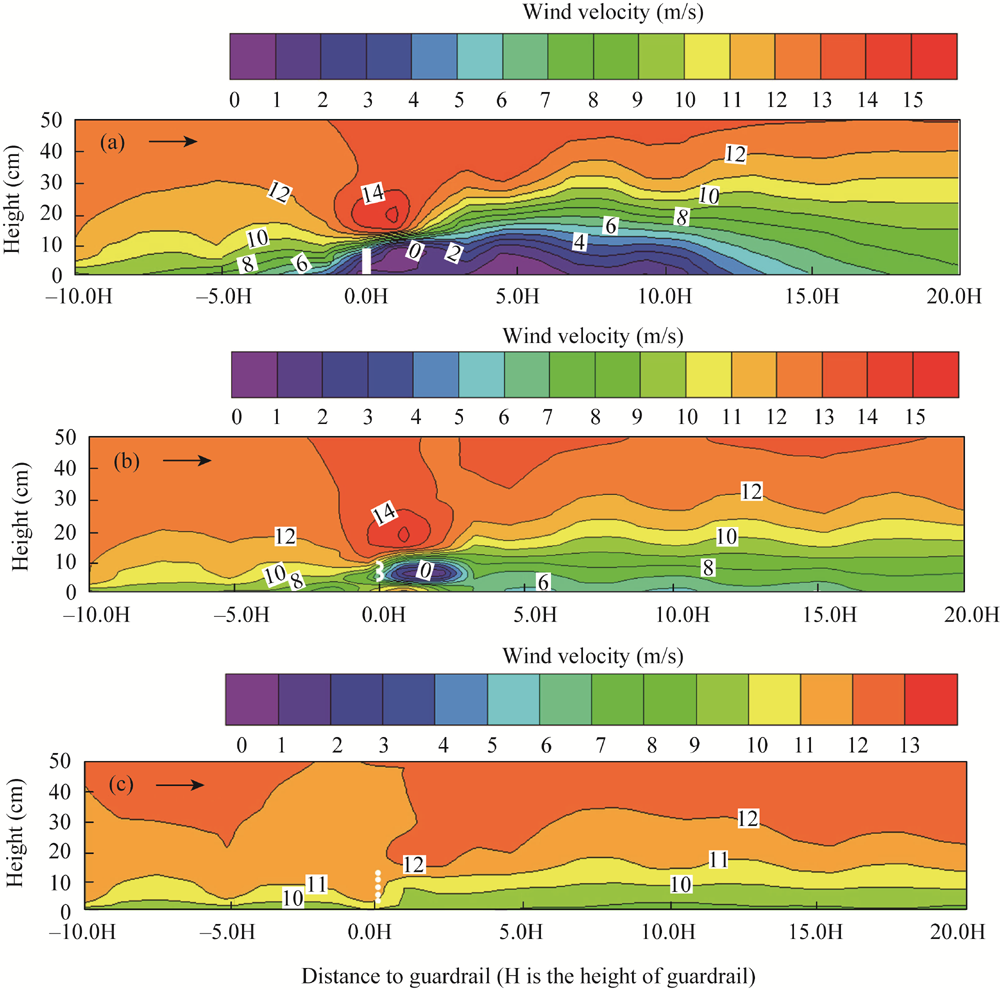
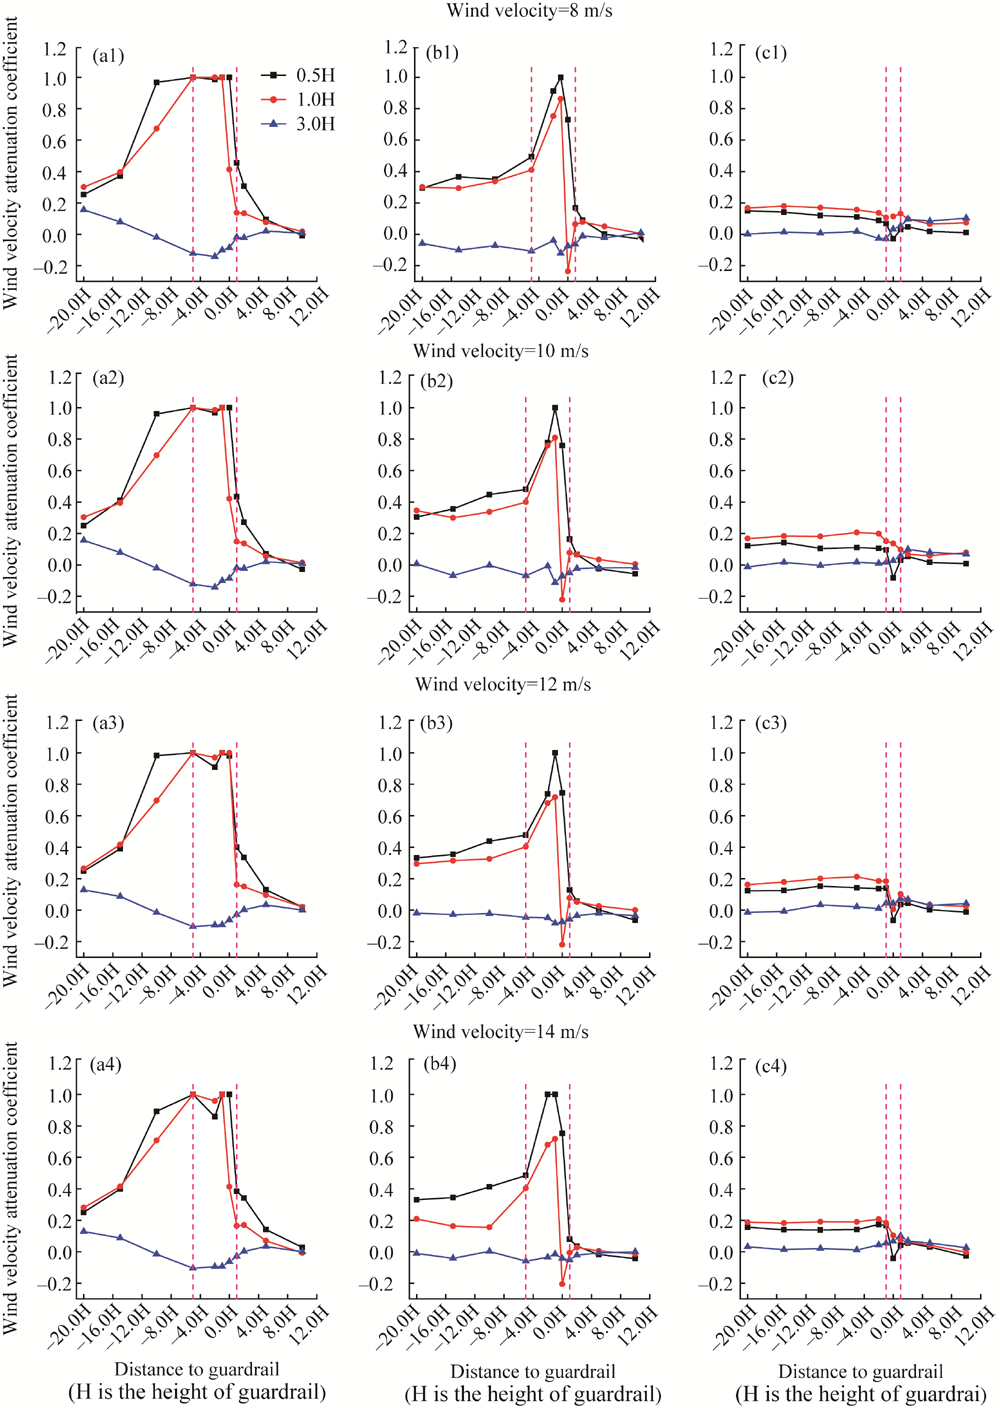
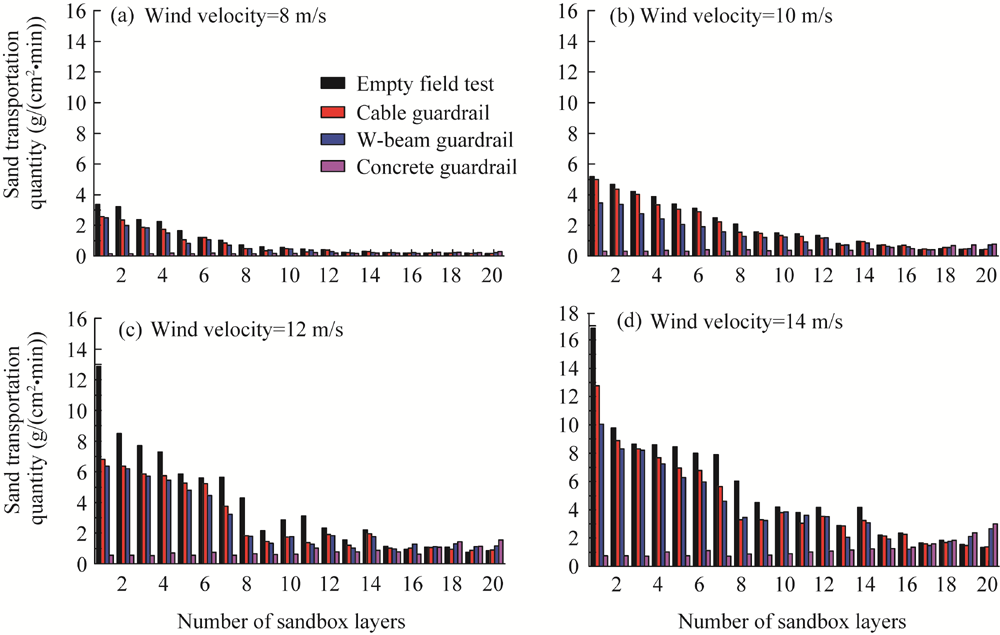
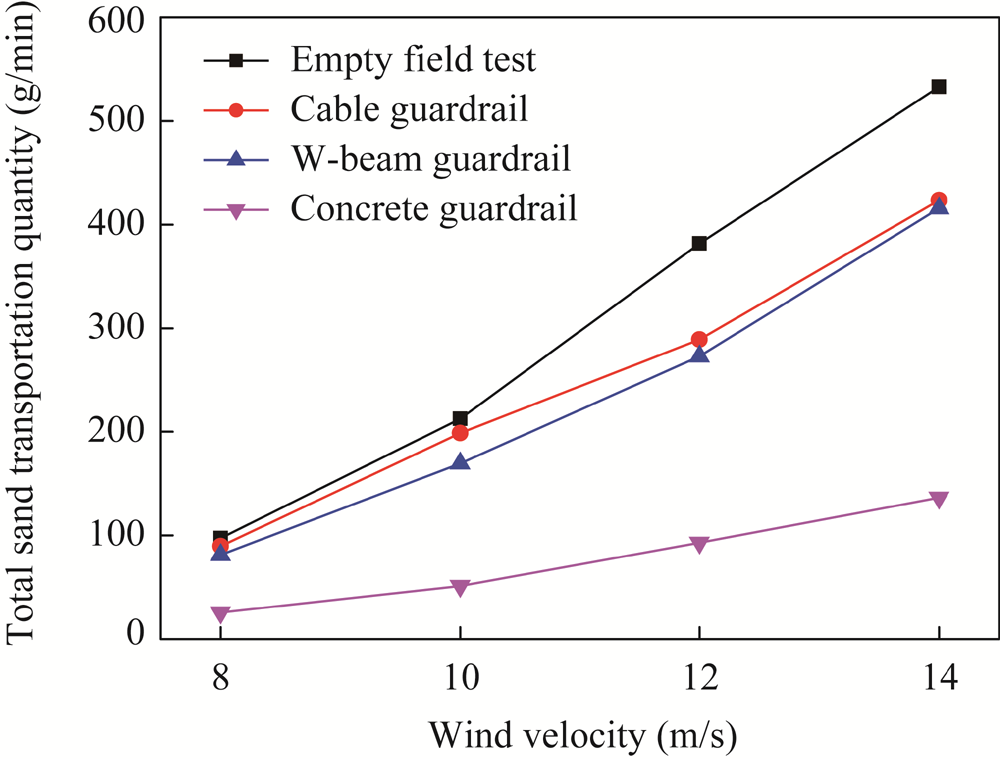
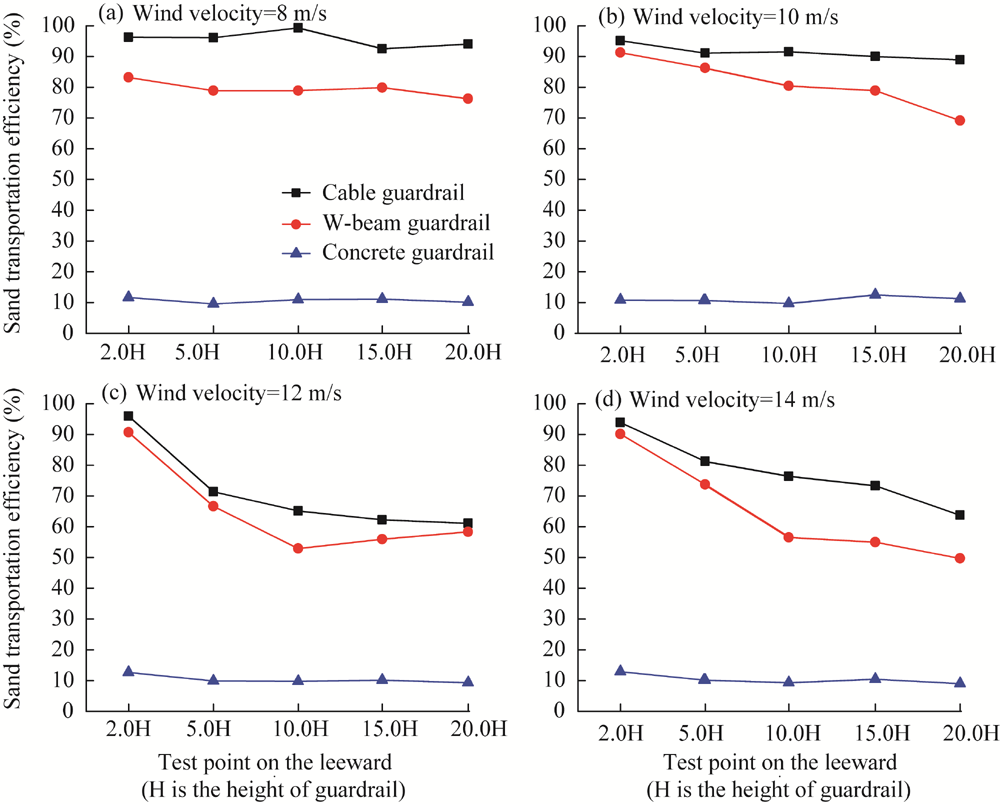
Abstract Guardrail, an important highway traffic safety facility, is mainly used to prevent vehicles from accidentally driving off the road and to ensure driving safety. Desert highway guardrails hinder the movement of wind-blown sand, resulting in the decline of sand transportation by the pavement and the deposition of sand gains on the pavement, and endangering traffic safety. To reveal the influence of guardrails on sand transportation of desert highway pavement, we tested the flow field and sand transport volume distribution around the concrete, W-beam, and cable guardrails under different wind velocities through wind tunnel simulation. Wind velocity attenuation coefficients, sand transportation quantity, and sand transportation efficiency are used to measure sand transportation of highway pavement. The results show that the sand transportation of highway pavement was closely related to the zoning characteristics of flow field and variation of wind velocity around the guardrails. The flow field of the concrete guardrail was divided into deceleration, acceleration, and vortex zones. The interaction between the W-beam guardrail and wind-blown sand was similar to that of lower wind deflector. Behind and under the plates, there were the vortex zone and acceleration zone, respectively. The acceleration zone was conducive to transporting sand on the pavement. The cable guardrail only caused wind velocity variability within the height range of guardrail, and there was no sand deposition on the highway pavement. When the cable, W-beam, and concrete guardrails were used, the total transportation quantities on the highway pavement were 423.53, 415.74, and 136.53 g/min, respectively, and sand transportation efficiencies were 99.31%, 91.25%, and 12.84%, respectively. From the perspective of effective sand transportation on the pavement, the cable guardrail should be preferred as a desert highway guardrail, followed by the W-beam guardrail, and the concrete guardrail is unsuitable. The study results provide theoretical basis for the optimal design of desert highway guardrails and the prevention of wind-blown sand disasters on the highway pavement.
|
|
Received: 04 May 2022
Published: 30 September 2022
|
|
Corresponding Authors:
*CHENG Jianjun (E-mail: chengdesign@126.com);WANG Haifeng (E-mail: wanghf@ms.xjb.ac.cn)
|
|
|
| [1] |
Bruno L, Horvat M, Raffaele L. 2018. Windblown sand along railway infrastructures: A review of challenges and mitigation measures. Journal of Wind Engineering & Industrial Aerodynamics, 177: 340-365.
|
|
|
| [2] |
Chen B Y, Cheng J J, Xin L G, et al. 2019. Effectiveness of hole plate-type sand barriers in reducing aeolian sediment flux: Evaluation of effect of hole size. Aeolian Research, 38: 1-12.
doi: 10.1016/j.aeolia.2019.03.001
|
|
|
| [3] |
Cheng J J, Xue C X. 2014. The sand-damage-prevention engineering system for the railway in the desert region of the Qinghai-Tibet Plateau. Journal of Wind Engineering & Industrial Aerodynamics, 125: 30-37.
|
|
|
| [4] |
Cheng J J, Lei J Q, Li S Y, et al. 2016a. Disturbance of the inclined inserting-type sand fence to wind-sand flow fields and its sand control characteristics. Aeolian Research, 21: 139-150.
doi: 10.1016/j.aeolia.2016.04.008
|
|
|
| [5] |
Cheng J J, Lei J Q, Li S Y, et al. 2016b. Effect of hanging-type sand fence on characteristics of wind-sand flow fields. Wind and Structures, 22(5): 555-571.
doi: 10.12989/was.2016.22.5.555
|
|
|
| [6] |
Cheng J J, Zhi L Y, Xue C X, et al. 2017. Control law of lower air deflector for sand flow field along railway. China Railway Science, 38(6): 16-23. (in Chinese)
|
|
|
| [7] |
Cheng J J, Ding B S, Gao L, et al. 2021. Numerical study on the bearing response trend of perforated sheet-type sand fences. Aeolian Research, 53: 100734, doi: 10.1016/j.aeolia.2021.100734.
doi: 10.1016/j.aeolia.2021.100734
|
|
|
| [8] |
Ding B S, Cheng J J, Xia D T, et al. 2021. Fiber-Reinforced Sand-Fixing Board Based on the Concept of "Sand Control with Sand": Experimental Design, Testing, and Application. Sustainability, 13(18): 10229, doi: 10.3390/su131810229.
doi: 10.3390/su131810229
|
|
|
| [9] |
Dong Z B, Chen G T, He X D, et al. 2004. Controlling blown sand along the highway crossing the Taklimakan Desert. Journal of Arid Environments, 57(3): 329-344.
doi: 10.1016/j.jaridenv.2002.02.001
|
|
|
| [10] |
Han Y L, Gao Y, Meng Z J, et al. 2017. Effects of wind guide plates on wind velocity acceleration and dune leveling: a case study in Ulan Buh Desert, China. Journal of Arid Land, 9(5): 743-752.
doi: 10.1007/s40333-017-0101-8
|
|
|
| [11] |
Han Z W, Wang T, Sun Q W, et al. 2003. Sand harm in Taklimakan Desert highway and sand control. Journal of Geographical Sciences, 13(1): 45-53.
doi: 10.1007/BF02873146
|
|
|
| [12] |
Jason M H, Venky N S, Gudmundur F U. 2005. The crash severity impacts of fixed roadside objects. Journal of Safety Research, 36(2): 139-147.
doi: 10.1016/j.jsr.2004.12.005
|
|
|
| [13] |
Lei J Q, Li S Y, Fan D D, et al. 2008. Classification and regionalization of the forming environment of windblown sand disasters along the Tarim Desert Highway. Chinese Science Bulletin, 53(Suppl. 2): 1-7.
doi: 10.1007/s11434-008-0026-x
|
|
|
| [14] |
Li B L, Sherman D J. 2015. Aerodynamics and morphodynamics of sand fences: A review. Aeolian Research, 17: 33-48.
doi: 10.1016/j.aeolia.2014.11.005
|
|
|
| [15] |
Li C J, Wang Y D, Lei J Q, et al. 2021. Damage by wind-blown sand and its control measures along the Taklimakan Desert Highway in China. Journal of Arid Land, 13(1): 98-106.
doi: 10.1007/s40333-020-0071-0
|
|
|
| [16] |
Li S H, Li C, Yao D, et al. 2020. Wind tunnel experiments for dynamic modeling and analysis of motion trajectories of wind-blown sands. Europen Physical Journal E, 43(22): 1-10.
|
|
|
| [17] |
Li S Y, Fan J L, Wang H F, et al. 2016. Causes and thoughts of comprehensive control of blown sand disaster at Qiaha Bridge of National Highway 315, in Cele County, Xinjiang, Northwest China. Arid Land Geography, 39(4): 754-760. (in Chinese)
|
|
|
| [18] |
Owen P R, Gillette D. 1985. Wind tunnel constraint on saltation. In: Proceedings of International Workshop on the Physics of Blown Sand, Denmark: University of Aarhus, 253-269.
|
|
|
| [19] |
Pan J S, Zhao H, Wang Y, et al. 2021. The influence of aeolian sand on the anti-Skid characteristics of Asphalt Pavement. Materials, 14(19): 5523, doi: 10.3390/ma14195523.
doi: 10.3390/ma14195523
|
|
|
| [20] |
Shi L, Wang D Y, Cui K, et al. 2021. Comparative evaluation of concrete sand-control fences used for railway protection in strong wind areas. Railway Engineering Science, 29(2): 183-198.
doi: 10.1007/s40534-020-00228-5
|
|
|
| [21] |
Tsukahara T, Sakamoto Y, Aoshima D, et al. 2012. Visualization and laser measurements on the flow field and sand movement on sand dunes with porous fences. Experiments in Fluids, 52(4): 877-890.
doi: 10.1007/s00348-011-1157-4
|
|
|
| [22] |
Wang C, Li S Y, Li Z N, et al. 2020a. Effects of windblown sand damage on desert highway guardrails. Natural Hazards, 103: 283-298.
doi: 10.1007/s11069-020-03987-w
|
|
|
| [23] |
Wang C, Li S Y, Lei J Q, et al. 2020b. Effect of the W-beam central guardrails on wind-blown sand deposition on desert expressways in sandy regions. Journal of Arid Land, 12(1): 154-165.
doi: 10.1007/s40333-020-0052-3
|
|
|
| [24] |
Wang T, Qu J J, Niu Q H. 2020. Comparative study of the shelter efficacy of straw checkerboard barriers and rocky checkerboard barriers in a wind tunnel. Aeolian Research, 43: 1-11. https://doi.org/10.1016/j.aeolia.2020.100575.
|
|
|
| [25] |
Wang Y G, Chen K M, Ci Y S, et al. 2011. Safety performance audit for roadside and median barriers using freeway crash records: Case study in Jiangxi, China. Scientia Iranica, 18(6): 1222-1230.
doi: 10.1016/j.scient.2011.11.020
|
|
|
| [26] |
White B R. 1996. Laboratory simulation of aeolian sand transport and physical modeling of flow around dunes. Ann Arid Zone, 35(3): 187-213.
|
|
|
| [27] |
Xiao J H, Yao Z Y, Qu J J. 2015. Influence of Golmud-Lhasa section of Qinghai-Tibet Railway on blown sand transport. Chinese Geographical Science, 25(1): 39-50.
doi: 10.1007/s11769-014-0722-1
|
|
|
|
Viewed |
|
|
|
Full text
|
|
|
|
|
Abstract
|
|
|
|
|
Cited |
|
|
|
|
| |
Shared |
|
|
|
|
| |
Discussed |
|
|
|
|