


1 Introduction
Understanding the flux of soil organic carbon (SOC) is of fundamental importance to agriculture. SOC dynamics is a potential indicator of the condition of agricultural crops, as well as an important tool that can aid in choosing or proposing management systems to mitigate greenhouse gas emissions and the impact of climate change (Sobocká et al., 2007). Studies based on SOC dynamics are relevant to the Sustainable Development Goals of the United Nations and the Land Degradation Neutrality challenge, as SOC sequestration provides a range of benefits related to food security, water scarcity, climate change, biodiversity loss, and health threat (Keesstra et al., 2016, 2018; Smith et al., 2019; Visser et al., 2019). The use of mathematical models that link SOC to climate, environment, and soil parameters can significantly improve the understanding of SOC dynamics. Among others, the Century biogeochemical model has proved to be essential when it comes to understanding SOC dynamics in the most varied environments (Smith et al., 1997) and land use systems (Cerri et al., 2004; Brandani et al., 2015; Silva-Olaya et al., 2017).
The semi-arid region of Brazil, covering an area of 1.0×10⁶ km2 (Ministry of National Integration, 2017a, b), is characterized by an annual mean rainfall of less than 800 mm (Moura et al., 2007) and an aridity index of up to 0.5 (Costa, 2021). As it is densely populated, agriculture is a major production mode in the region, especially rainfed agriculture. However, one of the principal factors for the low food production is water scarcity, and the local governments should take measures to redirect irrigation water to these regions (Castro, 2018). The total irrigated area in the semi-arid region of Brazil was 4.7×10³ km2 in 2015, which is expected to increase by 50% by 2030, with a total irrigated area of 7.1×10³ km2 (National Water Agency, 2017). More than 20 years ago, the diversion of the São Francisco River was first seen to solve the problem of water scarcity, reduce drought, and promote irrigated agriculture in several districts of the Northeast Brazil (Ferreira, 2019). It is important to mention the Petrolina-Juazeiro hub, which is a successful example of the development of a large-scale irrigated agriculture project based on perennial crops in the region (Castro, 2011). In Alagoas State, the construction of channels has changed the seasonality of agriculture management in the region, allowing farmers to grow crops year-round through irrigation.
Given the different management practices and the various ways of supplying organic matter to the soil, it is necessary to obtain information on SOC dynamics. Because SOC dynamics may be different in irrigated or rainfed agriculture systems, and the calculation model also needs to be simulated (Leite and Mendonça, 2003; Sobocká et al., 2007; Althoff et al., 2016) under current conditions or climate scenarios. Álvaro-Fuentes and Paustian (2011) observed the behavior of SOC under different agriculture systems (i.e., rainfed and irrigated agriculture systems) and proved the importance of studies related to SOC modelling in agriculture systems. In semi-arid region, there were few studies on the Century model and the transition from native vegetation to agriculture systems, especially under climate change (Álvaro-Fuentes et al., 2009; Álvaro-Fuentes and Paustian, 2011; Althoff et al., 2016, 2018). Althoff et al. (2016) used different vegetation systems to obtain the information about the growth of the native vegetation under climate change in the semi-arid region of Brazil. This was of fundamental importance for using the Century model to generate information on SOC in the semi-arid region of Brazil.
In the context of climate change, semi-arid areas in the world will be strongly affected due to their vulnerability. The semi-arid region of Brazil is one of the most affected regions in the world (IPCC, 2014; Marengo, 2014; Tavares et al., 2019). The increases in temperature and rainfall variability described in the climate models may lead to a reduction in the supply of soil organic residue, including in native vegetation, with a negative impact on SOC stock and agriculture systems (Althoff et al., 2016). However, there is still no information on the impact of climate change on agriculture systems in the semi-arid region of Brazil, especially on SOC dynamics. In other semi-arid regions of the Mediterranean, some results showed that strategies such as organic farming and straw returning are relevant for SOC restoration and climate change mitigation (Novara et al., 2018, 2019). Other results pointed that the practices combining external organic amendments with cover crops or conservation tillage showed good performance in SOC sequestration (Aguilera et al., 2013).
The study is therefore unprecedented and aimed to assess SOC dynamics in rainfed and irrigated agriculture systems under different climate scenarios in the semi-arid region of Brazil using the Century 4.5 model. The results of this study are essential for generating information that can aid decision-making at the regional level, providing important data for farmers in the semi-arid region of Brazil so that they can take measures to minimize the impact of climate change on food production; at the national level, supplying the basis for public policies such as the ABC Plan (Low Carbon Emission Agriculture) of the Federal Government; and at the international level, offering key results for achieving food security in semi-arid and arid regions of the world, as well as providing important data for international discussions related to climate change.
2 Materials and methods
2.1 Study area and data collection
In this study, we analysed SOC stock in three districts, including Delmiro Gouveia District (09°29'00''S, 37°56'24''W; 255 m a.s.l.), Pariconha District (09°17'04''S, 38°02'43''W; 421 m a.s.l.), and Inhapi District (09°12'13''S, 37°44'11''W; 320 m a.s.l.), located in the semi-arid region of Alagoas State, Brazil. In the three districts, the agricultural production consists of small and medium-sized farmers who cultivate crops such as maize, beans, cassava, and others, which are important to feed the local population (Lima et al., 2019). According to the Thornthwaite climate classification, the climate of this region is semi-arid and megathermal, with a humidity index varied from -20 to -40 and little or no excess water; the predominant vegetation is hyper-xerophilous Caatinga (Barros, 2012). Annual mean rainfall is 511, 665, and 626 mm, respectively, and mean air temperature is 25.4°C, 23.8°C, and 24.2°C, respectively, in Delmiro Gouveia, Pariconha, and Inhapi districts (https://pt.climate-data.org/). The soil types are classified as Quartzipsamment in Delmiro Gouveia District, Psamment in Pariconha District, and Ultisol in Inhapi District.
In each district, we selected one farm whose conventional cultivation (maize and beans) area is close to the native vegetation area to represent the original conditions of the soil. In selecting these farms, we considered the following conditions: (1) the information of land use and management practices adopted by the farm since the conversion of native vegetation; (2) the conventional cultivation area not more than 0.2 km away from the native vegetation; and (3) similar landscape, soil type, and soil texture between conventional cultivation area and native vegetation area. Finally, we selected eight sites in the study area, including three sites in Delmiro Gouveia District, two sites in Inhapi District, and three sites in Pariconha District. At each site, five soil samples were randomly selected at depths of 0-10 and 10-20 cm. A total of 80 soil samples were surveyed in this study. Then, the soil samples were air-dried and passed through a 2.0-mm sieve to remove stones and roots before analysis. Sub-samples were macerated and passed through a 0.1-mm sieve to determine the total carbon. Bulk density (g/cm3) was measured in each soil depth using a volumetric steel ring (100 cm3). We also determined the pH and soil texture according to Brazilian Agricultural Research Corporation (Barreto, 1997). SOC concentration (g/g) was measured by dry combustion using an organic element analyzer (Thermo Scientific Flash 2000). Finally, SOC stock (g/m2) was calculated by multiplying SOC concentration by bulk density and soil depth.
2.2 Adopted land management systems
We analysed the adopted land management systems based on the production of different crops in productive and non-experimental areas in recent decades (Table 1). The crops planted in the study area included maize, beans, and pasture. Crop residue was generally available for animal grazing and was almost completely consumed. Soil management was based on conventional tillage and ploughing using animal traction. The conventional cropping systems in the semi-arid region of Brazil were characterized by consecutive cultivation for four to five years, followed by fallow for two to three years, and then they were again used in agriculture. Complete information of the adopted management systems in this study can be shown in Table 1. Until the time of sampling, the soil had not been turned over for 10 years. Moreover, over the past 20 years, the study area had been cultivated with maize and beans at different times, using the same cropping practices adopted in other agriculture areas (e.g., soil preparation, grazing, and fallow).
Table 1 Adopted land management systems in different period of Delmiro Gouveia, Pariconha, and Inhapi districts
| District | Site | Adopted management systems in differnet period | |||
|---|---|---|---|---|---|
| Native vegetation | Cultivation | Pasture | Fallow | ||
| Delmiro Gouveia | EqNV | 1900-2014 | - | - | - |
| EqCC15 | 1900-1999 | 2000-2003, 2005-2009, and 2011-2014 | - | 2004 and 2010 | |
| EqCC4 | 1900-2010 | 2011-2014 | - | - | |
| Pariconha | EpNV | 1900-2014 | - | - | - |
| EpPa10 | 1900-1973 | 1974-1975, 1978-1982, 1985-1989, 1992-1996, and 1999-2003 | 2005-2014 | 1976-1977, 1983-1984, 1990-1991, 1997-1998, and 2004 | |
| EpCC4 | 1900-2010 | 2011-2014 | - | - | |
| Inhapi | U1NV | 1900-2014 | - | - | - |
| U1CC30 | 1900-1985 | 1986-1990, 1992-1996, 1999-2003, 2006-2010, and 2012-2014 | - | 1991, 1997-1998, 2004-2005, and 2011 | |
Note: The data comes from the land use history of local farmers.
The soil parameters in Delmiro Gouveia, Pariconha, and Inhapi districts varied according to the soil types (Quartzipsamment, Psamment, and Ultisol) and soil texture (sand, silt, and clay contents). The physical and chemical properties of soil were described in Table 2.
Table 2 Soil texture, bulk density, and pH in Delmiro Gouveia, Pariconha, and Inhapi districts
| District | Site | Soil texture (%) | Bulk density (g/cm3) | pH | ||
|---|---|---|---|---|---|---|
| Sand | Silt | Clay | ||||
| Delmiro Gouveia | EqNV | 88.8±1.8 | 2.7±2.8 | 8.5±1.0 | 1.4±0.02 | 4.4±0.1 |
| EqCC15 | 86.5±2.3 | 5.0±6.9 | 8.4±4.6 | 1.5±0.01 | 5.0±0.1 | |
| EqCC4 | 88.6±4.0 | 4.6±1.6 | 6.8±2.4 | 1.4±0.00 | 4.7±0.3 | |
| Pariconha | EpNV | 88.5±1.2 | 7.2±2.4 | 4.3±1.3 | 1.5±0.01 | 5.1±0.1 |
| EpPa10 | 85.3±2.4 | 11.6±1.7 | 3.0±0.6 | 1.6±0.02 | 5.9±0.1 | |
| EpCC4 | 77.8±3.7 | 14.7±3.0 | 7.5±0.7 | 1.5±0.02 | 5.4±0.0 | |
| Inhapi | U1NV | 64.3±3.5 | 15.9±2.4 | 19.8±5.8 | 1.5±0.01 | 5.4±0.2 |
| U1CC30 | 58.3±6.3 | 19.9±4.8 | 21.8±1.6 | 1.5±0.01 | 5.9±0.1 | |
Note: Mean±SD.
2.3 Parameterization, calibration, and validation of the Century model
First, in order to simulate the changes of SOC stock in rainfed and irrigated agriculture systems, we parameterized the Century model by inputting environmental data (i.e., climate and soil data). Then, the model was calibrated to improve the correlation between the observed and simulated data (Bortolon et al., 2011). The model was initialized for SOC stabilization on the three native vegetation sites (EqNV, EpNV, and U1NV) for a period of 7000 a (sufficient to stabilize the initial SOC levels recommended by the model). Moreover, we simulated the cutting and burning process of native vegetation and the process of cultivation and pasture in the present period. In addition to simulating the current study period, we also extrapolated the cultivation until 2100 to evaluate the behaviors with no changes in management. Finally, we compared the simulated data with observed data to validate the performance of the model in this study. Specifically, the model validation was carried out in two stages: (1) validating the relationship between the observed data and simulated data in the areas of native vegetation, cultivation, and pasture and (2) calibrating the decomposition rates in areas where the simulated data did not reflect the observed data during the first stage. The process of calibration and validation can be found in Bortolon et al. (2012). We modified and set some parameters used in the Century model for irrigated agriculture system, according to Araújo Neto (2019). Specifically, we modified the "AUIRRI" parameter to zero, indicating that automatic irrigation will not be used, and changed the values in the "IRRAMT" parameter, indicating the amount of water that needs to be added to the model. We also carried out a statistical analysis according to Smith et al. (1997). In order to evaluate the performance of the Century model in the areas of native vegetation, cultivation, and pasture, we employed the root mean square error (RMSE), indicating the fitting relationship between the simulated data and observed data, and the percent bias (PBIAS), evaluating the tendency of the simulated data to be higher or lower than the observed data. We also used coefficient of determination (R2), Pearson coefficient (r), and model efficiency (EF) to test the relationship between the simulated data and observed data. Detailed information about the parameterization, calibration, and validation carried out in this study, as well as all modified values in standard files of the model, can be verified in Araújo Neto (2019) and Araújo Neto et al. (2021).
2.4 Meteorological data and future climate scenarios
Meteorological data were used to simulate SOC stock in present period. Historical rainfall data were obtained from the National Water Agency database (https://www.snirh.gov.br/hidroweb/serieshistoricas). For Delmiro Gouveia District, rainfall data during 1937-2015 were used; for Pariconha District, the data observed from the rainfall station in Água Branca District (the nearest station) during 1913-1985 were used; and for Inhapi District, the data observed from the rainfall station in Mata Grande District (the nearest station) during 1961-1991 were used. Air temperature data (maximum and minimum) were obtained using the EstimaT software (Cavalcanti et al., 2006) during 1950-2003 (period available via the software). For the period when air temperature data generated by EstimaT software were unavailable, we followed the previous study (Gois et al., 2005).
For the future period (2015-2100), climate scenarios were obtained using the Eta Regional Climate Model (Eta-HadGEM2-ES and Eta-MIROC5) (Chou et al., 2014) provided by the National Institute for Space Research. Climate scenarios employed in this study were based on representative concentration pathway (RCP) radiative forcing, i.e., RCP4.5 and RCP8.5, representing a radiative forcing of 4.5 and 8.5 W/m2, respectively (Chou et al., 2014; IPCC, 2014). The increase of atmospheric CO2 concentration was also considered when simulating SOC stock in the future period. As proposed by Meinshausen et al. (2011), the values representing the increase of CO2 concentration were input, adopting the initial CO2 concentration of 379 mg/kg at the start of the simulations (default value of 350 mg/kg), reaching 538 and 936 mg/kg at the final CO2 concentration (default value of 700 mg/kg) for RCP4.5 and RCP8.5, respectively. Even if CO2 concentration was adjusted to the level representing its emissions in a future period, it was necessary to change the plant growth rate associated with the increase of CO2 concentration. In Century model, the default value for the plant growth rate was equal to 0.0 and we changed this number to 2.0. Despite the current CO2 concentration in the troposphere was close to 410 mg/kg, the increase of atmospheric CO2 was not considered for the present period.
2.5 Calculation of systematic errors under climate scenarios
There were systematic errors in air temperature and rainfall data (difference between the observed and simulated data), which was mainly caused by physical processes of converting the global model into the regional model. Therefore, it was necessary to verify the magnitude of systematic errors.
For air temperature, we calculated the systematic errors according to the study conducted by Carvalho et al. (2015), and the formula is as follows:
where TEMPEta is the air temperature simulated by different nested Eta Regional Climate Models under climate scenarios (°C); and TEMPobs is the observed air temperature during 1960-2005 (°C).
When correcting air temperature, we used a series of data to calculate the systematic errors for the first period (1960-1983) and the second period (1984-2005). This correction method was also used by Carvalho et al. (2015).
However, the approach used to correct the systematic errors in air temperature was not suitable for rainfall data. The correction of rainfall was defined by Hempel et al. (2013) as:
where c is the systematic errors of rainfall; RiOBS is the monthly values of the observed rainfall (mm); and RiEta is the monthly values of the simulated rainfall under climate scenarios using different models in the current period (mm). The period for each district is as follows: (1) Delmiro Gouveia District: 1960-2005 (45 a); (2) Pariconha District: 1960-1985 (25 a); and (3) Inhapi District: 1961-1991 (30 a).
We applied the following formula to calculate the rainfall data in the future period (2014-2100):
where
2.6 The simulation of Soil organic carbon (SOC) stock under climate scenarios using the Century model
We used the Century model to simulate SOC stock at different sites. In order to use the model efficiently, it was necessary to input some data to the Century model, such as crop, soil (texture, bulk density, and pH), and climate (rainfall and air temperature) parameters (Parton et al., 1993). In this study, the model has been calibrated and validated, and more specific information about these processes can be found in previous study (Araújo Neto, 2019, 2021). It was therefore possible to simulate SOC stock during the present (1800-2017) and future (2017-2100) periods. To assess the effects of climate change on SOC stock, we simulated the following nine scenarios in this study: (1) a baseline scenario (reference) using the data of mean rainfall, maximum air temperature, and minimum air temperature in the study areas; (2) four scenarios using air temperature and rainfall data from the Eta-HadGEM2-ES and Eta-MIROC5 models under RCP4.5 and RCP8.5 climate scenarios in rainfed agriculture system; and (3) four scenarios using air temperature and rainfall data from the Eta-HadGEM2-ES and Eta-MIROC5 models under RCP4.5 and RCP8.5 climate scenarios in irrigated agriculture system.
3 Results and discussion
3.1 Results of air temperature using the Eta-HadGEM2-ES and Eta-MIROC5 models
The Eta-HadGEM2-ES model was suitable for temperature changes in the current climate scenario. The results indicated that the Eta-HadGEM2-ES model underestimated minimum and maximum air temperature in Pariconha and Inhapi districts, while maximum air temperature was overestimated in Delmiro Gouveia District from June to August (Table 3). In Pariconha and Inhapi districts, the underestimated values of maximum air temperature (i.e., the simulated values were lower than the observed values) occurred from June to August, varying from 0.1°C to 0.7°C in Pariconha District and from 0.4°C to 1.1°C in Inhapi District. However, for minimum air temperature, the systematic errors were very high, with air temperature underestimated by up to 4.0°C in the three districts (Table 3). The systematic errors of air temperature were higher in dry months (form October to April). The systematic errors of minimum and maximum air temperature were less than 1.0°C and 1.1°C, respectively, indicating that the model was efficient once the data were corrected. In general, for maximum air temperature, the difference between simulated values and observed values was 3.0%, 3.1%, and 3.1% in Delmiro Gouveia, Pariconha, and Inhapi districts, respectively; for minimum air temperature, the difference was 1.3%, 2.1%, and 2.4% in Delmiro Gouveia, Pariconha, and Inhapi districts, respectively.
Table 3 Maximum and minimum air temperature in different month from 1960 to 2005 using the Eta-HadGEM2-ES and Eta-MIROC5 models in Delmiro Gouveia, Pariconha, and Inhapi districts
| Month | Eta-HadGEM2-ES | |||||||||||||||||
|---|---|---|---|---|---|---|---|---|---|---|---|---|---|---|---|---|---|---|
| Delmiro Gouveia District | Pariconha District | Inhapi District | ||||||||||||||||
| Tmin (°C) | Tmax (°C) | Tmin (°C) | Tmax (°C) | Tmin (°C) | Tmax (°C) | |||||||||||||
| Obs | Sim | Corr | Obs | Sim | Corr | Obs | Sim | Corr | Obs | Sim | Corr | Obs | Sim | Corr | Obs | Sim | Corr | |
| Jan | 21.2 | 18.2 | 21.2 | 34.5 | 32.7 | 35.2 | 21.2 | 18.1 | 21.3 | 34.5 | 31.8 | 35.2 | 21.2 | 18.1 | 21.3 | 34.5 | 31.5 | 35.2 |
| Feb | 21.5 | 19.6 | 22.1 | 34.6 | 32.4 | 34.9 | 21.5 | 19.2 | 22.0 | 34.6 | 31.5 | 34.8 | 21.5 | 19.1 | 21.9 | 34.6 | 31.3 | 34.9 |
| Mar | 21.6 | 19.7 | 21.7 | 34.3 | 32.4 | 34.5 | 21.6 | 19.4 | 21.7 | 34.3 | 31.6 | 34.5 | 21.6 | 19.3 | 21.7 | 34.3 | 31.4 | 34.5 |
| Apr | 21.2 | 18.4 | 20.9 | 32.6 | 31.1 | 33.0 | 21.2 | 18.2 | 21.0 | 32.6 | 30.3 | 33.0 | 21.2 | 18.1 | 21.0 | 32.6 | 30.0 | 33.0 |
| May | 20.3 | 17.1 | 20.2 | 29.6 | 29.4 | 30.0 | 20.3 | 17.0 | 20.3 | 29.6 | 28.7 | 30.1 | 20.3 | 17.0 | 20.3 | 29.6 | 28.3 | 30.1 |
| Jun | 19.2 | 15.5 | 18.9 | 28.0 | 28.5 | 28.5 | 19.2 | 15.6 | 19.0 | 28.0 | 27.7 | 28.5 | 19.2 | 15.7 | 19.0 | 28.0 | 27.4 | 28.5 |
| Jul | 18.3 | 14.9 | 18.2 | 27.4 | 28.4 | 27.8 | 18.3 | 15.1 | 18.2 | 27.4 | 27.7 | 27.8 | 18.3 | 15.1 | 18.2 | 27.4 | 27.3 | 27.8 |
| Aug | 18.1 | 15.0 | 17.8 | 28.2 | 29.2 | 28.6 | 18.1 | 15.1 | 17.9 | 28.2 | 28.4 | 28.5 | 18.1 | 15.1 | 17.9 | 28.2 | 28.0 | 28.6 |
| Sep | 19.1 | 15.7 | 18.8 | 30.7 | 30.7 | 31.1 | 19.1 | 15.8 | 18.8 | 30.7 | 30.0 | 31.0 | 19.1 | 15.8 | 18.8 | 30.7 | 29.7 | 31.0 |
| Oct | 20.2 | 16.7 | 20.2 | 33.4 | 32.1 | 34.0 | 20.2 | 16.7 | 20.2 | 33.4 | 31.3 | 34.0 | 20.2 | 16.6 | 20.1 | 33.4 | 31.0 | 34.0 |
| Nov | 21.0 | 17.3 | 21.0 | 34.8 | 32.9 | 35.8 | 21.0 | 17.3 | 21.0 | 34.8 | 32.2 | 35.8 | 21.0 | 17.3 | 21.0 | 34.8 | 31.9 | 35.9 |
| Dec | 21.2 | 18.0 | 21.2 | 34.6 | 32.9 | 35.3 | 21.2 | 17.9 | 21.2 | 34.6 | 32.1 | 35.3 | 21.2 | 17.9 | 21.2 | 34.6 | 31.8 | 35.3 |
| Month | Eta-MIROC5 | |||||||||||||||||
| Delmiro Gouveia District | Pariconha District | Inhapi District | ||||||||||||||||
| Tmin (°C) | Tmax (°C) | Tmin (°C) | Tmax (°C) | Tmin (°C) | Tmax (°C) | |||||||||||||
| Obs | Sim | Corr | Obs | Sim | Corr | Obs | Sim | Corr | Obs | Sim | Corr | Obs | Sim | Corr | Obs | Sim | Corr | |
| Jan | 21.2 | 17.6 | 20.7 | 34.5 | 29.7 | 32.2 | 21.2 | 17.3 | 20.5 | 34.5 | 28.8 | 32.2 | 21.2 | 17.2 | 20.4 | 34.5 | 28.4 | 32.0 |
| Feb | 21.5 | 18.5 | 21.1 | 34.6 | 29.2 | 31.7 | 21.5 | 18.0 | 20.8 | 34.6 | 28.4 | 31.7 | 21.5 | 17.9 | 20.7 | 34.6 | 28.0 | 31.6 |
| Mar | 21.6 | 18.9 | 20.9 | 34.3 | 28.8 | 30.9 | 21.6 | 18.3 | 20.7 | 34.3 | 28.0 | 30.9 | 21.6 | 18.2 | 20.6 | 34.3 | 27.6 | 30.8 |
| Apr | 21.2 | 18.2 | 20.7 | 32.6 | 27.4 | 29.3 | 21.2 | 17.7 | 20.4 | 32.6 | 26.5 | 29.1 | 21.2 | 17.5 | 20.4 | 32.6 | 26.0 | 29.0 |
| May | 20.3 | 17.0 | 20.2 | 29.6 | 26.4 | 27.0 | 20.3 | 16.7 | 20.0 | 29.6 | 25.6 | 27.0 | 20.3 | 16.6 | 20.0 | 29.6 | 25.1 | 26.8 |
| Jun | 19.2 | 16.4 | 19.7 | 28.0 | 26.2 | 26.2 | 19.2 | 16.2 | 19.5 | 28.0 | 25.5 | 26.2 | 19.2 | 16.1 | 19.5 | 28.0 | 25.0 | 26.1 |
| Jul | 18.3 | 15.4 | 18.6 | 27.4 | 26.6 | 26.0 | 18.3 | 15.3 | 18.4 | 27.4 | 25.9 | 26.0 | 18.3 | 15.2 | 18.3 | 27.4 | 25.5 | 25.9 |
| Aug | 18.1 | 14.6 | 17.5 | 28.2 | 27.2 | 26.5 | 18.1 | 14.6 | 17.3 | 28.2 | 26.4 | 26.6 | 18.1 | 14.5 | 17.3 | 28.2 | 26.0 | 26.5 |
| Sep | 19.1 | 14.8 | 17.9 | 30.7 | 28.9 | 29.3 | 19.1 | 14.7 | 17.8 | 30.7 | 28.3 | 29.3 | 19.1 | 14.6 | 17.7 | 30.7 | 27.9 | 29.3 |
| Oct | 20.2 | 15.3 | 18.8 | 33.4 | 30.7 | 32.6 | 20.2 | 15.2 | 18.7 | 33.4 | 30.0 | 32.6 | 20.2 | 15.1 | 18.6 | 33.4 | 29.6 | 32.6 |
| Nov | 21.0 | 16.6 | 20.2 | 34.8 | 31.3 | 34.2 | 21.0 | 16.3 | 20.0 | 34.8 | 30.6 | 34.3 | 21.0 | 16.3 | 20.0 | 34.8 | 30.3 | 34.3 |
| Dec | 21.2 | 17.4 | 20.6 | 34.6 | 30.8 | 33.2 | 21.2 | 17.1 | 20.4 | 34.6 | 30.0 | 33.2 | 21.2 | 17.0 | 20.3 | 34.6 | 29.6 | 33.1 |
Note: Tmin, minimum air temperature; Tmax, maximum air temperature; Obs, observed air temperature; Sim, simulated air temperature; Corr, corrected air temperature.
The Eta-MIROC5 model also showed good performance in relation to the historical period (Table 3). When comparing minimum air temperature and maximum air temperature, it can be seen that maximum air temperature showed smaller systematic errors during June-September. Delmiro Gouveia District showed the smallest systematic errors before the data generated by the Eta-MIROC5 model was corrected, with maximum systematic errors of 4.4°C for minimum air temperature and 5.6°C for maximum air temperature. The correction efficiency showed that the systematic errors varied from 1.4°C of minimum air temperature in Delmiro Gouveia District to 3.6°C of maximum air temperature in Inhapi District. It can be seen that the Eta-MIROC5 model was satisfactory in correcting air temperature, but its systematic errors were greater than the Eta-HadGEM2-ES model, which indicated the Eta-HadGEM2-ES model was effective in estimating air temperature.
When simulating the corrected data in future scenarios, it can be seen that there was a temperature difference between RCP4.5 and RCP8.5 (Table 4). This difference was caused by the performance of the model in relation to radiative forcing, because the temperature will rise when the solar radiation in the atmosphere increased. The results showed that there was a difference in the mean air temperature between 2006 and 2100 under RCP4.5 of the Eta-HadGEM2-ES model, while a smaller difference was seen under RCP8.5 of the Eta-MIROC5 model. Delmiro Gouveia District showed the greatest rise in mean air temperature during 2006-2100 (4.8°C) under RCP8.5 of the Eta-HadGEM2-ES model, while Delmiro Gouveia and Pariconha districts had an increase of 3.2°C and 3.3°C, respectively, under RCP8.5 of the Eta-MIROC5 model.
Table 4 Mean air temperature in 2006 and 2100 and air temperature difference between the two years under RCP4.5 and RCP8.5 climate scenarios using the Eta-HadGEM2-ES and Eta-MIROC5 models in Delmiro Gouveia, Pariconha, and Inhapi districts
| Climate scenario | Eta-HadGEM2-ES model | ||||||||
|---|---|---|---|---|---|---|---|---|---|
| Delmiro Gouveia District | Pariconha District | Inhapi District | |||||||
| T2006 | T2100 | Difference | T2006 | T2100 | Difference | T2006 | T2100 | Difference | |
| RCP4.5 | 26.5 | 28.3 | 1.8 | 26.5 | 28.3 | 1.8 | 26.6 | 28.3 | 1.7 |
| RCP8.5 | 26.5 | 31.2 | 4.8 | 26.5 | 31.2 | 4.7 | 26.5 | 31.2 | 4.7 |
| Climate scenario | Eta-MIROC5 model | ||||||||
| Delmiro Gouveia District | Pariconha District | Inhapi District | |||||||
| T2006 | T2100 | Difference | T2006 | T2100 | Difference | T2006 | T2100 | Difference | |
| RCP4.5 | 26.0 | 27.5 | 1.5 | 26.0 | 27.5 | 1.5 | 26.0 | 27.5 | 1.5 |
| RCP8.5 | 25.7 | 29.0 | 3.2 | 25.8 | 29.1 | 3.3 | 25.8 | 29.1 | 3.3 |
Note: T2006, mean air temperature in 2006; T2100, mean air temperature in 2100; difference, air temperature difference between 2006 and 2100.
Carvalho et al. (2015) carried out a similar analysis using the Eta-CPTEC model in Pernambuco State of Brazil and found that temperature increased by up to 5.0°C until 2100. The results are similar to this study, but the climate in Pernambuco State is different from this study (humid and semi-arid, respectively), which has a significant impact on agriculture systems and soil dynamics. According to IPCC (2014), the temperature increase may reach 2.0°C (RCP4.5) and 4.0°C (RCP8.5) by 2100. Some studies indicated that the global mean temperature may rise by 1.8°C and 4.0°C by 2100. If the population and economy continue to grow rapidly and the massive consumption of fossil fuels is maintained, the temperature may reach 6.4°C (IPCC, 2014). These simulations are crucial for socio-economic impacts, as they can help rural producers and decision-makers develop new strategies to make better use of land. Climate change, with an increase in temperature approximately 4.0°C (Table 4), can identify possible precautions related to agriculture management, especially in soil management, the utilization of new cultivation practices, or even the adoption of other crops in the region.
3.2 Results of rainfall from the Eta-HadGEM2-ES and Eta-MIROC5 models
The rainfall estimated by the Eta-HadGEM2-ES and Eta-MIROC5 models showed the variation among different months (Fig. 1). The Eta-HadGEM2-ES model underestimated the rainfall data in the three districts, with the greater underestimated values in Pariconha and Inhapi districts (Fig. 1a-c). The mean underestimated value simulated by the Eta-HadGEM2-ES model was 240.5, 199.1, and 235.5 mm in Delmiro Gouveia, Pariconha, and Inhapi districts, respectively, indicating it was underestimated by 53.0%, 80.0%, and 78.0% compared with the observed rainfall data. However, compared with the observed data, the Eta-MIROC5 model overestimated the rainfall data, especially in Pariconha and Inhapi districts during January-April and in Delmiro Gouveia District during January-May (Fig. 1d-f). It can be seen that, after correction, the simulated data in the two models were similar to the observed data in the three districts, which indicated that the correction was of fundamental importance for the simulation of future periods.
Fig. 1
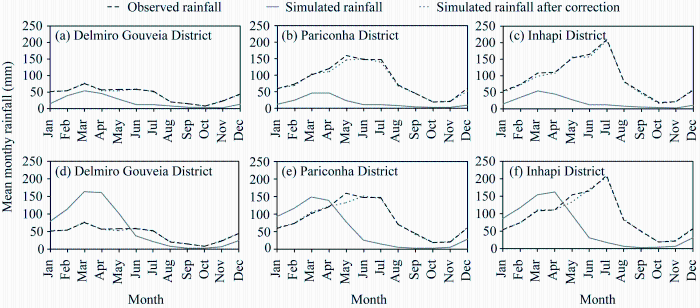
Fig. 1
Observed mean monthly rainfall, simulated mean monthly rainfall, and simulated mean monthly rainfall after correction using Eta-HadGEM2-ES (a, b, and c) and Eta-MIROC5 (d, e, and f) models in Delmiro Gouveia, Pariconha, and Inhapi districts
For the Eta-HadGEM2-ES and Eta-MIROC5 models, climate scenarios (RCP4.5 and RCP8.5) showed that the annual rainfall was low in 2100 in the three districts, with a mean reduction of 29.2% compared with 2006 (Fig. 2). Carvalho et al. (2015) conducted a similar analysis using climate scenarios from Eta Regional Climate Model in Pernambuco State of Brazil, and the results indicated that the rainfall decreased by 44% in 2100. The reduction in rainfall was high in both study areas, but due to different climates (semi-arid in this study and humid in Pernambuco State), the impacts may be different. Rainfall in the semi-arid region of Northeast Brazil has decreased significantly due to drought (Carvalho et al., 2020). During 2012-2013, most of the semi-arid region suffered extensive and intensive vegetation drought, accounting for about 85% of the region (Marengo et al., 2016). The impacts on rainfall could be more serious because the climate models predict that, in the most pessimistic scenarios, temperature will rise above 4.0°C by the end of the century. It should also be noted that the Eta-HadGEM2-ES model simulated an increase in rainfall under RCP4.5 climate scenario from 2031 to 2085. This increase can be seen in the last few years of the simulated RCP8.5 climate scenario, particularly in Inhapi District (Fig. 2c), with an increase of approximately 1500 mm above mean rainfall.
Fig. 2
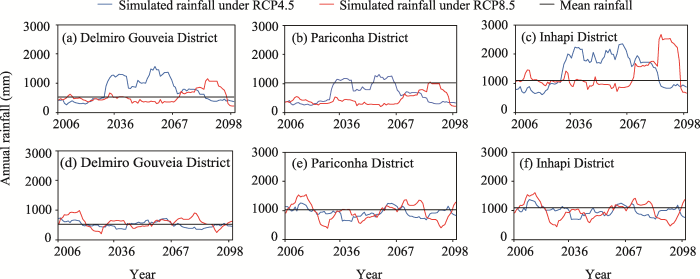
Fig. 2
Simulated annual rainfall under RCP4.5 and RCP8.5 climate scenarios using Eta-HadGEM2-ES (a, b, and c) and Eta-MIROC5 (d, e, and f) models during 2006-2100 in Delmiro Gouveia, Pariconha, and Inhapi districts. Mean rainfall is the average of simulated annual rainfall under baseline scenario.
3.3 SOC stock in rainfed and irrigated agriculture systems
3.3.1 SOC stock in rainfed agriculture system
SOC stock simulated by the Century model for the present and future periods under rainfed agriculture system was shown in Figure 3. Compared with RCP4.5 and RCP8.5 climate scenarios, SOC stock was lower under the baseline scenario. The greatest reduction in SOC stock occurred in EqCC4 site of Delmiro Gouveia District; while other sites also showed a high reduction, e.g., EpPa10 (30.6%) and EpCC4 (30.2%) sites in Pariconha District as well as EqCC15 (27.2%) site in Delmiro Gouveia District. The UlCC30 site of Inhapi District showed the smallest reduction in SOC stock, with a variation of 2.1%. When comparing the different soil types, SOC stock varied from 1544 g/m2 in Quartzipsamment (Delmiro Gouveia District) to 2898 g/m2 in Ultisol (Inhapi District). SOC stock had also been evaluated in areas of Caatinga vegetation in Northeast Brazil under different forest managements, and the results indicated that burning or residues had little effect on SOC stock under the current climate (Althoff et al., 2016, 2018).
The reduction of SOC stock could be even greater due to the impact of climate change. When comparing RCP4.5 and RCP8.5 climate scenarios with baseline scenario, some regions showed a greater reduction trend. Delmiro Gouveia District showed the greatest reduction in SOC stock by 2100, with the variation from 5.4% to 11.2% at EqCC15 site and from 3.3% to 9.4% at EqCC4 site. The reduction of SOC stock was less intense, with the variation from 2.6% to 6.3% in the Pariconha District and from 0.6% to 3.7% in the Inhapi District. Althoff et al. (2016) estimated that due to climate change, SOC stock will be reduced by approximately 10%-15% by 2100 in the semi-arid region of Paraíba State in Brazil. However, the reductions of SOC stock may be even greater due to the management measures adopted in agroforestry areas. Considering the 20-year cycle of cutting the native vegetation and the impacts of climate change, SOC stock would be reduced by 20%-30% by the end of this century (Althoff et al., 2016). It was worth noting that according to the climate model, SOC stock increased in some regions, for example, UlCC30 site in Inhapi District and EpPa10 site in Pariconha District. The increase of SOC stock was also related to land use and management, such as no-tillage system, integrated crop-livestock systems, and integrated crop-livestock-forest systems (Cidin, 2016).
The Eta-HadGEM2-ES model showed a greater reduction in SOC stock, especially in Delmiro Gouveia District, while the Eta-MIROC5 model presented a smaller reduction (Fig. 3). Furthermore, for RCP4.5 and RCP8.5 climate scenarios, the results also differed according to the climate model used. The RCP4.5 climate scenario showed greater reductions in SOC stock than RCP8.5 climate scenario in the Eta-HadGEM2-ES model, particularly in Delmiro Gouveia District. However, it should be noted that SOC stock in the semi-arid region of Brazil was relatively low, and any carbon losses, even small, may further impair the soil quality, especially sandy soil without the mechanisms of carbon stabilization/retention.
Fig. 3
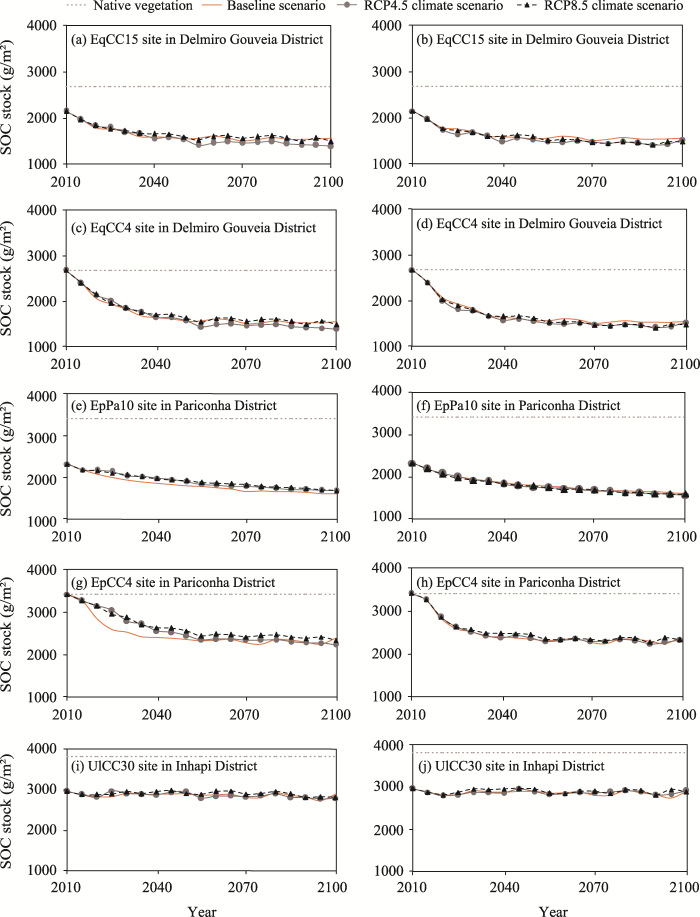
Fig. 3
SOC stock in rainfed agriculture system under RCP4.5 and RCP 8.5 climate scenarios using the Eta-HadGEM2-ES (a, c, e, g, and i) and Eta-MIROC5 (b, d, f, h, and j) models in Delmiro Gouveia, Pariconha, and Inhapi districts
3.3.2 SOC stock under irrigated agriculture system
In the irrigated agriculture systems, SOC stock increased in the almost all scenarios and models (Fig. 4), ranging from 6.2% to 18.4% in 2100 compared with the baseline scenario. The Delmiro Gouveia District showed the greatest increase in SOC stock during 2010-2100, varying from 14.0% to 18.3% on EqCC4 site and from 11.1% to 14.0% on EqCC15 site. The increase in SOC stock was less intense, with changes ranging from 10.9% to 11.6% on UlCC30 site and 6.2% to 8.9% on EpCC4 site. Only the EpPa10 site showed a reduction in SOC stock under irrigated agriculture system, ranging from 4.3% to 8.8%. The RCP8.5 climate scenario (both Eta-HadGEM2-ES and Eta-MIROC5 models) tended to show a greater increase in SOC stock by 2100. That is, under each agriculture system, the RCP8.5 climate scenario promoted the reduction of carbon loss and the recovery trend of SOC stock in some cases, such as on EqCC15 and EqCC4 sites. It can also be seen that the carbon loss was closely related to the soil texture, since UlCC30 site showed a smaller carbon loss over time.
Fig. 4
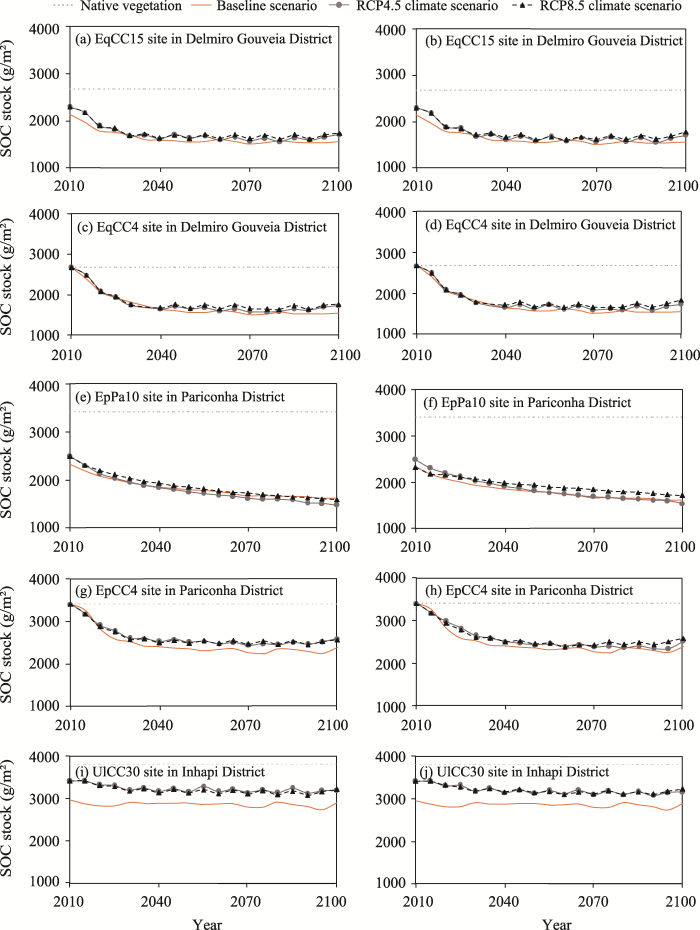
Fig. 4
SOC stock in irrigated agriculture system under RCP4.5 and RCP 8.5 climate scenarios using the Eta-HadGEM2-ES (a, c, e, g, and i) and Eta-MIROC5 (b, d, f, h, and j) models in Delmiro Gouveia, Pariconha, and Inhapi districts
In this context, the irrigated agriculture system became an alternative to decrease carbon loss. However, it was important to remember that the availability of water in this region is limited, requiring sustainable irrigation management. The irrigated area in the semi-arid region of Brazil was 4.7×10³ km2 with a potential increase to 7.1×10³ km2 until 2030 (National Water Agency, 2017). Therefore, new technologies for the sustainable use of irrigation must be adopted in the semi-arid regions as a strategy to expand the irrigated area and promote the mitigation of greenhouse gas emissions. On the other hand, the climate change can also affect the availability of water resources and may influence the development of agriculture activities, especially in irrigated system (Rossato et al., 2017).
The smaller carbon loss in CPR8.5 climate scenario may be related to the physiology of C4 plants, such as maize, due to the efficiency of the photosynthetic process. Similar results have been observed in the Northeast Brazil (Carvalho et al., 2015). C4 plants can reduce themselves transpiration rate and maintain the water ratio, so as to reduce the water use of the whole plant and conserve soil moisture. On the contrary, water stress will reduce plant stomatal conductance, limit photosynthesis, and reduce yield (Ghannoum et al., 2000; Leakey, 2009). It was worth noting that the carbon accumulation was high in soil, which was mainly due to the root system, not only through the decomposition of dead roots, but also via exudates (Guareschi and Pereira, 2013).
4 Conclusions
This study involves mitigating greenhouse gas emissions and promoting carbon sequestration through the adoption of different management practices in agriculture systems. The Century model can identify the possible impacts of climate change through the changes of SOC stock observed in different management practices. In this way, the model can contribute to identify improvements in public policies related to climate change and use new technologies that help mitigate greenhouse gases.
Our results showed that the Eta-HadGEM2-ES model was effective in estimating air temperature, and the rainfall simulated by the Eta-HadGEM2-ES and Eta-MIROC5 models after correction was similar to the observed data. In rainfed agriculture system, SOC stock under the baseline scenario was lower than that under RCP4.5 and RCP8.5 climate scenarios, and the reduction of SOC stock could be even greater due to the impact of climate change. In irrigated agriculture system, SOC stock in the almost all climate scenarios (RCP4.5 and RCP8.5) and models (Eta-HadGEM2-ES and Eta-MIROC5) will increase by 2100. But, the RCP8.5 climate scenario tended to show a greater increase in SOC stock, as it promoted the reduction of carbon loss and the recovery trend of SOC stock. In addition to rainfed and irrigated agriculture systems, future studies should assess the impact of other agriculture systems or practices on SOC stock under climate change.
Acknowledgements
This study was supported by the the National Council for Scientific and Technological Development of Brazil and Ministry of Science, Technology, Innovation (MCTI) of Brazil (383697/2015-8). We are grateful for the Federal University of Pernambuco and the University of So Paulo. We also thank the Brazilian Research Network on Global Climate Change (Rede Clima), which provided the scholarship to Renato Américo ARAÚJO-NETO.
Reference
Managing soil carbon for climate change mitigation and adaptation in Mediterranean cropping systems: A meta-analysis
Climate change impacts on the sustainability of the firewood harvest and vegetation and soil carbon stocks in a tropical dry forest in Santa Teresinha Municipality, Northeast Brazil
Adaptation of the century model to simulate C and N dynamics of Caatinga dry forest before and after deforestation
Tillage and cropping effects on soil organic carbon in Mediterranean semiarid agroecosystems: Testing the Century model
Potential soil carbon sequestration in a semiarid Mediterranean agroecosystem under climate change: Quantifying management and climate effects
Use of the Century model in soil carbon dynamics in the semiarid region of Alagoas:future climate scenarios in irrigated and rainfed environments
Simulation of soil carbon changes due to conventional systems in the semi-arid region of Brazil: adaptation and validation of the century model
Dry matter, carbon and nitrogen of soybean and maize roots in no-tillage and conventional tillage
Validation of the Century model to estimate the impact of agriculture on soil organic carbon in Southern Brazil
Potential to use the century model and GIS to assess the impact of agriculture on regional soil organic carbon stocks
Simulation of management and soil interactions impacting SOC dynamics in sugarcane using the CENTURY model
Impact of climate changes on potential sugarcane yield in Pernambuco, northeastern region of Brazil
Impacts of extreme climate events on Brazilian agricultural production
Computer program for the estimation of air temperature for the Northeast region of Brazil
Modeling changes in soil organic matter in Amazon forest to pasture conversion with the Century model
Assessment of climate change over South America under RCP 4.5 and 8.5 downscaling scenarios
Carbon stock in Brazilian soils and potential contribution to the mitigation of greenhouse gas emissions. MSc Thesis
Semiarid Region of Paraíba: A Territorial Review
Manual of Soil Analysis Methods
Research and Development Bulletin (Climatology of the State of Alagoas)
The transposition of the waters of the São Francisco River in the response to the drought in the Brazilian Northeast: Chronology of the transformation of the idea into a work
The growth response of C4 plants to rising atmospheric CO2 partial pressure: a reassessment
Characterization of desertification in the state of Alagoas using climatic variables
Carbon, light organic matter and oxidizable fractions of organic carbon under alley systems
Estimation of potential and crop evapotranspiration
A trend-preserving bias correction-the ISI-MIP approach
Mitigation of Climate Change. Working Group III Contribution to the Fifth Assessment Report of the Intergovernmental Panel on Climate Change
The significance of soils and soil science towards realization of the United Nations Sustainable Development Goals
Soil-related Sustainable Development Goals: Four concepts to make land degradation neutrality and restoration work
Rising atmospheric carbon dioxide concentration and the future of C4 crops for food and fuel
Century model of soil organic matter dynamics: Equations and assumptions
Pesticides in the semiarid region of Alagoas: chemical-dependent agriculture and its contradictions
A simple formula for estimating evapotranspiration rates in various climates, using temperature data alone
Soil carbon and the mitigation of global climate change
Brazil's future climate
The RCP greenhouse gas concentrations and their extensions from 1765 to 2300
Adaptation and mitigation to climate change: contribution of soil ecosystem services
Model evaluation guidelines for systematic quantification of accuracy in watershed simulations
Climate and rainwater in the semiarid
Atlas Irrigation: Water Use in Irrigated Agriculture
Straw uses trade-off only after soil organic carbon steady-state
Long-term organic farming on a citrus plantation results in soil organic carbon recovery
Observations and modeling of biomass and soil organic matter dynamics for the grassland biome worldwide
Impact of soil moisture on crop yields over Brazilian semiarid
Physical quality of a Latosol under no-tillage and conventional tillage in the semi-arid region
Modelling SOC response to land use change and management practices in sugarcane cultivation in South-Central Brazil
A comparison of the performance of nine soil organic matter models using datasets from seven long-term experiments
Impacts of land-based greenhouse gas removal options on ecosystem services and the United Nations Sustainable Development Goals
A Century 5 model using for estimation of soil organic matter behaviour at predicted climate change
Desertification, climate change and droughts in the Brazilian semiarid region: a literature review
Soil as a basis to create enabling conditions for transitions towards sustainable land management as a key to achieve the SDGs by 2030
