| Research article |
|


|
|
|
| Concentrations, sources, and influential factors of water- soluble ions of atmospheric particles in Dunhuang Mogao Grottoes, a world heritage site in China |
YANG Xiaoju1,2,3,4, WU Fasi1,2, XU Ruihong1,2, LI Na5, ZHANG Zhengmo1,2, XUE Ping1,2, WANG Wanfu1,2, ZHAO Xueyong3,*( ) ) |
1National Research Center for Conservation of Ancient Wall Paintings and Earthen Sites, Dunhuang Academy, Dunhuang 736200, China
2Gansu Provincial Research Center for Conservation of Dunhang Cultural Heritage, Dunhuang 736200, China
3Naiman Desertification Research Station/Urat Desert-Grassland Research Station, Northwest Institute of Eco-Environment and Resources, Chinese Academy of Sciences, Lanzhou 730000, China
4University of Chinese Academy of Sciences, Beijing 100049, China
5Chinese Academy of Cultural Heritage, Beijing 100049, China |
|
|
|
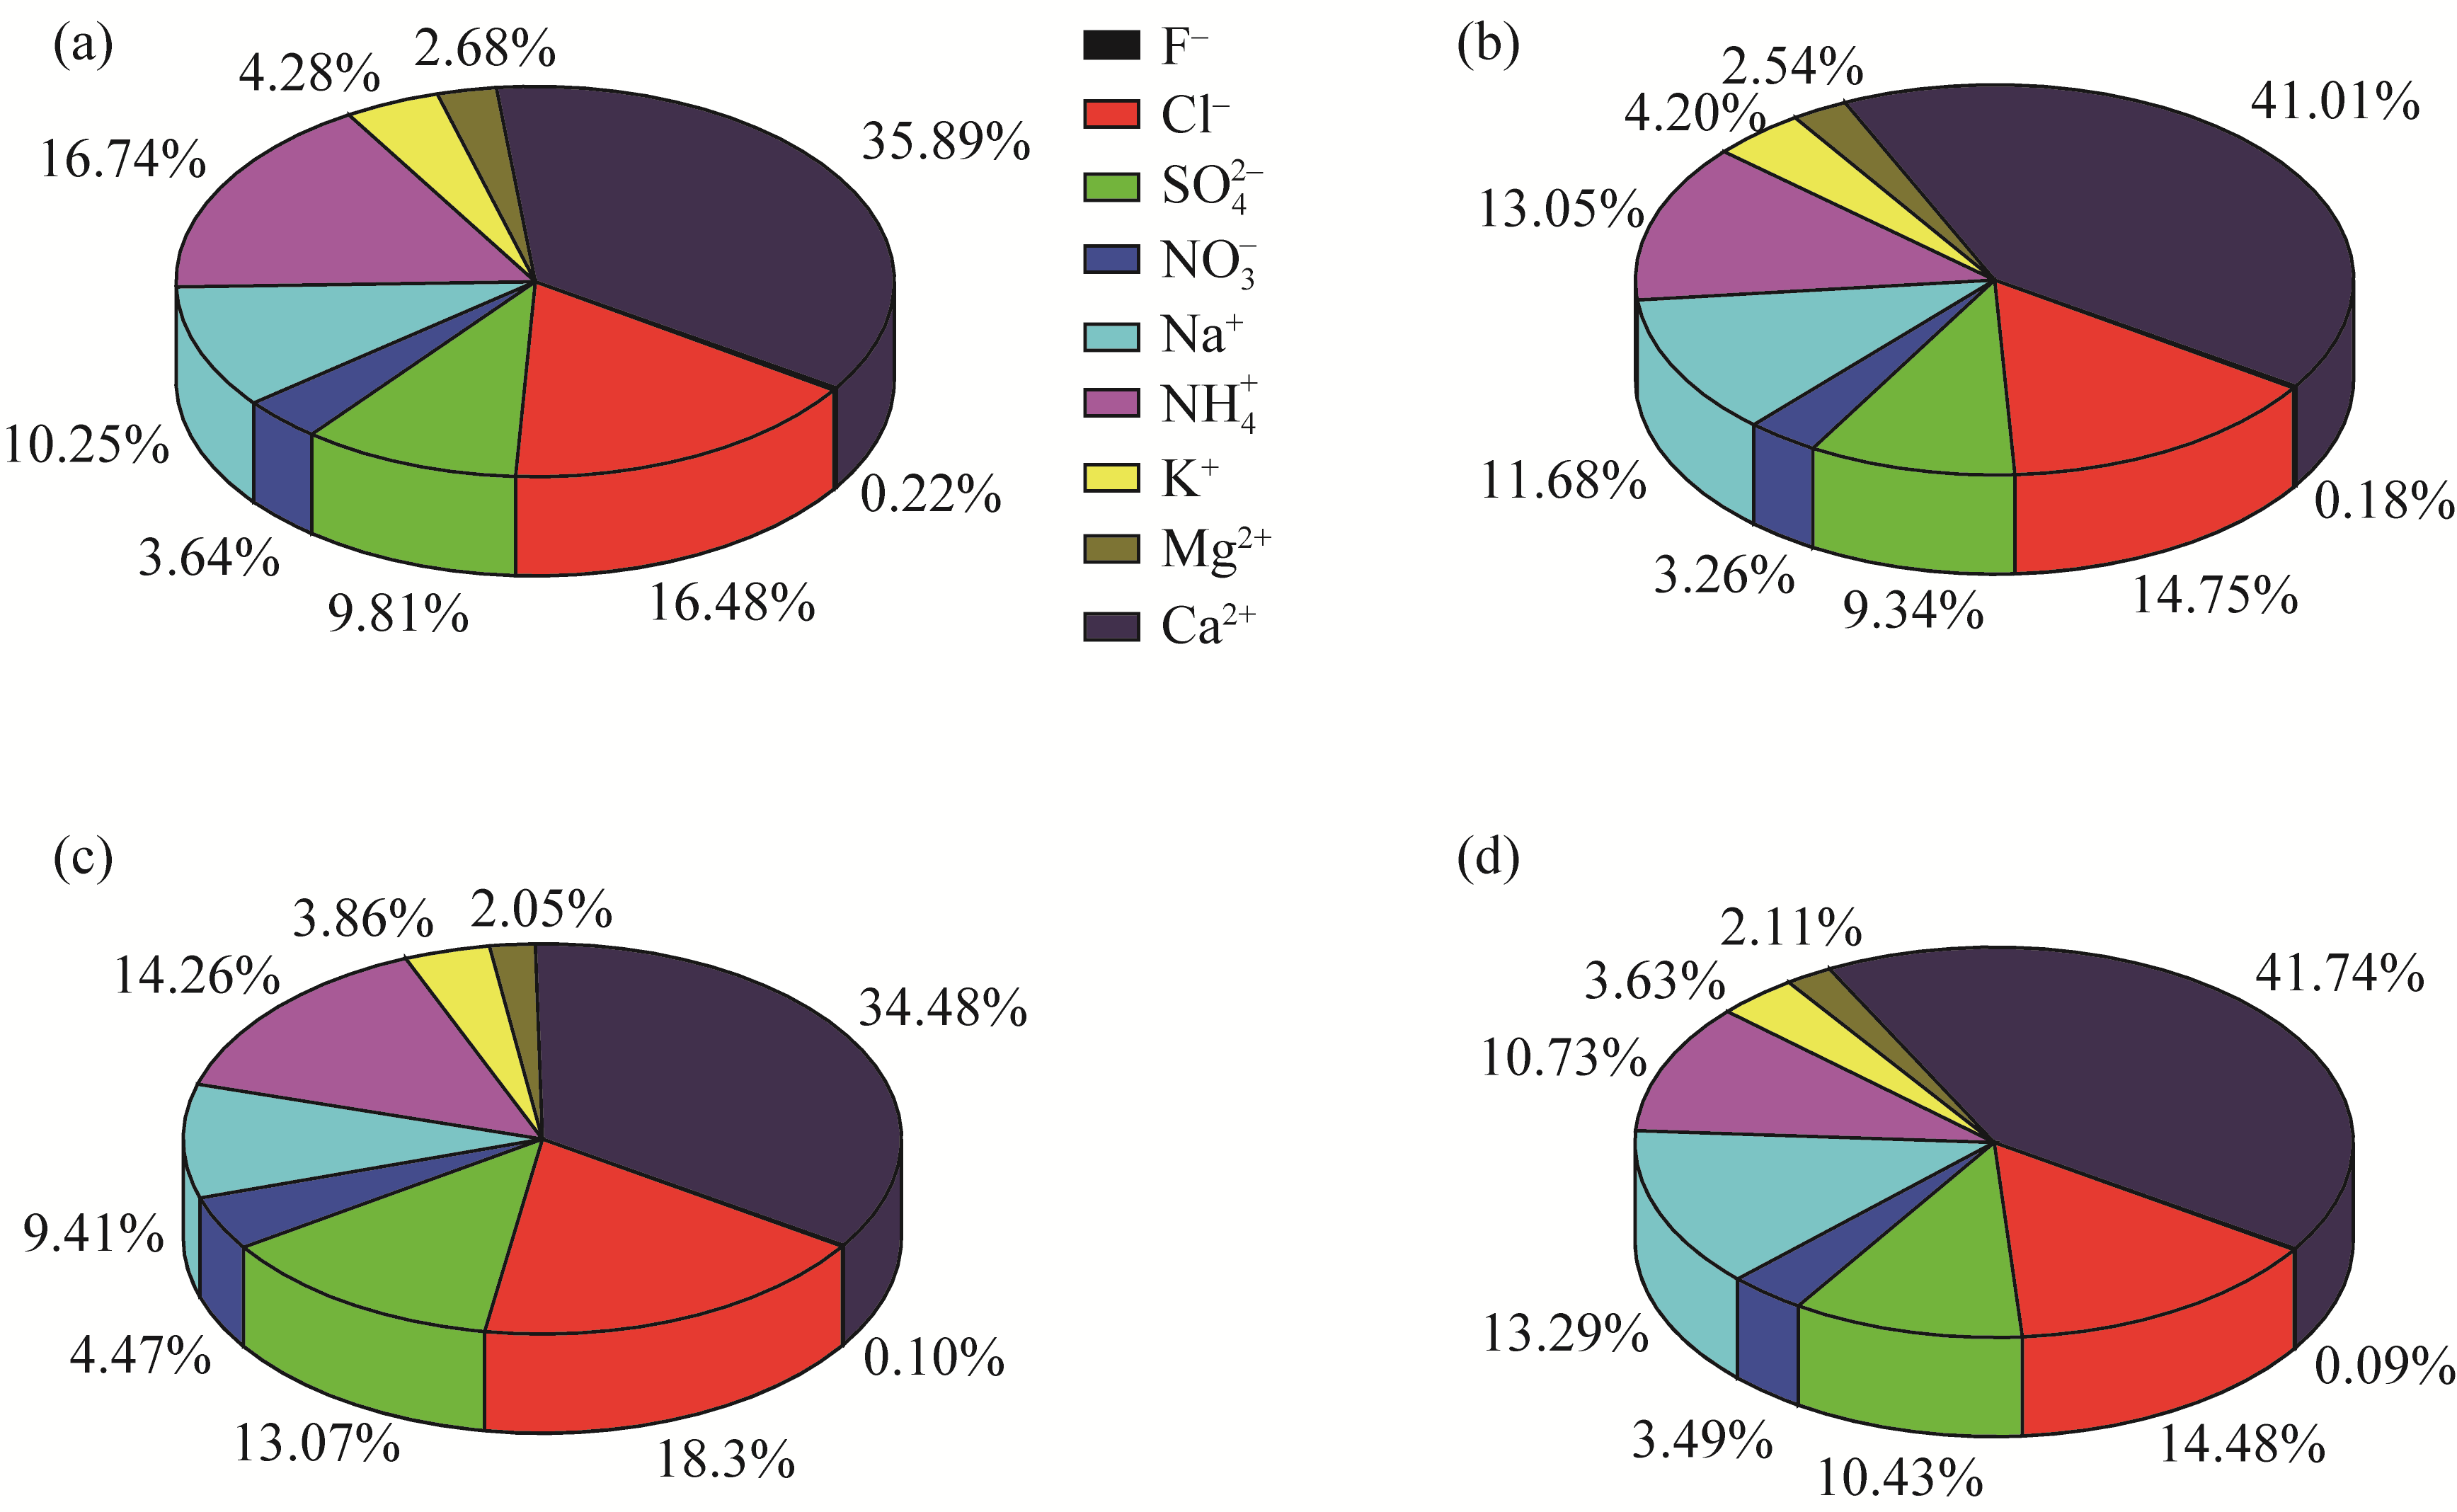
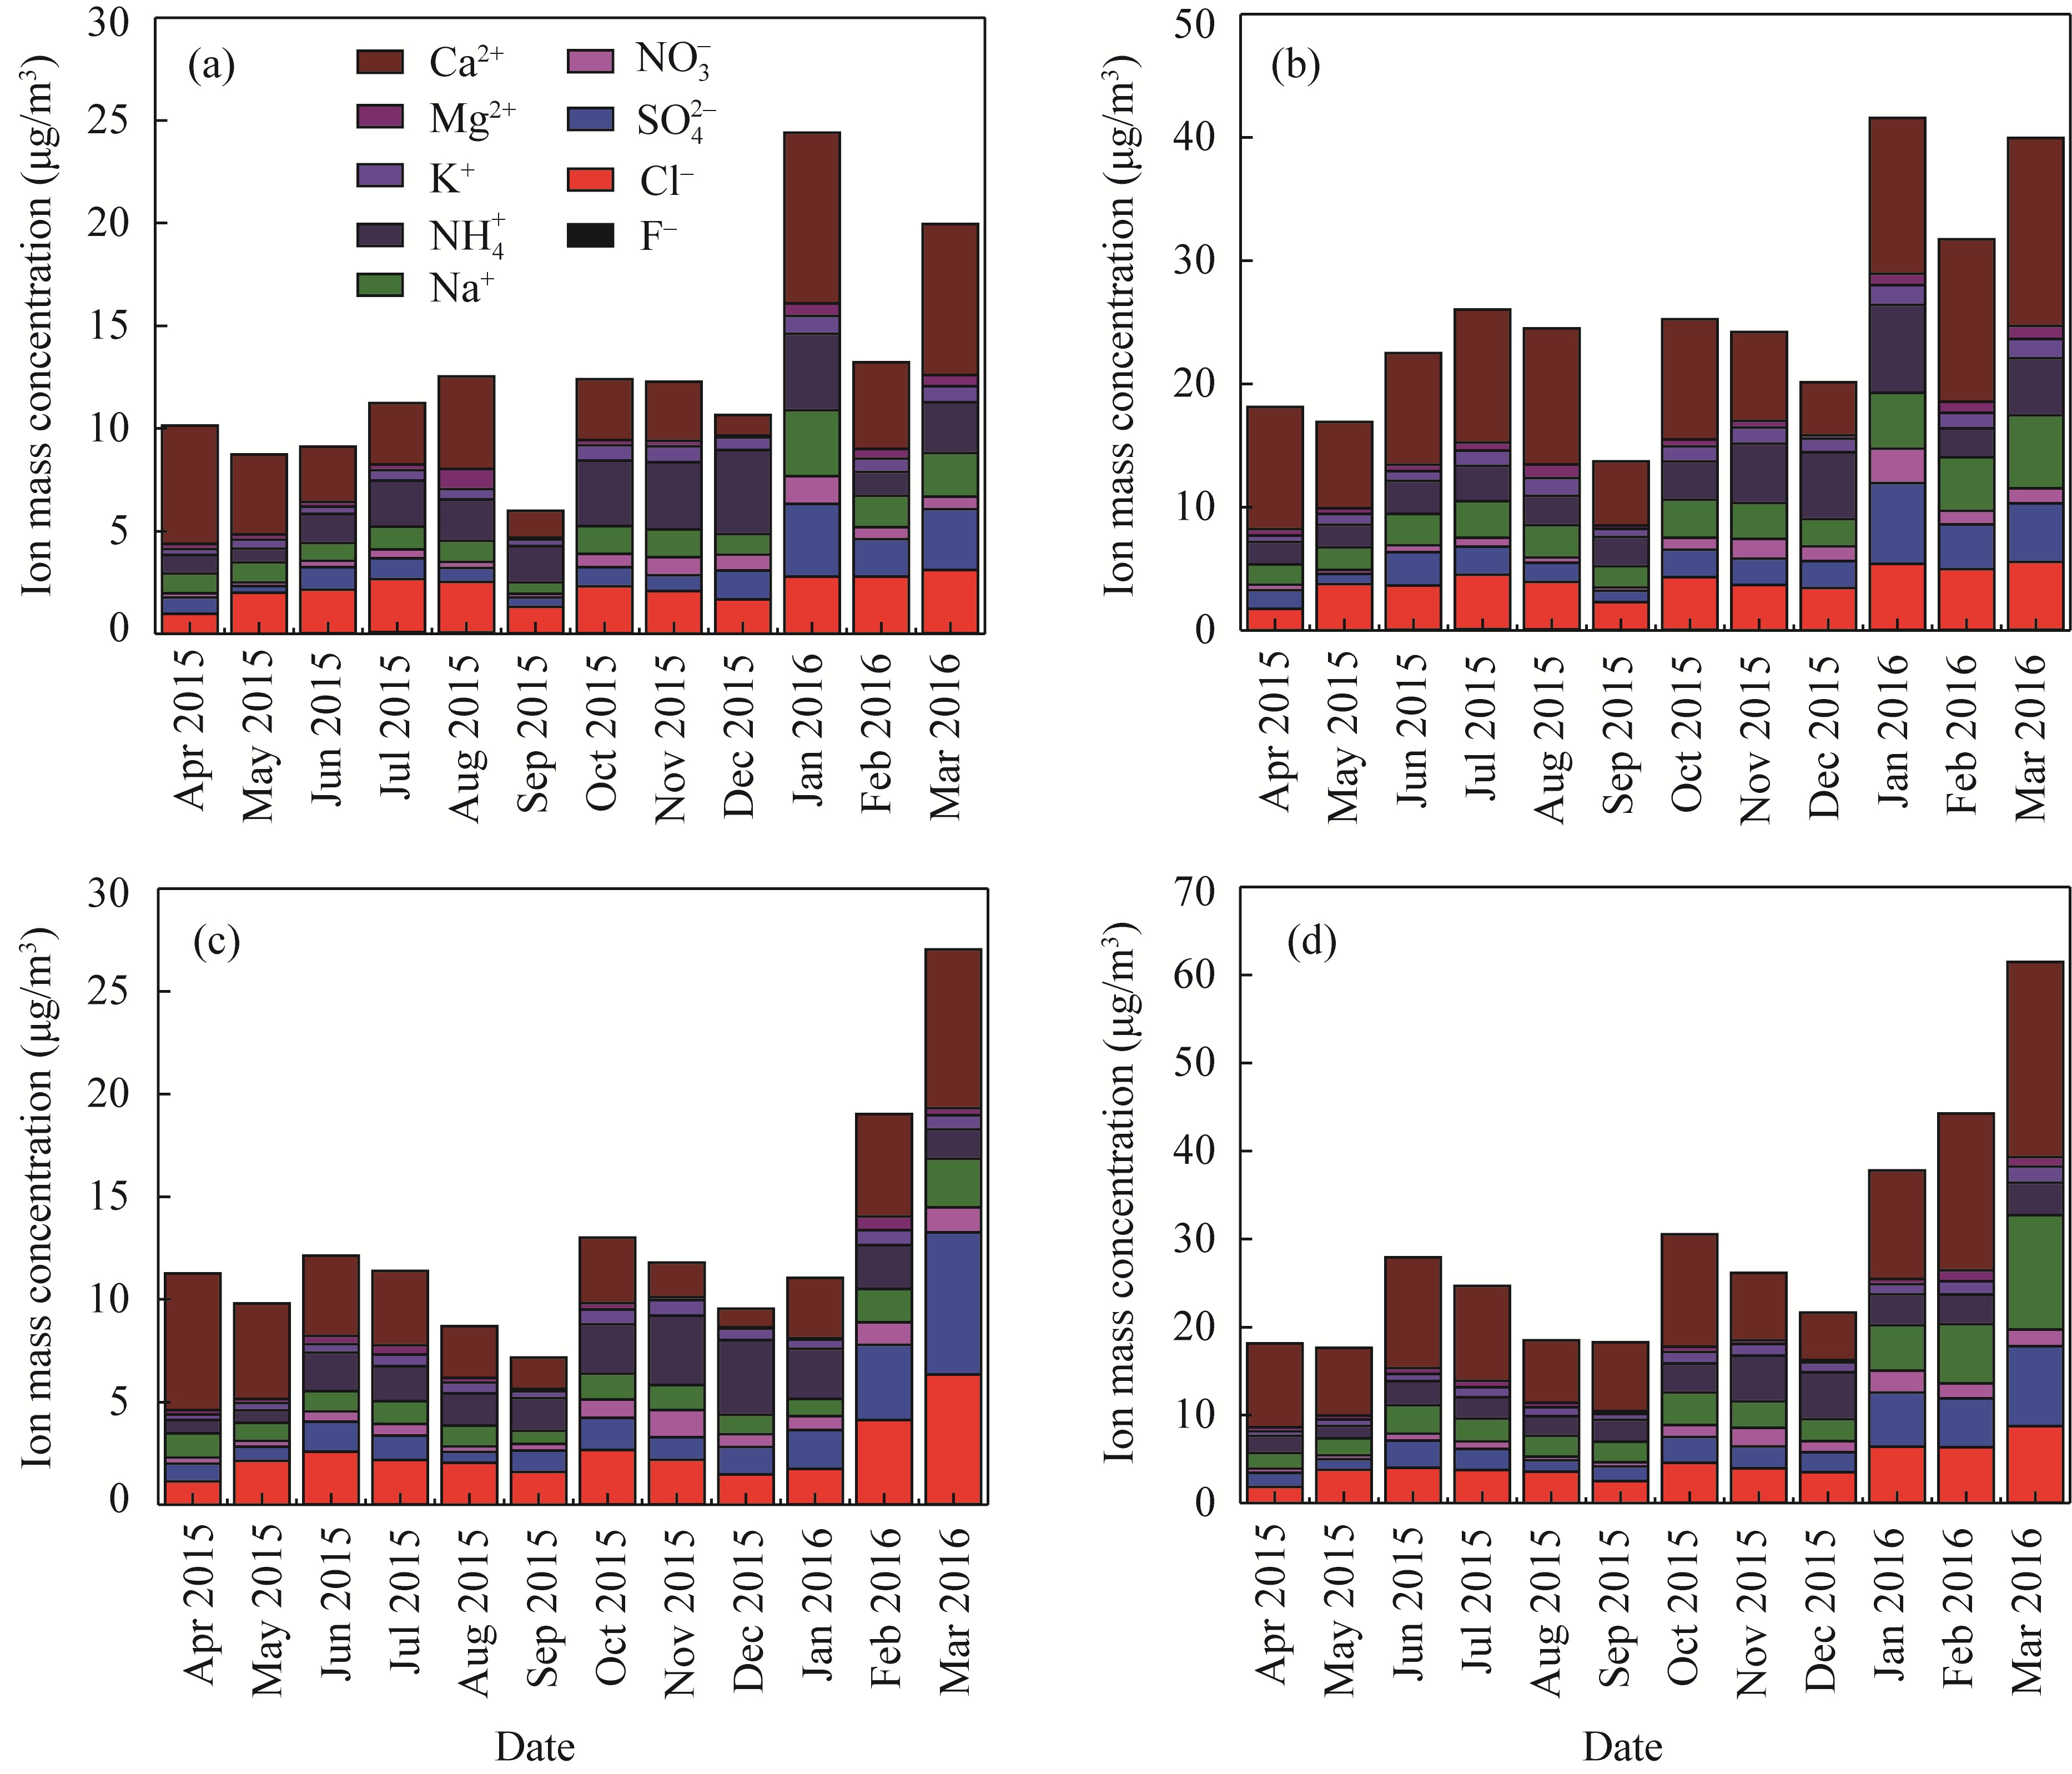
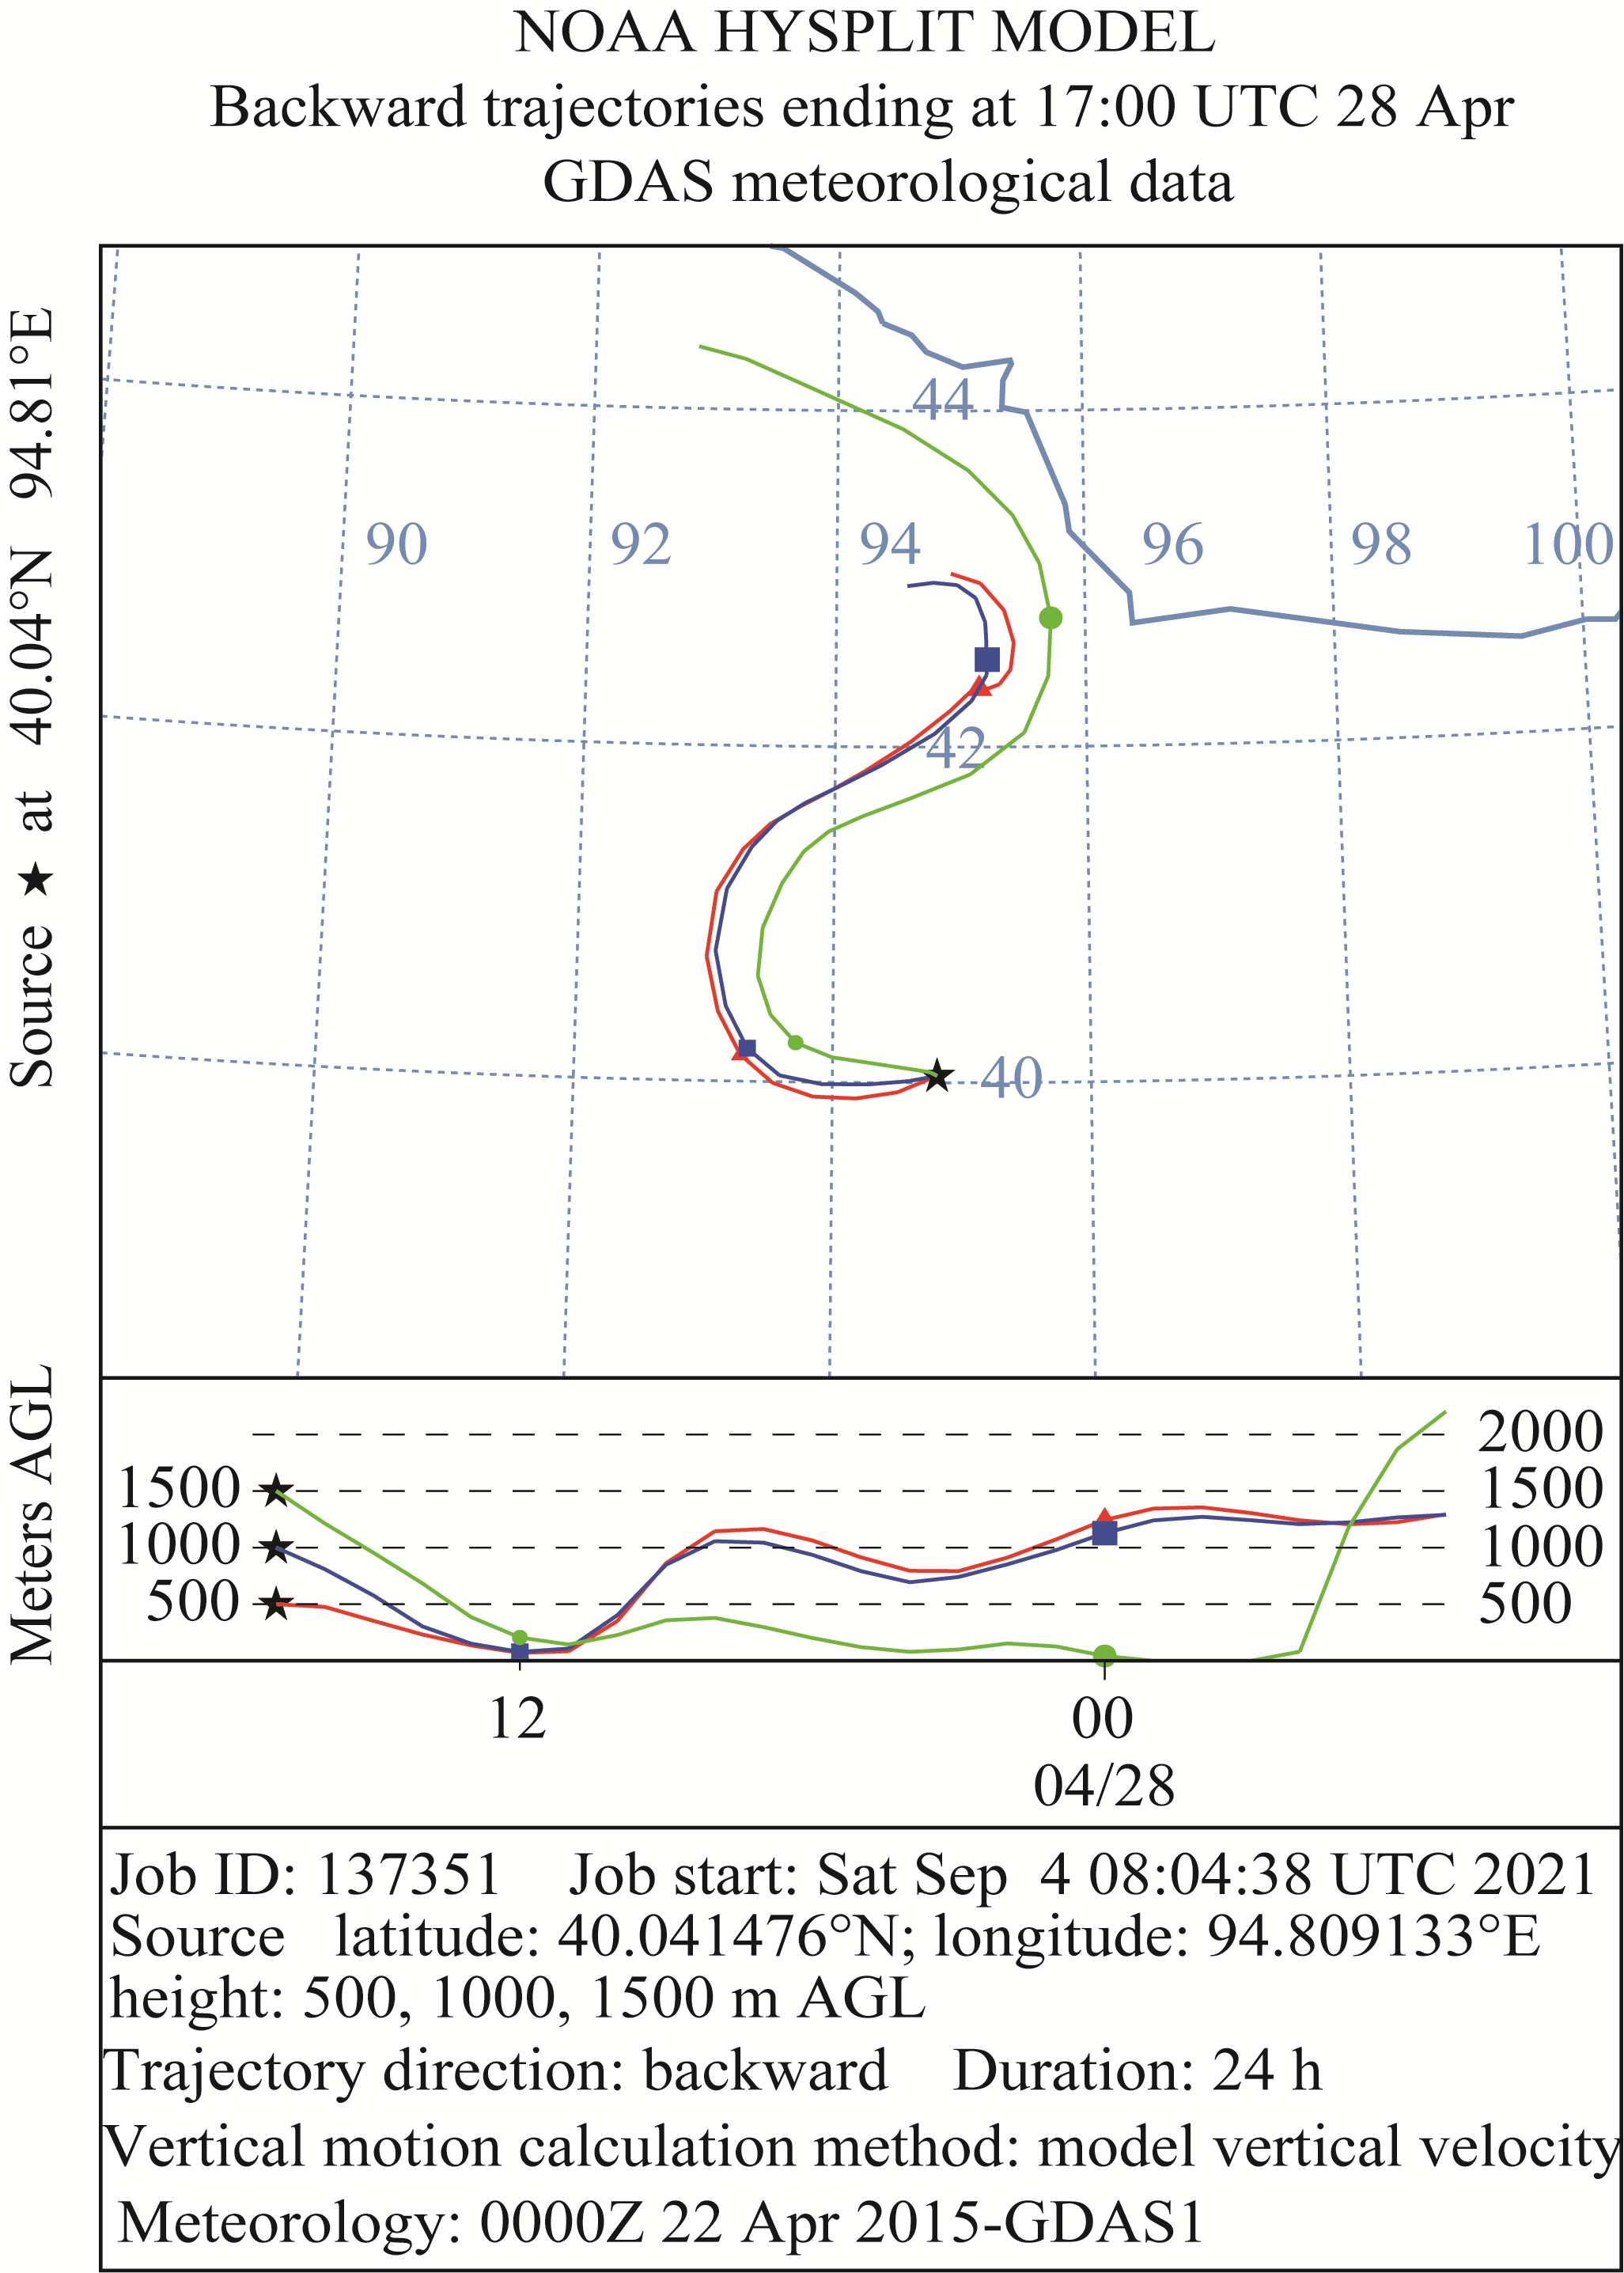
Abstract Atmospheric particle pollution is one of the major factors leading to degradation of ancient wall paintings, particularly heritage sites in arid and semi-arid regions. However, current systematic research on the changes, sources, and influential factors of atmospheric particulate matter and its water-soluble ion concentrations is not sufficient. Thus, the major water-soluble ion concentrations, sources, and influential factors of atmospheric particles PM2.5 and PM10 (particulate matter with an aerodynamic equivalent diameter ≤2.5 and 10.0 μm, respectively, in ambient air) were collected from Cave 16 and its ambient exterior environment in the Dunhuang Mogao Grottoes, China, between April 2015 and March 2016. Results showed that the concentrations of PM2.5 and PM10 inside and outside the cave were the highest in March 2016 and the lowest in December 2015. The higher particle concentration from March to May was related to the frequent occurrence of sand and dust events, and the lower particle concentration from June to September was associated with good diffusion conditions, increased precipitation, and an established cave shelterbelt. The concentration of particulate matter inside the cave was affected by the concentration of particles in the air outside the cave. Ca2+, NH+ 4, Na+, Cl-, and SO2- 4were the main components of the total ions of PM2.5 and PM10 both inside and outside the cave. The total ions inside the cave were frequently affected by the disturbance of tourists' activities during the peak tourist season from May to August. Under the influence of dust, the total concentrations of Cl-, SO2- 4, Na+, NH+ 4, and Ca2+ in particles of different sizes inside and outside the cave increased, and the concentrations of Cl-, SO2- 4, Na+, and Ca2+ decreased during precipitation period. Backward air mass trajectory analysis suggested that the pollutants were mainly from Xinjiang, China. The pollutant sources of air particulates are straw burning, secondary pollution sources, soil dust, dry spring rivers, and tourist activities.
|
|
Received: 26 June 2022
Published: 31 December 2022
|
|
Corresponding Authors:
*ZHAO Xueyong (E-mail: zhaoxy@lzb.ac.cn)
|
| Cite this article:
YANG Xiaoju, WU Fasi, XU Ruihong, LI Na, ZHANG Zhengmo, XUE Ping, WANG Wanfu, ZHAO Xueyong. Concentrations, sources, and influential factors of water- soluble ions of atmospheric particles in Dunhuang Mogao Grottoes, a world heritage site in China. Journal of Arid Land, 2022, 14(12): 1395-1412.
URL:
http://jal.xjegi.com/10.1007/s40333-022-0036-6 OR http://jal.xjegi.com/Y2022/V14/I12/1395
|
|
|
| [1] |
Abbott A. 2010. Ancient Italian artefacts get the blues. Nature, 466: 306-307.
|
|
|
| [2] |
Agnew N. 2004. Conservation of ancient sites on the Silk Road. In: AgnewN.The 2nd International Conference on the Conservation of Grotto Sites, Mogao Grottoes, Dunhuang. Los Angeles: Getty Publications, 3-30.
|
|
|
| [3] |
Bouchlaghem K, Nsom B, Latrache N, et al. 2009. Impact of Saharan dust on PM10 concentration in the Mediterranean Tunisian coasts. Atmospheric Research, 92(4): 531-539.
doi: 10.1016/j.atmosres.2009.02.009
|
|
|
| [4] |
Brimblecombe P. 1990. The composition of museum atmospheres. Atmospheric Environment Part B Urban Atmosphere, 24(1): 1-8.
doi: 10.1016/0957-1272(90)90003-D
|
|
|
| [5] |
Broughton L. 1875. Report of commission on the site for a new National Gallery. In: BroughtonL. British Sessional Papers. London: House of Commons, 2: 24.
|
|
|
| [6] |
Cao J J, Rong B, Lee S C, et al. 2005. Composition of indoor aerosols at Emperor Qin's Terra-cotta Museum, Xi'an, China, during summer. China Particuology, 3(3): 170-175.
doi: 10.1016/S1672-2515(07)60081-5
|
|
|
| [7] |
Chatoutsidou S E, Maskova L, Ondrackova L, et al. 2015. Modeling of the aerosol infiltration characteristics in a cultural heritage building: The baroque library hall in prague. Building and Environment, 89: 253-263.
doi: 10.1016/j.buildenv.2015.02.029
|
|
|
| [8] |
Chen B, Stein A F, Maldonado P G, et al. 2013. Size distribution and concentrations of heavy metals in atmospheric aerosols originating from industrial emissions as predicted by the HYSPLIT model. Atmospheric Environment, 71: 234-244.
doi: 10.1016/j.atmosenv.2013.02.013
|
|
|
| [9] |
Demas M, Agnew N, Fan J. 2015. Strategies for Sustainable Tourism at the Mogao Grottoes of Dunhuang, China. Dordrecht: Springer, 1-114.
|
|
|
| [10] |
Deng J L, Jiang L M, Miao W W, et al. 2022. Characteristics of fine particulate matter (PM2.5) at Jinsha Site Museum, Chengdu, China. Environmental Science and Pollution Research, 29(1): 1173-1183.
doi: 10.1007/s11356-021-15743-z
|
|
|
| [11] |
Fan J. 2000. The conservation and management of the Mogao Grottoes, Dunhuang. Dunhuang Research, 63(1): 1-4. (in Chinese)
|
|
|
| [12] |
Ghedini N, Gobbi G, Sabbioni C, et al. 2000. Determination of elemental and organic carbon on damaged stone monuments. Atmospheric Environment, 34 (25): 4383-4391.
doi: 10.1016/S1352-2310(00)00250-8
|
|
|
| [13] |
Ghedini N, Ozga I, Bonazza A, et al. 2011. Atmospheric aerosol monitoring as a strategy for the preventive conservation of urban monumental heritage: The Florence Baptistery. Atmospheric Environment, 45(33): 5979-5987.
doi: 10.1016/j.atmosenv.2011.08.001
|
|
|
| [14] |
Guan Q, Cai A, Wang F, et al. 2017. Spatio-temporal variability of particulate matter in the key part of Gansu Province, western China. Environmental Pollution, 230: 189-198.
doi: S0269-7491(17)31267-8
pmid: 28651090
|
|
|
| [15] |
Guan Q Y, Luo H P, Pan N H, et al. 2019. Contribution of dust in northern China to PM10 concentrations over the Hexi Corridor. Science of the Total Environment, 660(10): 947-958.
doi: 10.1016/j.scitotenv.2018.12.412
|
|
|
| [16] |
Hanapia N, Din S A M. 2012. A study on the airborne particulates matter in selected museums of Peninsular Malaysia. Procedia-Social and Behavioral Sciences, 50: 602-613.
doi: 10.1016/j.sbspro.2012.08.063
|
|
|
| [17] |
He D P, Wu F S, Xu R H, et al. 2020. Characteristics of atmospheric particulates and organic carbon in Dunhuang Mogao Grottoes. Journal of Lanzhou Jiaotong University, 39(6): 92-98. (in Chinese)
|
|
|
| [18] |
Hu T F, Lee S C, Cao J J, et al. 2009. Characterization of winter airborne particles at Emperor Qin's Terra-cotta Museum, China. Science of the Total Environment, 407(20): 5319-5327.
doi: 10.1016/j.scitotenv.2009.06.044
|
|
|
| [19] |
Jia W T, Hu T F, Cao J J, et al. 2015. Characterization of microclimate and aerosol inside the Display Hall of Burial Pits at the Hanyangling Museum. Journal of Earth Environment, 6(5): 307-316. (in Chinese)
|
|
|
| [20] |
Jin Z L, Chen G Q, Xia Y, et al. 2015. Comparative study of salt damage caused by sulfates and chlorides to mural paintings-evidence of superpenetration, migration and crystallization destruction resulting from sodium sulfate. Sciences of Conservation and Archaeology, 7(1): 29-38. (in Chinese)
|
|
|
| [21] |
Li C L, Yan F P, Kang S C, et al. 2016. Concentration, sources, and flux of dissolved organic carbon of precipitation at Lhasa City, the Tibetan Plateau. Environmental Science and Pollution Research, 23(13): 12915-12921.
doi: 10.1007/s11356-016-6455-1
|
|
|
| [22] |
Li G S, Qu J J, Wang W F, et al. 2012. Overall efficiency of a V shaped nylon net fence in preventing sand damage to the Mogao Grottoes. Sciences in Cold and Arid Regions, 4(2): 163-174.
doi: 10.3724/SP.J.1226.2012.00163
|
|
|
| [23] |
Li G S, Wang W F, Qu J J, et al. 2013. Study on temperature and humidity environment of grotto 72 at the Mogao Grottoes in Dunhuang, China. International Journal of Climatology, 33(8): 1863-1872.
doi: 10.1002/joc.3553
|
|
|
| [24] |
Li H, Gao Y, Wang C, et al. 2014. Evaluation and analysis of air quality impact in the pottery storage-room of the Emperor Qin Shihuang's Mausoleum Site Museum. Sciences Conservation and Archaeology, 26(1): 34-41. (in Chinese)
|
|
|
| [25] |
Li H, Wang W, Zhan H, et al. 2017. Measurement and analysis of the yearly characteristics of deep-buried phreatic evaporation in a hyper-arid area. Acta Ecologica Sinica, 37(1): 53-59.
doi: 10.1016/j.chnaes.2016.10.001
|
|
|
| [26] |
Li H, Hu T F, Du W S. 2019. Comparison of site environments of Emperor Qin's Terracotta Warriors and Horses Museum and Han Yangling Museum. Conservation of Cultural Relics and Archaeological Science, 31(2): 53-60.. (in Chinese)
|
|
|
| [27] |
Li H S, Wang W F, Zhan H T, et al. 2015. Water in the Mogao Grottoes, China: Where it comes from and how it is driven. Journal of Arid Land, 7(1): 37-45.
doi: 10.1007/s40333-014-0072-y
|
|
|
| [28] |
Li J, Pósfai M, Hobbs P V, et al. 2003. Individual aerosol particles from biomass burning in southern Africa: 2, Compositions and aging of inorganic particles. Journal of Geophysical Research, 108(D13): 8484, doi:10.1029/2002JD002310.
doi: 10.1029/2002JD002310
|
|
|
| [29] |
Li L, An J Y, Zhou M, et al. 2015. Source apportionment of fine particles and its chemical components over the Yangtze River Delta, China during a heavy haze pollution episode. Atmospheric Environment, 123: 415-429.
doi: 10.1016/j.atmosenv.2015.06.051
|
|
|
| [30] |
Liu H L, Wang X D, Guo Q L, et al. 2020. Experimental investigation on the correlation between rainfall infiltration and the deterioration of wall paintings at Mogao Grottoes, China. Bulletin of Engineering Geology and the Environment, 79: 1199-1207.
doi: 10.1007/s10064-019-01645-5
|
|
|
| [31] |
Mašková L, Smolík J, Ďurovič M. 2017. Characterization of indoor air quality in different archives-possible implications for books and manuscripts. Building Environment, 120: 77-84.
doi: 10.1016/j.buildenv.2017.05.009
|
|
|
| [32] |
Merello P, García-Diego F J, Zarzo M. 2014. Diagnosis of abnormal patterns in multivariate microclimate monitoring: A case study of an open-air archaeological site in Pompeii (Italy). Science of the Total Environment, 488- 489: 14-25.
|
|
|
| [33] |
Mikayama A, Hokoi S, Ogura D. 2015. Effects of drifting sand particles on deterioration of mural paintings on the east wall of Cave 285 in Mogao Caves, Dunhuang. Energy Procedia, 78: 1311-1316.
doi: 10.1016/j.egypro.2015.11.146
|
|
|
| [34] |
Natarajan N, Vasudevan M, Dineshkumar S K, et al. 2022. Effects of air pollution on monumental buildings in India: An overview. Environmental Science and Pollution Research, 29(20): 29399-29408.
doi: 10.1007/s11356-021-14044-9
|
|
|
| [35] |
Ogura D, Hase T, Nakata Y, et al. 2021. Influence of environmental factors on deterioration of mural paintings in Mogao Cave 285, Dunhuang. Case Studies in Building Rehabilitation, 13: 105-159.
|
|
|
| [36] |
Pipal A S, Satsangi P G, Tiwari S, et al. 2014. Study of mineral aerosols in fine (PM2.5) and coarse (PM10) atmospheric particles over a world heritage site at Agra, India. Environmental Technology and Management, 17(6): 538-553.
|
|
|
| [37] |
Plocoste T. 2022. Multiscale analysis of the dynamic relationship between particulate matter (PM10) and meteorological parameters using CEEMDAN: A focus on ''Godzilla'' African dust event. Atmospheric Pollution Research, 13(1): 101252, doi: 10.1016/j.apr.2021.101252.
doi: 10.1016/j.apr.2021.101252
|
|
|
| [38] |
Poulain L, Fahlbusch B, Spindler G, et al. 2021. Source apportionment and impact of long-range transport on carbonaceous aerosol particles in central Germany during HCCT-2010. Atmospheric Chemistry and Physics, 21(5): 3667-3684.
|
|
|
| [39] |
Sabbioni C, Ghedini N, Bonazza A. 2003. Organic anions in damage layers on monuments and buildings. Atmospheric Environment, 37(9-10): 1261-1269.
doi: 10.1016/S1352-2310(02)01025-7
|
|
|
| [40] |
Sakka A, Gerasopoulos E, Liakakou E, et al. 2020. Spatial variability of aerosols over Greek archaeological sites using Space-Borne Remote Sensing. Journal of Cultural Heritage, 46: 207-217.
doi: 10.1016/j.culher.2020.07.001
|
|
|
| [41] |
Singh R, Sharma B S. 2012. Composition, seasonal variation, and sources of PM10 from world heritage site Taj Mahal, Agra. Environmental Monitoring and Assessment, 184(10): 5945-5956.
doi: 10.1007/s10661-011-2392-0
pmid: 22033817
|
|
|
| [42] |
Tai A, Mickley L J, Jacob D J. 2010. Correlations between fine particulate matter (PM2.5) and meteorological variables in the United States: Implications for the sensitivity of PM2.5 to climate change. Atmospheric Environment, 44(32): 3976-3984.
doi: 10.1016/j.atmosenv.2010.06.060
|
|
|
| [43] |
Tan L H, Zhang W M, Qu J J, et al. 2016. Aeolian sediment transport over Gobi: Field studies atop the Mogao Grottoes, China. Aeolian Research, 21: 53-60.
doi: 10.1016/j.aeolia.2016.03.002
|
|
|
| [44] |
Tétreault J. 2003. Airborne Pollutants in Museums, Galleries and Archives: Risk Assessment, Control Strategies, and Preservation Management. Ottawa: Canadian Conservation Institute, 1-168.
|
|
|
| [45] |
Uring P, Chabas A, Alfaro S. 2019. Dust deposition on textile and its evolution in indoor cultural heritage. The European Physical Journal Plus, 134(6): 1-9.
doi: 10.1140/epjp/i2019-12286-x
|
|
|
| [46] |
Vidal F, Vicente R, Silva J M. 2019. Review of environmental and air pollution impacts on built heritage: 10 questions on corrosion and soiling effects for urban intervention. Journal of Cultural Heritage, 37: 273-295.
doi: 10.1016/j.culher.2018.11.006
|
|
|
| [47] |
Wang J H, Ogawa S. 2015. Effects of meteorological conditions on PM2.5 concentrations in Nagasaki, Japan. International Journal of Environmental Research and Public Health, 12(8): 9089-9101.
doi: 10.3390/ijerph120809089
|
|
|
| [48] |
Wang J L, Yan Z F, Wang X D, et al. 2016. Experimental research on mechanical ventilation system for Cave 328 in Mogao Grottoes, Dunhuang, China. Energy and Buildings, 130: 692-696.
doi: 10.1016/j.enbuild.2016.08.086
|
|
|
| [49] |
Wang W F, Ma X, Ma Y T, et al. 2011. Molecular characterization of airborne fungi in caves of the Mogao Grottoes, Dunhuang, China. International Biodeterioration and Biodegradation, 65(5): 726-731.
doi: 10.1016/j.ibiod.2011.04.006
|
|
|
| [50] |
Wang W F. 2018. Prevention and Control of Sand Dunes Hazard in Dunhuang Mogao Grottoes. Beijing: Science Press,2-7. (in Chinese)
|
|
|
| [51] |
Wang X M, Carmichael G R, Chen D L, et al. 2005. Impacts of different emission sources on air quality during March 2001 in the Pearl River Delta (PRD) region. Atmospheric Environment, 39(29): 5227-5241.
doi: 10.1016/j.atmosenv.2005.04.035
|
|
|
| [52] |
Whittlestone S, James J, Barnes C. 2003. The relationship between local climate and radon concentrations in the Temple of Baal, Jenolan Caves, Australia. Helictite, 38: 39-44.
|
|
|
| [53] |
Xu R H, Wu F S, Wang W F, et al. 2020. Chemical elemental characteristics of atmospheric inhalable particulates in Dunhuang Mogao Grottoes. Arid Land Geograpuy, 43(5): 1231-1241. (in Chinese)
|
|
|
| [54] |
Yang X J, Wu F S, Xu R H, et al. 2021. Variation and source analysis of water-soluble ions in the atmospheric particles of Mogao Grottoes at Dunhuang. Plateau Meteorology, 40(2): 436-447. (in Chinese)
doi: 10.7522/j.issn.1000-0534.2020.00033
|
|
|
| [55] |
Yao X, Chan C K, Ming F, et al. 2002. The water-soluble ionic composition of PM2.5 in Shanghai and Beijing, China. Atmospheric Environment, 36(26): 4223-4234.
doi: 10.1016/S1352-2310(02)00342-4
|
|
|
| [56] |
Yao Y, He C, Li S, et al. 2019. Properties of particulate matter and gaseous pollutants in Shandong, China: Daily fluctuation, influencing factors, and spatiotemporal distribution. Science of the Total Environment, 660(2): 384-394.
|
|
|
| [57] |
Zhang E K, Cao J J, Wang X D, et al. 2007. A preliminary study of characterization of indoor and outdoor air quality in Dunhuang Mogao Grottoes. Journal of the Graduate School of the Chinese Academy of Sciences, 24(5): 612-618. (in Chinese)
|
|
|
| [58] |
Zhang G B, Wang W F, Xue P, et al. 2009. Comparative analysis of air exchange rate in typical caves of Mogao Grottoes in Dunhuang. Dunhuang Research, (6): 100-104. (in Chinese)
|
|
|
| [59] |
Zhang G B, Tan L H, Zhang W M, et al. 2022. Temporal variation of airborne dust concentrations in the Mogao Grottoes, Dunhuang, China. Frontiers in Environmental Science, 10: 878466, doi:10.3389/fenvs.2022.878466.
doi: 10.3389/fenvs.2022.878466
|
|
|
| [60] |
Zhou J B, Xing Z Y, Deng J J, et al. 2016. Characterizing and sourcing ambient PM2.5 over key emission regions in China I: Water-soluble ions and carbonaceous fractions. Atmospheric Environment, 135: 20-30.
doi: 10.1016/j.atmosenv.2016.03.054
|
|
|
|
Viewed |
|
|
|
Full text
|
|
|
|
|
Abstract
|
|
|
|
|
Cited |
|
|
|
|
| |
Shared |
|
|
|
|
| |
Discussed |
|
|
|
|