| Research article |
|

|
|
|
| Separating emitted dust from the total suspension in airflow based on the characteristics of PM10 vertical concentration profiles on a Gobi surface in northwestern China |
ZHANG Chunlai1, WANG Xuesong1,2,*( ), CEN Songbo1, ZHENG Zhongquan Charlie3, WANG Zhenting4 ), CEN Songbo1, ZHENG Zhongquan Charlie3, WANG Zhenting4 |
1State Key Laboratory of Earth Surface Processes and Resource Ecology, MOE Engineering Research Center of Desertification and Blown-sand Control, Faculty of Geographical Science, Beijing Normal University, Beijing 100875, China
2School of Environment, Beijing Normal University, Beijing 100875, China
3Aerospace Engineering Department, University of Kansas, Lawrence, KS 66045-7621, USA
4Northwest Institute of Eco-Environment and Resources, Chinese Academy of Sciences, Lanzhou 730000, China |
|
|
|
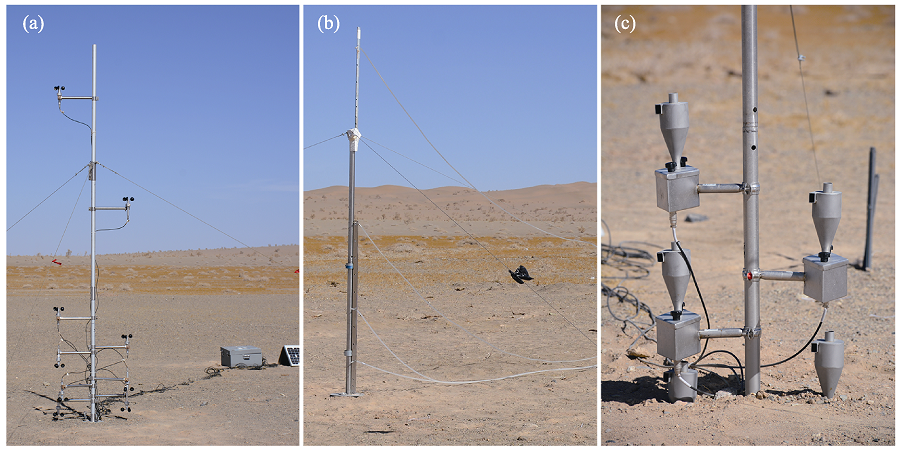
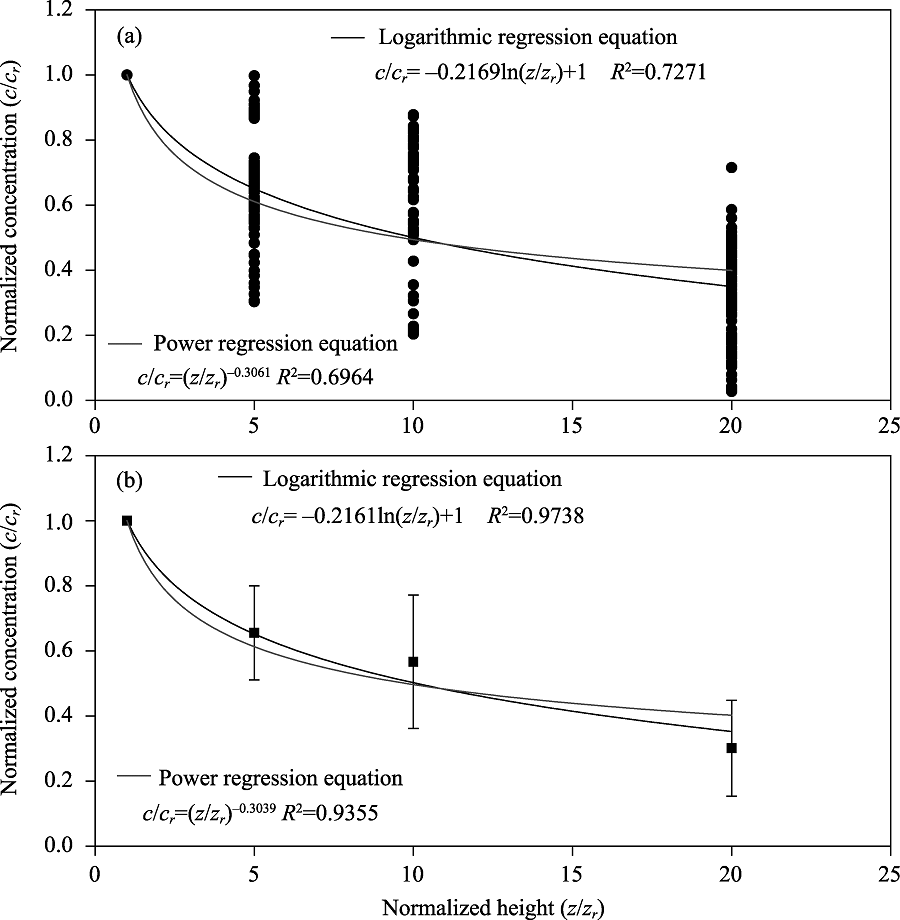
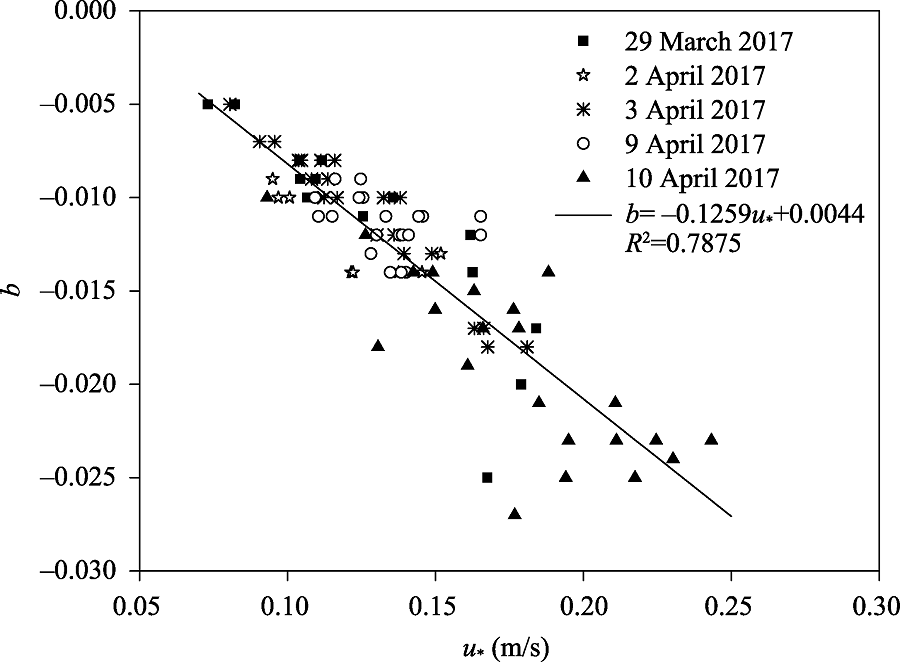
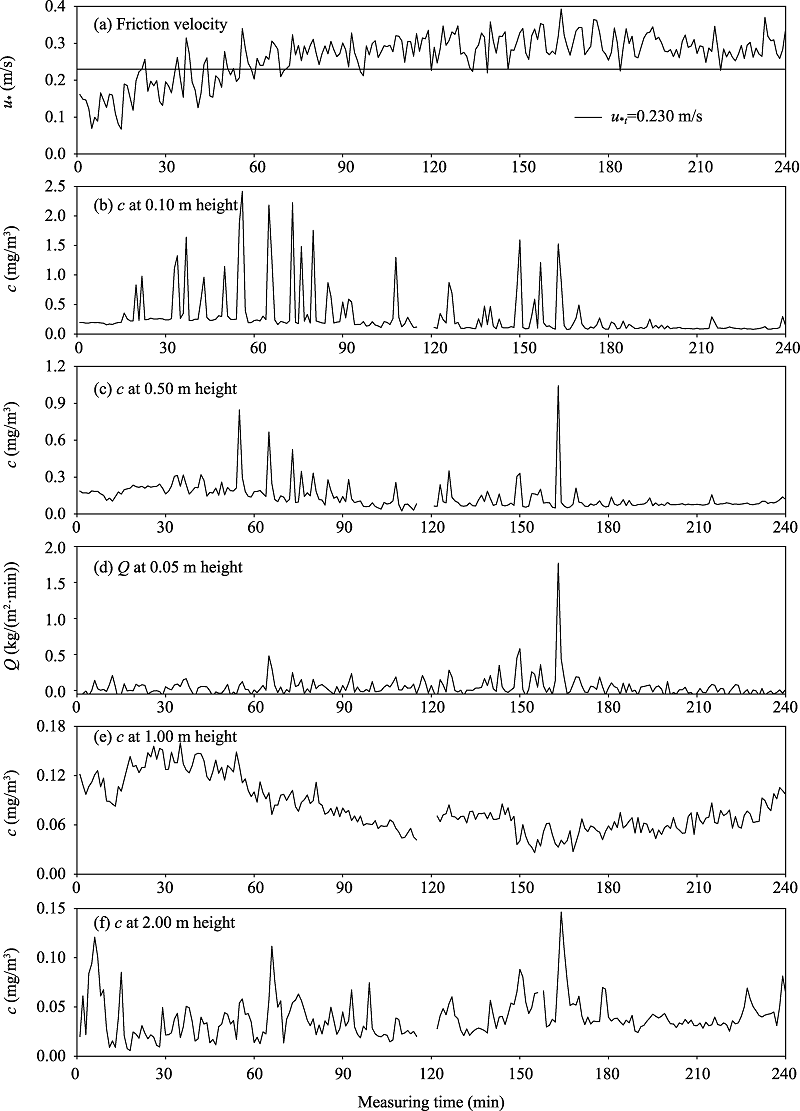
Abstract During aeolian processes, the two most critical factors related to dust emissions are soil particle and aggregate saltation, which greatly affect the vertical profiles of near-surface dust concentrations. In this study, we measured PM10 concentrations at four different heights (0.10, 0.50, 1.00 and 2.00 m) with and without continuous and simultaneous aeolian saltation processes on a Gobi surface in northwestern China from 31 March to 10 April, 2017. We found that the vertical concentration profiles of suspended PM10 matched the log-law model well when there was no aeolian saltation. For the erosion process with saltation, we divided the vertical concentration profiles of PM10 into the saltation-affected layer and the airflow-transport layer according to two different dust sources (i.e., locally emitted PM10 and upwind transported PM10). The transition height between the saltation-affected layer and the airflow-transport layer was not fixed and varied with saltation intensity. From this new perspective, we calculated the airflow-transport layer and the dust emission rate at different times during a wind erosion event occurred on 5 April 2017. We found that dust emissions during wind erosion are primarily controlled by saltation intensity, contributing little to PM10 concentrations above the ground surface compared to PM10 concentrations transported from upwind directions. As erosion progresses, the surface supply of erodible grains is the most crucial factor for saltation intensity. When there was a sufficient amount of erodible grains, there was a significant correlation among the friction velocity, saltation intensity and dust emission rate. However, when supply is limited by factors such as surface renewal or an increase in soil moisture, the friction velocity will not necessarily correlate with the other two factors. Therefore, for the Gobi surface, compared to limiting dust emissions from upwind directions, restricting the transport of suspended dust in its path is by far a more efficient and realistic option for small areas that are often exposed to dust storms. This study provides some theoretical basis for correctly estimating PM10 concentrations in the Gobi areas.
|
|
Received: 11 February 2022
Published: 30 June 2022
|
|
Corresponding Authors:
* WANG Xuesong (Email: xswang@bnu.edu.cn)
|
|
|
| [1] |
Alfaro S C, Gomes L. 2001. Modeling mineral aerosol production by wind erosion: Emission intensities and aerosol size distributions in source areas. Journal of Geophysical Research: Atmospheres, 106(D16): 18075-18084.
doi: 10.1029/2000JD900339
|
|
|
| [2] |
Anderson R S, Hallet B. 1986. Sediment transport by wind: Toward a general model. Geological Society of America Bulletin, 97(5): 523-535.
doi: 10.1130/0016-7606(1986)97<523:STBWTA>2.0.CO;2
|
|
|
| [3] |
Bagnold R A. 1941. The Physics of Blown Sand and Desert Dunes. Dordrecht: Springer, 1-265.
|
|
|
| [4] |
Budd W F. 1965. The drifting of non-uniform snow particles. Studies in Antarctic Meteorology, 9: 59-70.
|
|
|
| [5] |
Dong Z B, Man D Q, Luo W Y, et al. 2010. Horizontal aeolian sediment flux in the Minqin area, a major source of Chinese dust storms. Geomorphology, 116(1): 58-66.
doi: 10.1016/j.geomorph.2009.10.008
|
|
|
| [6] |
Freire L S, Chamecki M, Gillies J A. 2016. Flux-profile relationship for dust concentration in the stratified atmospheric surface layer. Boundary-Layer Meteorology, 160(2): 249-267.
doi: 10.1007/s10546-016-0140-2
|
|
|
| [7] |
Fryrear D W, Saleh A. 1993. Field wind erosion: vertical distribution. Soil Science, 155(4): 294-300.
doi: 10.1097/00010694-199304000-00008
|
|
|
| [8] |
Gillette D A. 1974. On the production of soil wind erosion having the potential for long range transport. Journal of Geophysical Research Atmospheres, 8: 734-744.
|
|
|
| [9] |
Gillette D A, Walker T R. 1977. Characteristics of airborne particles produced by wind erosion of sandy soil, high plains of West Texas. Soil Science, 123(2): 97-110.
doi: 10.1097/00010694-197702000-00004
|
|
|
| [10] |
Gillette D A. 1978. A wind tunnel simulation of the erosion of soil: Effect of soil texture, sandblasting, wind speed, and soil consolidation on dust production. Atmospheric Environment, 12(8): 1735-1743.
|
|
|
| [11] |
Gillette D A, Fryrear D W, Gill T E, et al. 1997. Relation of vertical flux of particles smaller than 10 μm to total aeolian horizontal mass flux at Owens Lake. Journal of Geophysical Research: Atmospheres, 102(D22): 26009-26015.
doi: 10.1029/97JD02252
|
|
|
| [12] |
Gillies J A, Berkofsky L. 2004. Eolian suspension above the saltation layer, the concentration profile. Journal of Sedimentary Research, 74(2): 176-183.
doi: 10.1306/091303740176
|
|
|
| [13] |
Hagen L J, Van Pelt S, Sharratt B. 2010. Estimating the saltation and suspension components from field wind erosion. Aeolian Research, 1(3): 147-153.
doi: 10.1016/j.aeolia.2009.08.002
|
|
|
| [14] |
Hinds W C. 2000. Aerosol technology: Properties, behavior, and measurement of airborne particles. New York: John Wiley & Sons, 1121-1122.
|
|
|
| [15] |
Houser C A, Nickling W G. 2001. The emission and vertical flux of particulate matter < 10 μm from a disturbed clay-crusted surface. Sedimentology, 48(2): 255-267.
doi: 10.1046/j.1365-3091.2001.00359.x
|
|
|
| [16] |
Kind R J. 1992. One-dimensional aeolian suspension above beds of loose particles: a new concentration profile equation. Atmospheric Environment, 26(5): 927-931.
|
|
|
| [17] |
Kjelgaard J, Sharratt B, Sundram I, et al. 2004. PM 10 emission from agricultural soils on the Columbia Plateau: comparison of dynamic and time-integrated field-scale measurements and entrainment mechanisms. Agricultural and Forest Meteorology, 125(3-4): 259-277.
doi: 10.1016/j.agrformet.2004.04.004
|
|
|
| [18] |
Kok J F, Parteli E J R, Michaels T I, et al. 2012. The physics of wind-blown sand and dust. Reports on Progress in Physics, 75(10): 10690, doi: 10.1016/j.aeolia.2015.02.003.
doi: 10.1016/j.aeolia.2015.02.003
|
|
|
| [19] |
Leys J F, Mctainsh G H. 1996. Sediment fluxes and particle grain-size characteristics of wind-eroded sediments in southeastern Australia. Earth Surface Processes and Landforms, 21(7): 661-671.
doi: 10.1002/(SICI)1096-9837(199607)21:7<661::AID-ESP663>3.0.CO;2-4
|
|
|
| [20] |
Loosmore G A, Hunt J R. 2000. Dust resuspension without saltation. Journal of Geophysical Research: Atmospheres, 105(D16): 20663-20671.
doi: 10.1029/2000JD900271
|
|
|
| [21] |
López M V. 1998. Wind erosion in agricultural soils: an example of limited supply of particles available for erosion. CATENA, 33(1): 17-28.
doi: 10.1016/S0341-8162(98)00064-2
|
|
|
| [22] |
Macpherson T, Nickling W G, Gillies J A, et al. 2008. Dust emissions from undisturbed and disturbed supply-limited desert surfaces. Journal of Geophysical Research, 113(F2), doi: 10.1029/2007JF000800.
doi: 10.1029/2007JF000800
|
|
|
| [23] |
Nickling W G. 1978. Eolian sediment transport during dust storms: Slims River Valley, Yukon Territory. Canadian Journal of Earth Sciences, 15(7): 1069-1084.
doi: 10.1139/e78-114
|
|
|
| [24] |
Nickling W G, Gillies J A. 1993. Dust emission and transport in Mali, West Africa. Sedimentology, 40(5): 859-868.
doi: 10.1111/j.1365-3091.1993.tb01365.x
|
|
|
| [25] |
Prandtl L. 1953. Essentials of Fluid Dynamics with Applications to Hydraulics, Aeronautics, Meteorology and other Subjects. London: Blackie & Son, 1-99.
|
|
|
| [26] |
Pye K, Tsoar H. 2009. Aeolian Sand and Sand Dunes. Berlin: Springer, 1-106.
|
|
|
| [27] |
Qiu X F, Zeng Y, Miao Q L. 2001. Temporal-spatial distribution as well as tracks and source areas of sand-dust storms in China. Acta Geographica Sinica, 56(3): 316-322.
|
|
|
| [28] |
Shao Y P, Lu H. 2000. A simple expression for wind erosion threshold friction velocity. Journal of Geophysical Research, 105(D17): 22437-22443.
doi: 10.1029/2000JD900304
|
|
|
| [29] |
Shao Y P. 2008. Physics and Modelling of Wind Erosion. Heidelberg: Springer, 1-278.
|
|
|
| [30] |
Shao Y P, Wyrwoll K, Chappell A, et al. 2011. Dust cycle: An emerging core theme in Earth system science. Aeolian Research, 2(4): 181-204.
doi: 10.1016/j.aeolia.2011.02.001
|
|
|
| [31] |
Shao Y P, Zhang J, Ishizuka M, et al. 2020. Dependency of particle size distribution at dust emission on friction velocity and atmospheric boundary-layer stability. Atmospheric Chemistry and Physics, 20: 12939-12953.
|
|
|
| [32] |
Sharratt B, Pi H. 2018. Field and laboratory comparison of PM10 instruments in high winds. Aeolian Research, 32: 42-52.
doi: 10.1016/j.aeolia.2018.01.006
|
|
|
| [33] |
Sweeney M, Etyemezian V, Macpherson T, et al. 2008. Comparison of PI-SWERL with dust emission measurements from a straight-line field wind tunnel. Journal of Geophysical Research: Atmospheres, 113(F1): 228-236.
|
|
|
| [34] |
Vories E D, Fryrear D W. 1991. Vertical distribution of wind-eroded soil over a smooth, bare field. Transactions of the Asae, 34(4): 1763-1768.
doi: 10.13031/2013.31798
|
|
|
| [35] |
Wagenbrenner N S, Germino M J, Lamb B K, et al. 2013. Wind erosion from a sagebrush steppe burned by wildfire: Measurements of PM10 and total horizontal sediment flux. Aeolian Research, 10: 25-36.
doi: 10.1016/j.aeolia.2012.10.003
|
|
|
| [36] |
Wang R D, Li Q, Zhou N, et al. 2019. Effect of wind speed on aggregate size distribution of windblown sediment. Aeolian Research, 36: 1-8.
doi: 10.1016/j.aeolia.2018.10.001
|
|
|
| [37] |
Wang R D, Li Q, Wang R J, 2021. Influence of wind velocity and soil size distribution on emitted dust size distribution: A wind tunnel study. Journal of Geophysical Research: Atmospheres, 126, e2020JD033768, doi: doi.org/10.1029/2020JD033768.
doi: doi.org/10.1029/2020JD033768
|
|
|
| [38] |
Wang X S, Zhang C L. 2021. Field observations of sand flux and dust emission above a gobi desert surface. Journal of Soils and Sediments, 21: 1815-1825.
doi: 10.1007/s11368-021-02883-5
|
|
|
| [39] |
Wang X S, Zhang C L, Zou X Y. 2021. A model of the sand transport rate that accounts for temporal evolution of the bed. Geomorphology, 378, 107616, doi: 10.1016/j.geomorph.2021.107616.
doi: 10.1016/j.geomorph.2021.107616
|
|
|
| [40] |
Whicker J, Breshears D D, Field J P. 2014. Progress on relationships between horizontal and vertical dust flux: Mathematical, empirical and risk-based perspectives. Aeolian Research, 14: 105-111.
doi: 10.1016/j.aeolia.2013.12.001
|
|
|
| [41] |
Wu W, Yan P, Wang Y, et al. 2018. Wind tunnel experiments on dust emissions from different landform types. Journal of Arid Land, 10(4): 1-13.
doi: 10.1007/s40333-017-0036-0
|
|
|
| [42] |
Zender C S, Bian H, Newman D. 2003. Mineral Dust Entrainment and Deposition (DEAD) model: Description and 1990s dust climatology. Journal of Geophysical Research, 108(D14): 4416, doi: 10.1029/2002JD002775.
doi: 10.1029/2002JD002775
|
|
|
| [43] |
Zhang C L, Song C Q, Wang Z T, et al. 2018. Review and prospect of the study on soil wind erosion process. Advances in Earth Science, 33(1): 27-41. (in Chinese)
|
|
|
| [44] |
Zhang C L, Wei G R, Zou X Y, et al. 2022. The varying fetch effect of aeolian sand transport above a gobi surface and its implication for gobi development process. International Soil and Water Conservation Research, doi: 10.1016/j.iswcr.2022.03.002.
doi: 10.1016/j.iswcr.2022.03.002
|
|
|
| [45] |
Zhang J, Teng Z J, Huang N, et al. 2016. Surface renewal as a significant mechanism for dust emission. Atmospheric Chemistry and Physics, 16(24): 15517-15528.
|
|
|
| [46] |
Zhang Y Y, Hu R F, Zheng X J. 2018. Large-scale coherent structures of suspended dust concentration in the neutral atmospheric surface layer: A large-eddy simulation study. Physics of Fluids, 30(4): 046601, doi: 10.1063/1.5022089.
doi: 10.1063/1.5022089
|
|
|
| [47] |
Zobeck T M, Pelt R. 2006. Wind-induced dust generation and transport mechanics on a bare agricultural field. Journal of Hazardous Materials, 132(1): 26-38.
pmid: 16423453
|
|
|
|
Viewed |
|
|
|
Full text
|
|
|
|
|
Abstract
|
|
|
|
|
Cited |
|
|
|
|
| |
Shared |
|
|
|
|
| |
Discussed |
|
|
|
|