| Research article |
|


|
|
|
| Estimation and inter-comparison of infiltration models in the agricultural area of the Mitidja Plain, Algeria |
Amina MAZIGHI1, Hind MEDDI1, Mohamed MEDDI1,*( ), Ishak ABDI1,2, Giovanni RAVAZZANI3, Mouna FEKI3 ), Ishak ABDI1,2, Giovanni RAVAZZANI3, Mouna FEKI3 |
1Higher National School of Hydraulics of Blida, Blida 09000, Algeria
2Department of Civil Engineering and Hydraulics, University of Jijel, Jijel 18000, Algeria
3Department of Civil and Environmental Engineering, Polytechnic University of Milan, Milan 20133, Italy |
|
|
|
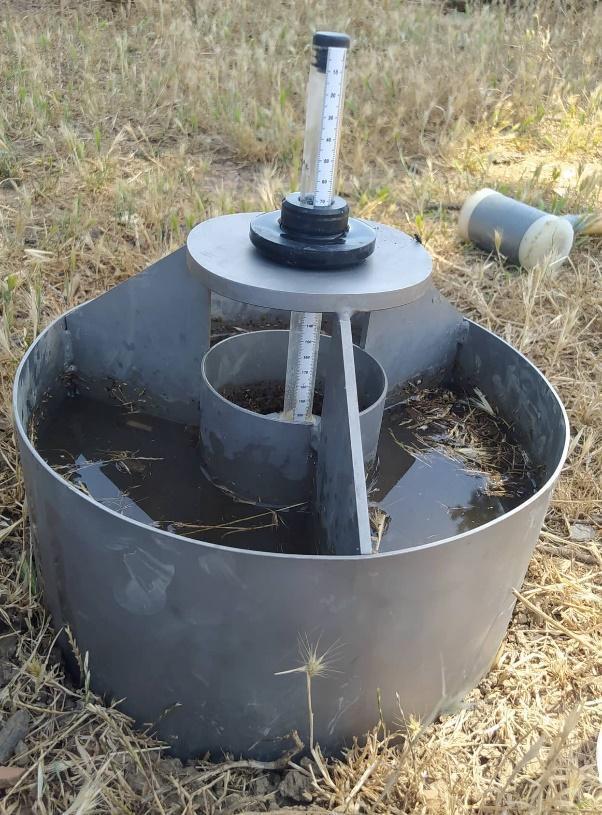
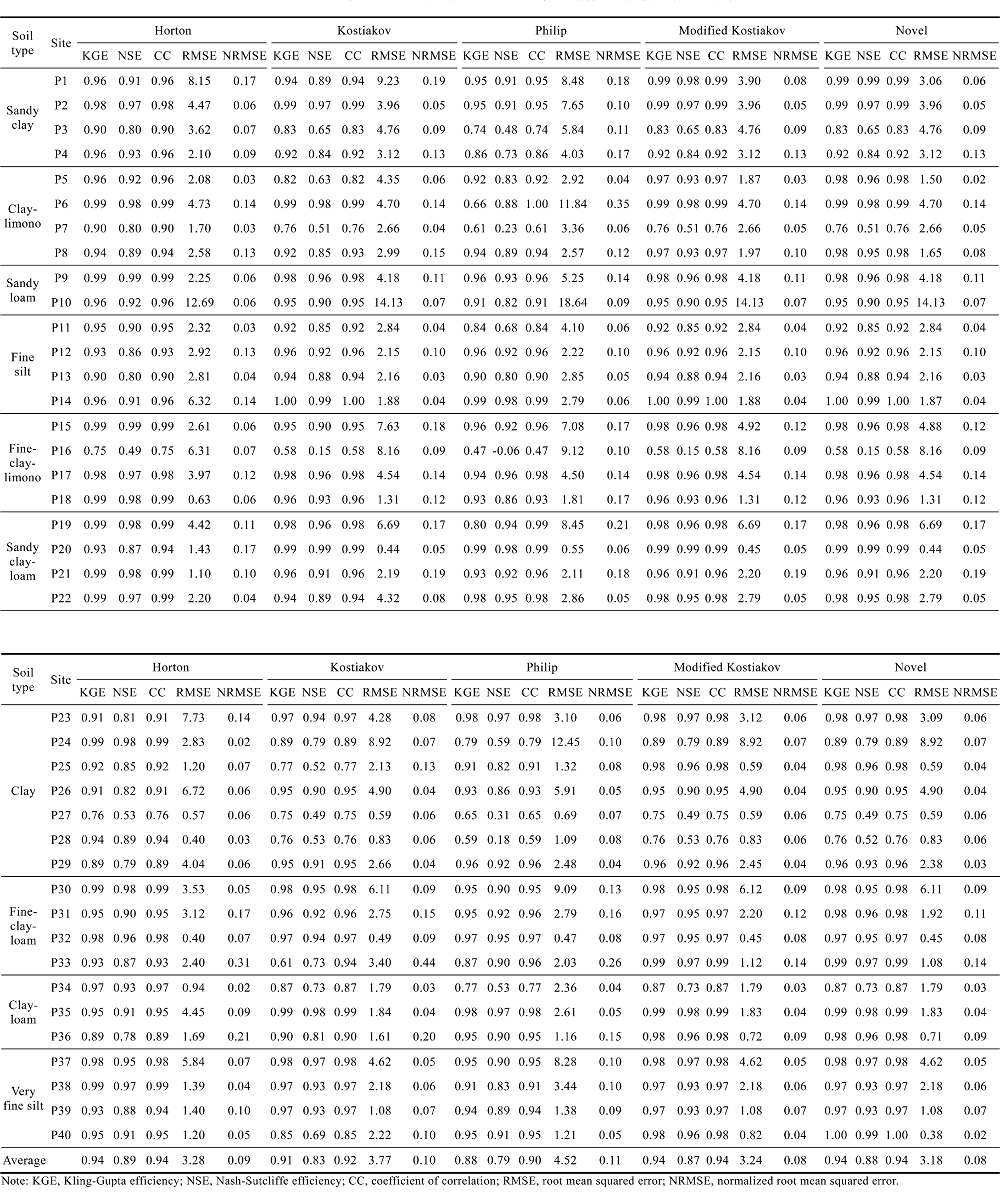
Abstract Infiltration is an important part of the hydrological cycle, and it is one of the main abstractions accounted for in the rainfall-runoff modeling. The main purpose of this study is to compare the infiltration models that were used to assess the infiltration rate of the Mitidja Plain in Algeria. Field infiltration tests were conducted at 40 different sites using a double ring infiltrometer. Five statistical comparison criteria including root mean squared error (RMSE), normalized root mean squared error (NRMSE), coefficient of correlation (CC), Nash-Sutcliffe efficiency (NSE), and Kling-Gupta efficiency (KGE) were used to determine the best performing infiltration model and to confirm anomalies between predicted and observed values. Then we evaluated performance of five models (i.e., the Philip model, Kostiakov model, Modified Kostiakov model, Novel model, and Horton model) in simulating the infiltration process based on the adjusted performance parameters cited above. Results indicated that the Novel model had the best simulated water infiltration process in the Mitidja Plain in Algeria. However, the Philip model was the weakest to simulate the infiltration process. The conclusion of this study can be useful for estimating infiltration rate at various sites using a Novel model when measured infiltration data are not available and are useful for planning and managing water resources in the study area.
|
|
Received: 26 July 2023
Published: 31 December 2023
|
Corresponding Authors:
*Mohamed MEDDI (E-mail: m.meddi@ensh.dz)
|
|
|
| [1] |
Adeniji F A, Umara B G, Dibal J M, et al. 2013. Variation of infiltration rates with soil texture: A laboratory study. International Journal of Engineering and Innovative Technology, 3(2): 454-459.
|
|
|
| [2] |
Angelaki A, Singh Nain S, Singh V, et al. 2021. Estimation of models for cumulative infiltration of soil using machine learning methods. ISH Journal of Hydraulic Engineering, 27(2): 162-169.
doi: 10.1080/09715010.2018.1531274
|
|
|
| [3] |
Bennett N G, Croke B F W, Guariso G, et al. 2013. Characterising performance of environmental models. Environmental Modelling and Software, 40: 1-20.
doi: 10.1016/j.envsoft.2012.09.011
|
|
|
| [4] |
Boufekane A, Meddi H, Meddi M. 2020. Delineation of groundwater recharge zones in the Mitidja Plain, North Algeria, using multi-criteria analysis. Journal of Hydroinformatics, 22(6): 1468-1484.
doi: 10.2166/hydro.2020.082
|
|
|
| [5] |
Boufekane A, Yahiaoui S, Meddi H, et al. 2021. Modified DRASTIC index model for groundwater vulnerability mapping using geostatistic methods and GIS in the Mitidja Plain Area (Algeria). Environmental Forensics, 23(5-6): 539-556.
doi: 10.1080/15275922.2021.1913674
|
|
|
| [6] |
Bouziane O, Mohamed M,Juan Reca C. 2021. Characterization of the water holding capacity of the soils in the Mitidja Plain (Algeria) as a basis for the development of the irrigation water use. Journal of Taiwan Water Conservancy, 69(4): 27-39.
|
|
|
| [7] |
Dahak A, Boutaghane H, Merabtene T. 2022. Parameter estimation and assessment of infiltration models for Madjez Ressoul Catchment, Algeria. Water, 14(8): 1185, doi: 10.3390/w14081185.
|
|
|
| [8] |
Duan R B, Clifford B F, John B. 2010. Field evaluation of infiltration models in lawn soils. Irrigation Science, 29(5): 379-389.
doi: 10.1007/s00271-010-0248-y
|
|
|
| [9] |
Esfandiari M, Maheshwari B L. 1997. Application of the optimization method for estimating infiltration characteristics in furrow irrigation and its comparison with other methods. Agricultural Water Management, 34(2): 169-185.
doi: 10.1016/S0378-3774(97)00007-3
|
|
|
| [10] |
Farid H U, Mahmood-Khan Z, Ahmad I, et al. 2019. Estimation of infiltration models parameters and their comparison to simulate the onsite soil infiltration characteristics. International Journal of Agricultural and Biological Engineering, 12(3): 84-91.
|
|
|
| [11] |
Golmohammadi G, Prasher S O, Madani A, et al. 2014. Evaluating three hydrological distributed watershed models: MIKE-SHE, APEX, SWAT. Hydrology, 1(1): 20-39.
|
|
|
| [12] |
Haghighi F, Gorji M, Shorafa M, et al. 2010. Evaluation of some infiltration models and hydraulic parameters. Spanish Journal of Agricultural Research, 8(1): 210.
doi: 10.5424/sjar/2010081-1160
|
|
|
| [13] |
Iovino M, Angulo-Jaramillo R, Bagarello V, et al. 2017. Thematic issue on soil water infiltration. Journal of Hydrology and Hydromechanics, 65(3): 205-208.
doi: 10.1515/johh-2017-0036
|
|
|
| [14] |
Jain L, Chakma S. 2023. Effects of temperature and slope on the infiltration rate for a landfill surface. Current Science, 124(1): 94-101.
doi: 10.18520/cs/v124/i1/94-101
|
|
|
| [15] |
Knoben W J M, Freer J, Woods R. 2019. Technical note: Inherent benchmark or not? Comparing Nash-Sutcliffe and Kling-Gupta Efficiency Scores. Hydrology and Earth System Sciences, 23(10): 4323-4331.
doi: 10.5194/hess-23-4323-2019
|
|
|
| [16] |
Kumar M, Sihag P. 2019. Assessment of infiltration rate of soil using empirical and machine learning-based models. Irrigation and Drainage, 68(3): 588-601.
doi: 10.1002/ird.v68.3
|
|
|
| [17] |
Lei G H, Fan G L, Zeng W J, et al. 2020. Estimating parameters for the Kostiakov-Lewis infiltration model from soil physical properties. Journal of Soils and Sediments, 20(1): 166-180.
doi: 10.1007/s11368-019-02332-4
|
|
|
| [18] |
Machiwal D, Jha M K, Mal B C. 2006. Modelling infiltration and quantifying spatial soil variability in a wasteland of Kharagpur, India. Biosystems Engineering, 95(4): 569-582.
doi: 10.1016/j.biosystemseng.2006.08.007
|
|
|
| [19] |
Meddi M, Eslamian S. 2021. Uncertainties in rainfall and water resources in Maghreb countries under climate change. In: Leal Filho W, Oguge N, Ayal D, et al. Handbook of Climate Change Adaptation. Cham: Springer, 1967-2003.
|
|
|
| [20] |
Mishra S K, Tyagi J V, Singh V P. 2003. Comparison of infiltration models. Hydrological Processes, 17(13): 2629-2652.
doi: 10.1002/hyp.v17:13
|
|
|
| [21] |
Ogbe V B, Jayeoba J O, Ode S O. 2011. Comparison of four soil infiltration models on a sandy soil in Lafia, southern guinea savanna zone of Nigeria. Production agricultural and Technology, 7: 116-126.
|
|
|
| [22] |
Oku E, Aiyelari A. 2011. Predictability of Philip and Kostiakov infiltration models under inceptisols in the humid forest zone, Nigeria. Kasetsart Journal-Natural Science, 45(4): 604-611.
|
|
|
| [23] |
Parhi P K, Mishra S, Singh R. 2007. A modification to Kostiakov and Modified Kostiakov infiltration models. Water Resources Management, 21(11): 1973-1989.
doi: 10.1007/s11269-006-9140-1
|
|
|
| [24] |
Philip J R, De Vries D A. 1957. Moisture movement in porous materials under temperature gradients. Transactions, American Geophysical Union, 38(2): 222-232.
doi: 10.1029/TR038i002p00222
|
|
|
| [25] |
Rasool T, Dar A, Wani M A. 2021. Comparative evaluation of infiltration models under different land covers. Water Resources, 48(4): 624-634.
doi: 10.1134/S0097807821040175
|
|
|
| [26] |
Richards L A. 1931. Capillary conduction of liquids through porous mediums. Physics, 1(5): 318-333.
doi: 10.1063/1.1745010
|
|
|
| [27] |
Schumann A H. 1998. Infiltration:Introduction. In: Herschy R W, Fairbridge R W. Hydrology and Lakes. Encyclopedia of Earth Science. Dordrecht: Springer, 418.
|
|
|
| [28] |
Sihag P, Tiwari N K, Ranjan S. 2017. Estimation and inter-comparison of infiltration models. Water Science, 31(1): 34-43.
doi: 10.1016/j.wsj.2017.03.001
|
|
|
| [29] |
Singh B, Sihag P, Singh K P. 2018. Comparison of infiltration models in NIT Kurukshetra campus. Applied Water Science, 8(2): 54.
doi: 10.1007/s13201-018-0694-x
|
|
|
| [30] |
Soil Science Equipment | Double Ring Infiltrometer Surface Measure. 2020. SDE Council. [2022-10-22]. https://environnement.sdec-france.com/double-ring-infiltrometer-for-soil-science.html.
|
|
|
| [31] |
Tadj M, Benmouiza K, Cheknane A, et al. 2014. Improving the performance of PV systems by faults detection using GISTEL approach. Energy Conversion and Management, 80: 298-304.
doi: 10.1016/j.enconman.2014.01.030
|
|
|
| [32] |
Thomas A D, Ofosu A E, Amuzu E, et al. 2020. Comparison and estimation of four infiltration models. Open Journal of Soil Science, 10(2): 45-57.
doi: 10.4236/ojss.2020.102003
|
|
|
| [33] |
Vand A S, Sihag P, Singh B, et al. 2018. Comparative evaluation of infiltration models. KSCE Journal of Civil Engineering, 22(10): 4173-4184.
doi: 10.1007/s12205-018-1347-1
|
|
|
| [34] |
Wang T T, Stewart C E, Ma J B, et al. 2017. Applicability of five models to simulate water infiltration into soil with added biochar. Journal of Arid Land, 9(5): 701-711.
doi: 10.1007/s40333-017-0025-3
|
|
|
| [35] |
Zakwan M, Muzzammil M, Alam J. 2016. Application of spreadsheet to estimate infiltration parameters. Perspectives in Science, 8: 702-704.
doi: 10.1016/j.pisc.2016.06.064
|
|
|
| [36] |
Zeybek M. 2018. Nash-Sutcliffe efficiency approach for quality improvement. Journal of Applied Mathematics and Computation, 2(11): 496-503.
|
|
|
|
Viewed |
|
|
|
Full text
|
|
|
|
|
Abstract
|
|
|
|
|
Cited |
|
|
|
|
| |
Shared |
|
|
|
|
| |
Discussed |
|
|
|
|