| Research article |
|


|
|
|
| Spatiotemporal dynamic and drivers of ecological environmental quality on the Chinese Loess Plateau: Insights from kRSEI model and climate-human interaction analysis |
XI Ruiyun1, PEI Tingting1, CHEN Ying1,*( ), XIE Baopeng1, HOU Li1, WANG Wen2,3 ), XIE Baopeng1, HOU Li1, WANG Wen2,3 |
1College of Management, Gansu Agricultural University, Lanzhou 730070, China
2Gansu Natural Resources Planning and Research Institute, Lanzhou 730070, China
3Gansu Branch of the Key Laboratory of Land Use, Ministry of Natural Resources of the People's Republic of China, Lanzhou 730070, China |
|
|
|
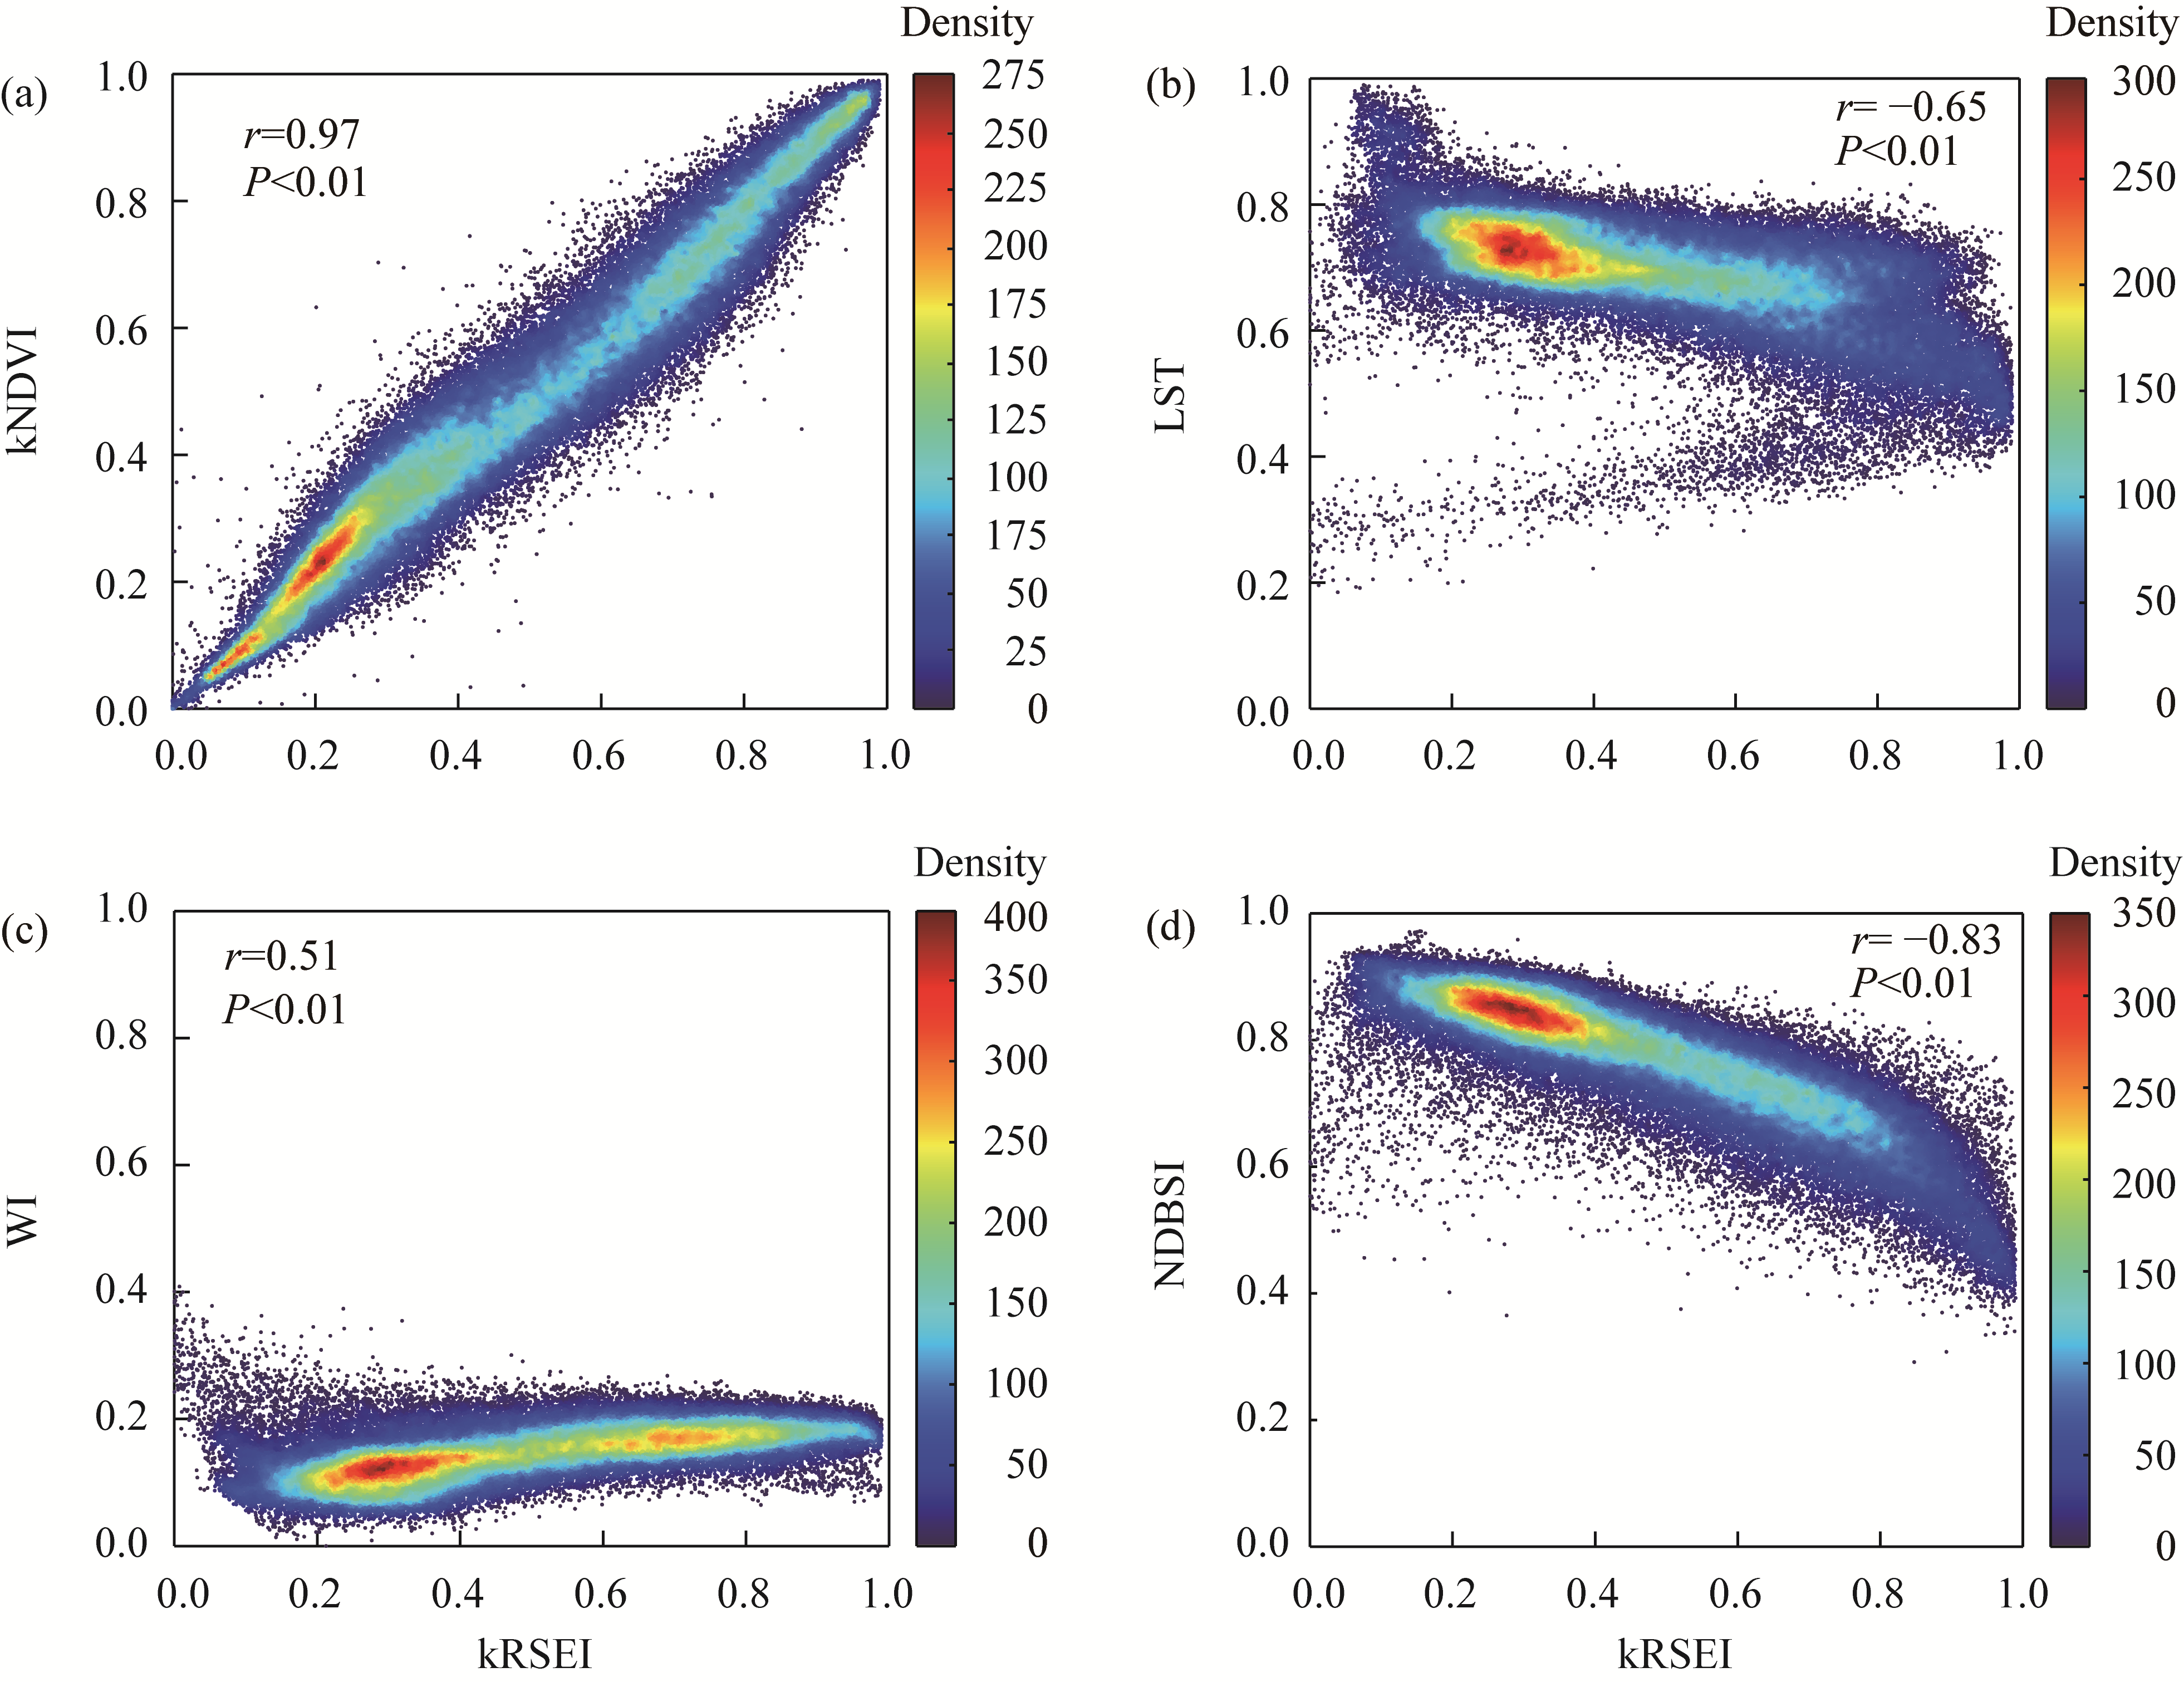
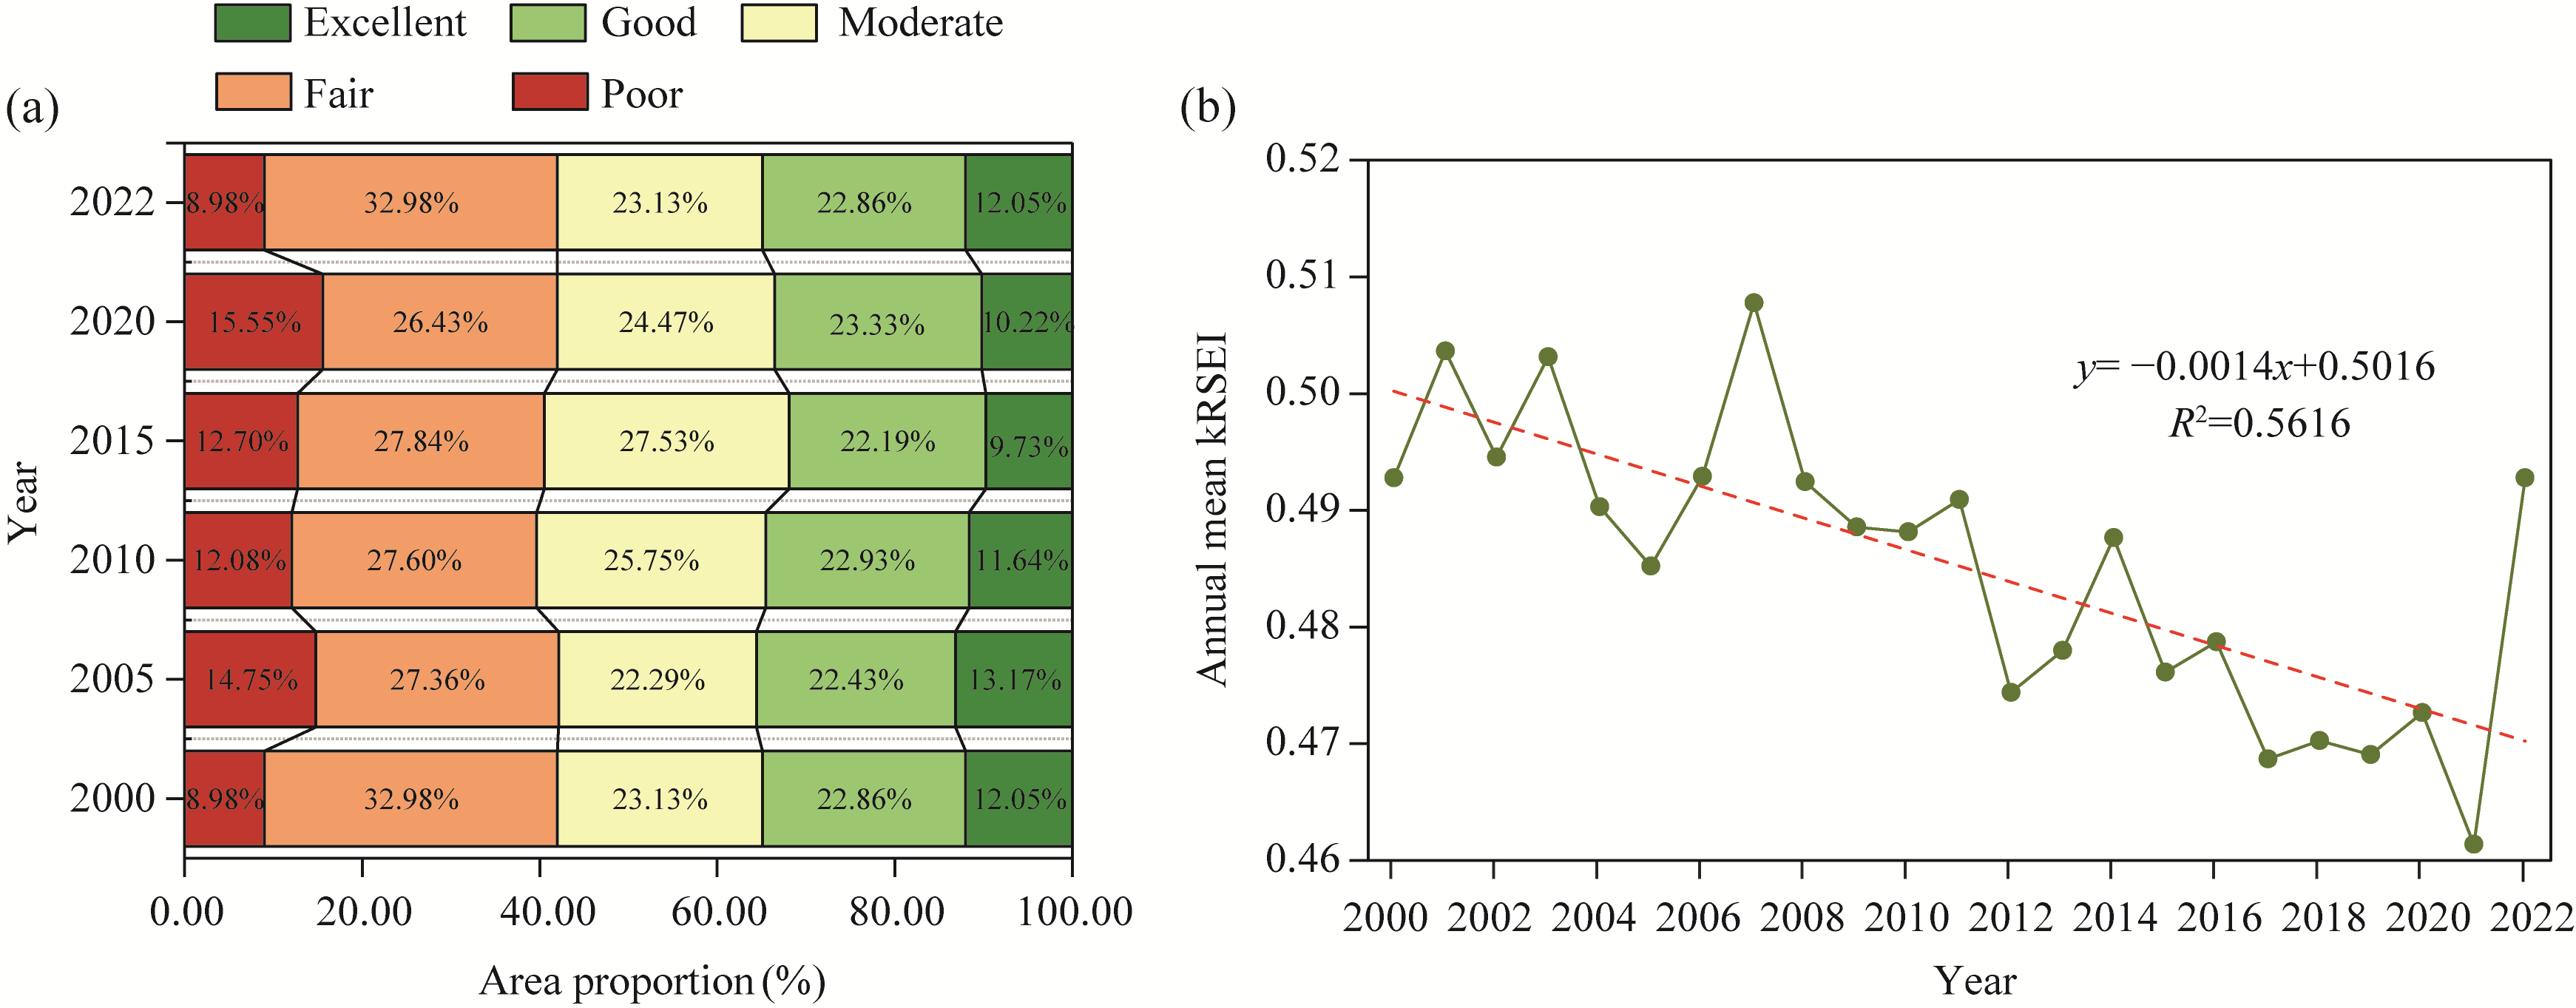
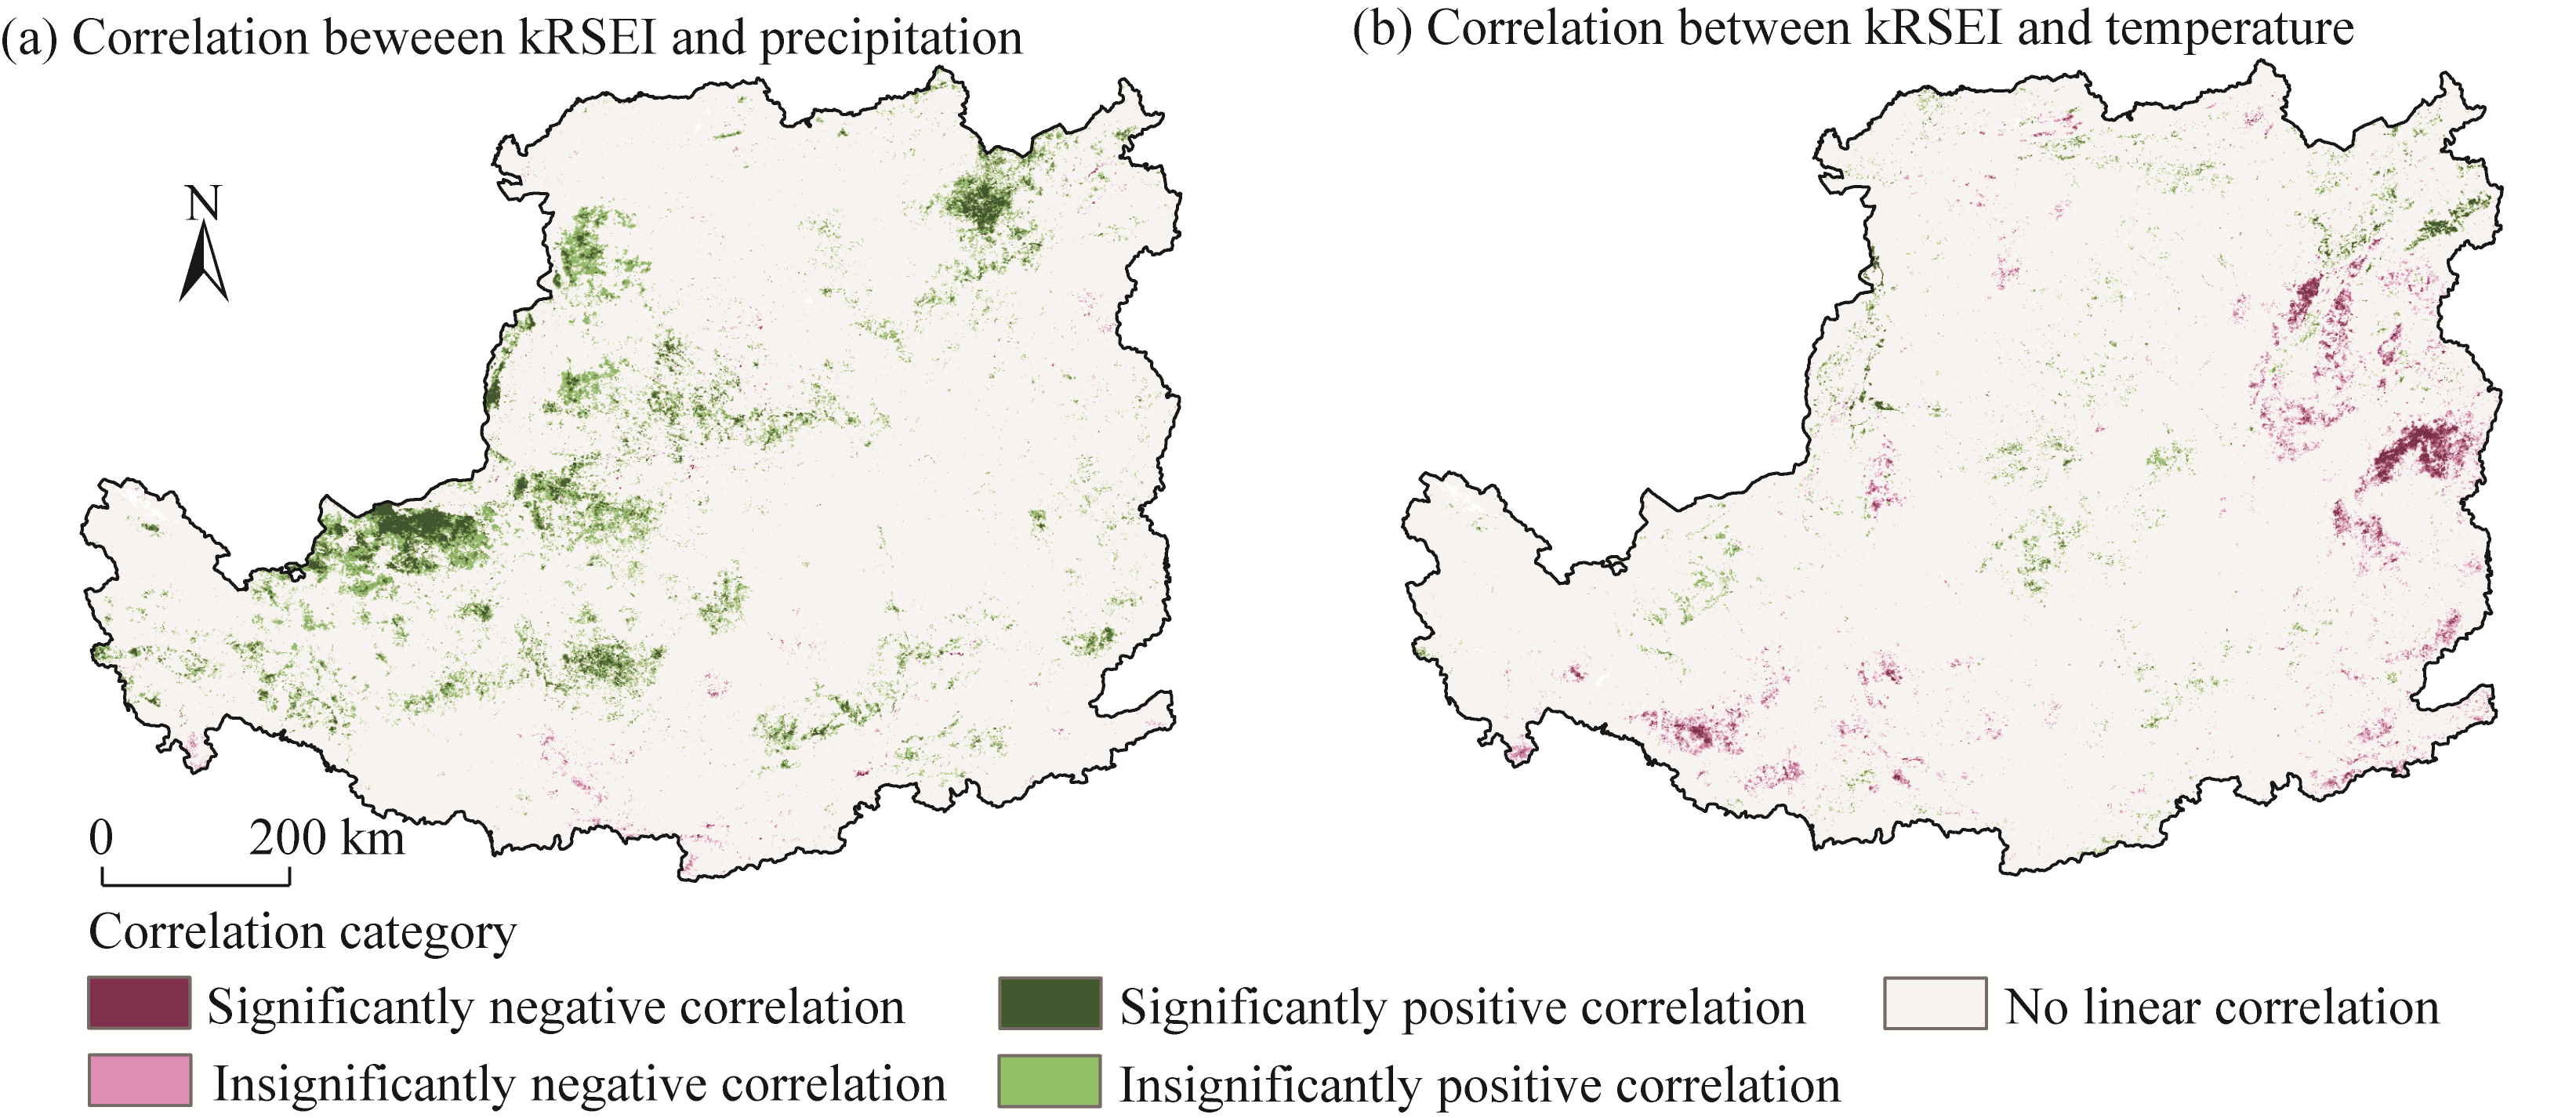
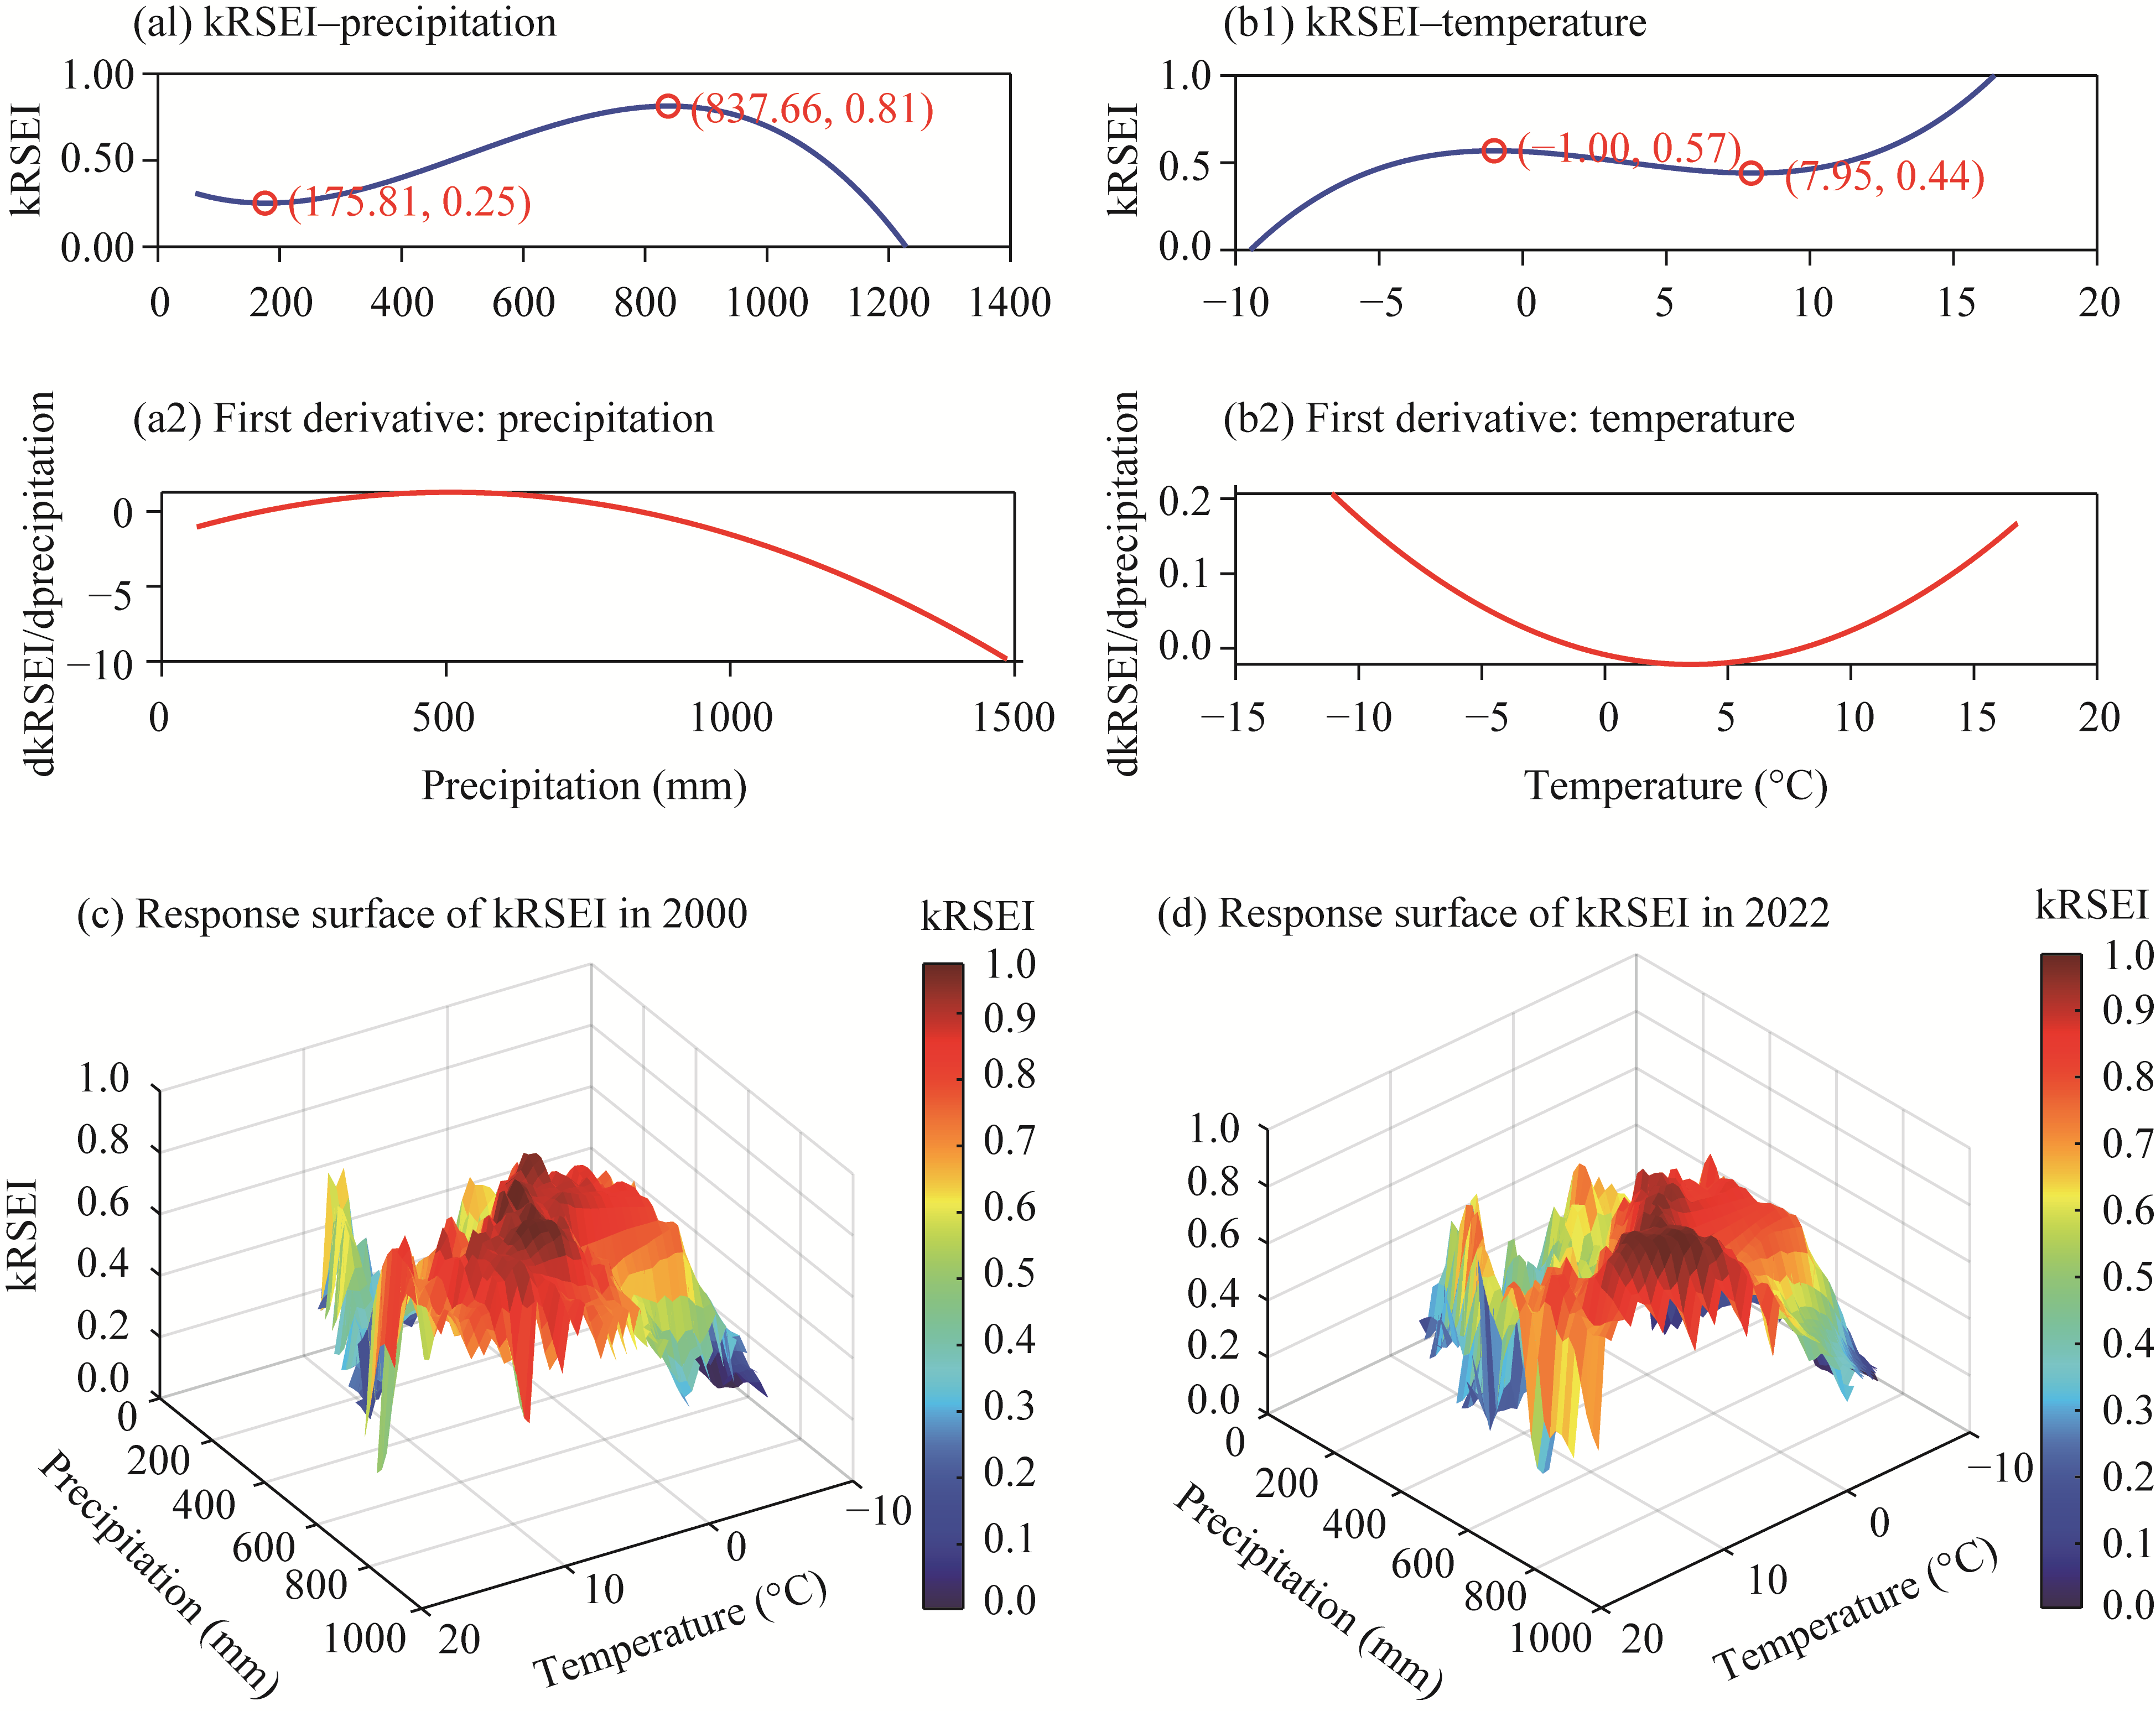
Abstract The Loess Plateau (LP), one of the most ecologically fragile regions in China, is affected by severe soil erosion and environmental degradation. Despite large-scale ecological restoration efforts made by Chinese government in recent years, the region continues to face significant ecological challenges due to the combined impact of climate change and human activities. In this context, we developed a kernal Remote Sensing Ecological Index (kRSEI) using Moderate Resolution Imaging Spectroradiometer (MODIS) products on the Google Earth Engine (GEE) platform to analyze the spatiotemporal patterns and trends in ecological environmental quality (EEQ) across the LP from 2000 to 2022 and project future trajectories. Then, we applied partial correlation analysis and multivariate regression residual analysis to further quantify the relative contributions of climate change and human activities to EEQ. During the study period, the kRSEI values exhibited significant spatial heterogeneity, with a stepwise degradation pattern in the southeast to northwest across the LP. The maximum (0.51) and minimum (0.46) values of the kRSEI were observed in 2007 and 2021, respectively. Trend analyses revealed a decline in EEQ across the LP. Hurst exponent analysis predicted a trend of weak anti-persistent development in most of the plateau areas in the future. A positive correlation was identified between kRSEI and precipitation, particularly in the central and western regions; although, improvements were limited by a precipitation threshold of 837.66 mm/a. A moderate increase in temperature was shown to potentially benefit the ecological environment within a certain range; however, temperature of -1.00°C-7.95°C often had a negative impact on the ecosystem. Climate change and human activities jointly influenced 65.78% of LP area on EEQ, primarily having a negative impact. In terms of contribution, human activities played a dominant role in driving changes in EEQ across the plateau. These findings provide crucial insights for accurately assessing the ecological state of the LP and suggest the design of future restoration strategies.
|
|
Received: 23 February 2025
Published: 31 July 2025
|
|
Corresponding Authors:
*CHEN Ying (E-mail: cheny@gsau.edu)
|
|
|
| [1] |
Alexander C. 2020. Normalised difference spectral indices and urban land cover as indicators of land surface temperature (LST). International Journal of Applied Earth Observation and Geoinformation, 86: 102013, doi: 10.1016/j.jag.2019.102013.
|
|
|
| [2] |
An M, Xie P, He W J, et al. 2022. Spatiotemporal change of ecologic environment quality and human interaction factors in three gorges ecologic economic corridor, based on RSEI. Ecological Indicators, 141: 109090, doi: 10.1016/j.ecolind.2022.109090.
|
|
|
| [3] |
Bai T T, Cheng J, Zheng Z H, et al. 2023a. Drivers of eco-environmental quality in China from 2000 to 2017. Journal of Cleaner Production, 396: 136408, doi: 10.1016/j.jclepro.2023.136408.
|
|
|
| [4] |
Bai X, Zhang Z W, Li Z, et al. 2023b. Spatial heterogeneity and formation mechanism of eco-environmental quality in the Yellow River Basin. Sustainability, 15(14): 10878, doi: 10.3390/su151410878.
|
|
|
| [5] |
Boori M S, Choudhary K, Paringer R, et al. 2021. Spatiotemporal ecological vulnerability analysis with statistical correlation based on satellite remote sensing in Samara, Russia. Journal of Environmental Management, 285: 112138, doi: 10.1016/j.jenvman.2021.112138.
|
|
|
| [6] |
Camps-Valls G, Campos-Taberner M, Moreno-Martínez Á, et al. 2021. A unified vegetation index for quantifying the terrestrial biosphere. Science Advances, 7(9): eabc7447, doi: 10.1126/sciadv.abc7447.
|
|
|
| [7] |
Cao J X, Wu E T, Wu S H, et al. 2022. Spatiotemporal dynamics of ecological condition in Qinghai-Tibet Plateau based on remotely sensed ecological index. Remote Sensing, 14(17): 4234, doi: 10.3390/rs14174234.
|
|
|
| [8] |
Chen S F, Zhang Q F, Chen Y N, et al. 2023. Vegetation change and eco-environmental quality evaluation in the Loess Plateau of China from 2000 to 2020. Remote Sensing, 15(2): 424, doi: 10.3390/rs15020424.
|
|
|
| [9] |
Chen W Y, Zhao R F, Lu H T. 2024. Response of ecological environment quality to land use transition based on dryland oasis ecological index (DOEI) in dryland: A case study of oasis concentration area in middle Heihe River, China. Ecological Indicators, 165: 112214, doi: 10.1016/j.ecolind.2024.112214.
|
|
|
| [10] |
Cheng X Y, Wang R Y, Liu H L, et al. 2023. Assessment of ecological environment in Zhanjiang based on RSEI and PCA. International Journal of Environment, Agriculture and Biotechnology, 8: 5, doi: 10.22161/ijeab.85.4.
|
|
|
| [11] |
Du B Z, Zhen L, Yan H M, et al. 2016. Effects of government grassland conservation policy on household livelihoods and dependence on local grasslands: Evidence from Inner Mongolia, China. Sustainability, 8(12): 1314, doi: 10.3390/su8121314.
|
|
|
| [12] |
Feng X J, Tian J, Wang Y X, et al. 2023. Spatio-temporal variation and climatic driving factors of vegetation coverage in the Yellow River Basin from 2001 to 2020 based on kNDVI. Forests, 14(3): 620, doi: 10.3390/f14030620.
|
|
|
| [13] |
Gan X T, Du X C, Duan C J, et al. 2024. Evaluation of ecological environment quality and analysis of influencing factors in Wuhan City based on RSEI. Sustainability, 16(13): 5809, doi: 10.3390/su16135809.
|
|
|
| [14] |
Gou R K, Zhao J. 2020. Eco-environmental quality monitoring in Beijing, China, using an RSEI-based approach combined with random forest algorithms. IEEE Access, 8: 196657-196666.
|
|
|
| [15] |
Gong C, Lü F N, Wang Y L. 2023. Spatiotemporal change and drivers of ecosystem quality in the Loess Plateau based on RSEI: A case study of Shanxi, China. Ecological Indicators, 155: 111060, doi: 10.1016/j.ecolind.2023.111060.
|
|
|
| [16] |
Gong X G, Zhang Y Z, Ren J, et al. 2025. Ecological response of green spaces to land use change in the Mu Us Desert-Loess Plateau transition zone, China, since the twenty-first century. Environmental Monitoring and Assessment, 197: 435, doi: 10.1007/s10661-025-13906-w.
|
|
|
| [17] |
Hamel P, Bryant B P. 2017. Uncertainty assessment in ecosystem services analyses: Seven challenges and practical responses. Ecosystem Services, 24: 1-15.
|
|
|
| [18] |
IPCC Intergovernmental Panel on Climate Change. 2023. Climate Change 2021: The Physical Science Basis—Working Group I Contribution to the Sixth Assessment Report of the Intergovernmental Panel on Climate Change. Cambridge: Cambridge University Press.
|
|
|
| [19] |
Kamran M, Yamamoto K. 2023. Evolution and use of remote sensing in ecological vulnerability assessment: A review. Ecological Indicators, 148: 110099, doi: 10.1016/j.ecolind.2023.110099.
|
|
|
| [20] |
Li J, Roy D P. 2017. A global analysis of Sentinel-2A, Sentinel-2B and Landsat-8 data revisit intervals and implications for terrestrial monitoring. Remote Sensing, 9(9): 902, doi: 10.3390/rs9090902.
|
|
|
| [21] |
Li W J, Xie S Y, Wang Y, et al. 2021. Effects of urban expansion on ecosystem health in Southwest China from a multi-perspective analysis. Journal of Cleaner Production, 294: 126341, doi: 10.1016/j.jclepro.2021.126341.
|
|
|
| [22] |
Liang L F, Song Y X, Shao Z F, et al. 2024. Exploring the causal relationships and pathways between ecological environmental quality and influencing factors: A comprehensive analysis. Ecological Indicators, 165: 112192, doi: 10.1016/j.ecolind.2024.112192.
|
|
|
| [23] |
Luo H X, Xu Y M, Han Q, et al. 2024. Remote sensing assessment of ecological quality of Baiyangdian wetland in response to extreme rainfall. Remote Sensing Applications: Society and Environment, 36: 101284, doi: 10.1016/j.rsase.2024.101284.
|
|
|
| [24] |
Naseri N, Mostafazadeh R. 2023. Spatial relationship of remote sensing ecological indicator (RSEI) and landscape metrics under urban development intensification. Earth Science Informatics, 16: 3797-3810.
|
|
|
| [25] |
Peng X F, Zhang S Q, Peng P H, et al. 2023. Unraveling the ecological tapestry: A comprehensive assessment of Changtang Nature Reserve's ecological and environmental using RSEI and GEE. Land, 12(8): 1581, doi: 10.3390/land12081581.
|
|
|
| [26] |
Qi G, Cong N, Luo M, et al. 2024. Contribution of climatic change and human activities to vegetation dynamics over Southwest China during 2000-2020. Remote Sensing, 16(18): 3361, doi: 10.3390/rs16183361.
|
|
|
| [27] |
Qin G X, Wang N L, Wu Y W, et al. 2024. Spatiotemporal variations in eco-environmental quality and responses to drought and human activities in the middle reaches of the Yellow River Basin, China from 1990 to 2022. Ecological Informatics, 81: 102641, doi: 10.1016/j.ecoinf.2024.102641.
|
|
|
| [28] |
Shao Y J, Liu Y S, Wang X C, et al. 2024. Exploring the evolution of ecosystem health and sustainable zoning: A perspective based on the contributions of climate change and human activities. Science of the Total Environment, 951: 175674, doi: 10.1016/j.scitotenv.2024.175674.
|
|
|
| [29] |
Shi S Y, Yu J J, Wang F, et al. 2021. Quantitative contributions of climate change and human activities to vegetation changes over multiple time scales on the Loess Plateau. Science of the Total Environment, 755(Part 2): 142419, doi: 10.1016/j.scitotenv.2020.142419.
|
|
|
| [30] |
Strassburg B B, Iribarrem A, Beyer H L, et al. 2022. Author correction: Global priority areas for ecosystem restoration. Nature, 609: E7, doi: 10.1038/s41586-022-05178-y.
|
|
|
| [31] |
Sun C, Li J L, Liu Y C, et al. 2022. Ecological quality assessment and monitoring using a time-series remote sensing-based ecological index (ts-RSEI). GIScience & Remote Sensing, 59(1): 1793-1816.
|
|
|
| [32] |
Tian Y, Wang Z L, Ji C N, et al. 2025. The influence of human activities and climate change on the spatiotemporal variations of eco-environmental quality in Shendong Mining Area, China from 1990 to 2023. Applied Sciences, 15(5): 2296, doi: 10.3390/app15052296.
|
|
|
| [33] |
Wang F, Lai H X, Li Y B, et al. 2022a. Dynamic variation of meteorological drought and its relationships with agricultural drought across China. Agricultural Water Management, 261: 107301, doi: 10.1016/j.agwat.2021.107301.
|
|
|
| [34] |
Wang J, Ma J L, Xie F F, et al. 2020. Improvement of remote sensing ecological index in arid regions: Taking Ulan Buh Desert as an example. Chinese Journal of Applied Ecology, 31(11): 3795-3804. (in Chinese)
doi: 10.13287/j.1001-9332.202011.011
|
|
|
| [35] |
Wang J J, Ding J L, Ge X Y, et al. 2022b. Assessment of ecological quality in Northwest China (2000-2020) using the Google Earth Engine platform: Climate factors and land use/land cover contribute to ecological quality. Journal of Arid Land, 14(11): 1196-1211.
|
|
|
| [36] |
Wang L C, Jiao L, Lai F B, et al. 2019. Evaluation of ecological changes based on a remote sensing ecological index in a Manas Lake wetland, Xinjiang. Acta Ecologica Sinica, 39(8): 2963-2972. (in Chinese)
|
|
|
| [37] |
Wang X, Yao X J, Jiang C Z, et al. 2022c. Dynamic monitoring and analysis of factors influencing ecological environment quality in northern Anhui, China, based on the Google Earth Engine. Scientific Reports, 12: 20307, doi: 10.1038/s41598-022-24413-0.
|
|
|
| [38] |
Wang Z Z, Fu B J, Wu X T, et al. 2023. Vegetation resilience does not increase consistently with greening in China's Loess Plateau. Communications Earth & Environment, 4: 336, doi: 10.1038/s43247-023-01000-3.
|
|
|
| [39] |
Wen C H, Long T F, He G J, et al. 2025. Temporally enhanced RSEI and nighttime lights reveal long-term ecological changes and effective protection in China's inaugural national parks. Ecological Indicators, 170: 112981, doi: 10.1016/j.ecolind.2024.112981.
|
|
|
| [40] |
Wessels K J, van den Bergh F, Scholes R J. 2012. Limits to detectability of land degradation by trend analysis of vegetation index data. Remote Sensing of Environment, 125: 10-22.
|
|
|
| [41] |
Xiao Z L, Liu R, Gao Y H, et al. 2022. Spatiotemporal variation characteristics of ecosystem health and its driving mechanism in the mountains of Southwest China. Journal of Cleaner Production, 345: 131138, doi: 10.1016/j.jclepro.2022.131138.
|
|
|
| [42] |
Xiong Y, Xu W H, Lu N, et al. 2021. Assessment of spatial-temporal changes of ecological environment quality based on RSEI and GEE: A case study in Erhai Lake Basin, Yunnan Province, China. Ecological Indicators, 125: 107518, doi: 10.1016/j.ecolind.2021.107518.
|
|
|
| [43] |
Xu H Q. 2005. A study on information extraction of water body with the modified normalized difference water index (MNDWI). National Remote Sensing Bulletin, 9(5): 589-595. (in Chinese)
|
|
|
| [44] |
Xu H Q. 2013a. A remote sensing index for assessment of regional ecological changes. China Environmental Science, 33(5): 889-897. (in Chinese)
|
|
|
| [45] |
Xu H Q. 2013b. A remote sensing urban ecological index and its application. Acta Ecologica Sinica, 33(24): 7853-7862. (in Chinese)
|
|
|
| [46] |
Xu H Q, Wang M Y, Shi T T, et al. 2018. Prediction of ecological effects of potential population and impervious surface increases using a remote sensing based ecological index (RSEI). Ecological Indicators, 93: 730-740.
|
|
|
| [47] |
Xu H Q, Wang Y F, Guan H D, et al. 2019. Detecting ecological changes with a remote sensing based ecological index (RSEI) produced time series and change vector analysis. Remote Sensing, 11(20): 2345, doi: 10.3390/rs11202345.
|
|
|
| [48] |
Yang G, Chen Y H, Ren Q, et al. 2024. Remote sensing ecological index (RSEI) affects microbial community diversity in ecosystems of different qualities. Science of the Total Environment, 954: 176489, doi: 10.1016/j.scitotenv.2024.176489.
|
|
|
| [49] |
Yang W L, Zhou Y, Li C Z. 2023. Assessment of ecological environment quality in rare earth mining areas based on improved RSEI. Sustainability, 15(4): 2964, doi: 10.3390/su15042964.
|
|
|
| [50] |
Yao Z Y, Xiao J H, Ma X X. 2021. The impact of large-scale afforestation on ecological environment in the Gobi region. Scientific Reports, 11: 14383, doi: 10.1038/s41598-021-93948-5.
pmid: 34257401
|
|
|
| [51] |
Yu Y, Wu Y, Wang P, et al. 2021. Grassland subsidies increase the number of livestock on the Tibetan Plateau: why does the Payment for Ecosystem Services Policy have the opposite outcome? Sustainability, 13(11): 6208, doi: 10.3390/su13116208.
|
|
|
| [52] |
Yuan B D, Fu L N, Zou Y A, et al. 2021. Spatiotemporal change detection of ecological quality and the associated affecting factors in Dongting Lake Basin, based on RSEI. Journal of Cleaner Production, 302: 126995, doi: 10.1016/j.jclepro.2021.126995.
|
|
|
| [53] |
Yuan D H, Du M R, Yan C L, et al. 2024. Coupling coordination degree analysis and spatiotemporal heterogeneity between water ecosystem service value and water system in Yellow River Basin cities. Ecological Informatics, 79: 102440, doi: 10.1016/j.ecoinf.2023.102440.
|
|
|
| [54] |
Zhang J J, Zhou Q, Cao M, et al. 2022a. Spatiotemporal change of eco-environmental quality in the oasis city and its correlation with urbanization based on RSEI: A case study of Urumqi, China. Sustainability, 14(15): 9227, doi: 10.3390/su14159227.
|
|
|
| [55] |
Zhang K L, Feng R R, Zhang Z C, et al. 2022b. Exploring the driving factors of remote sensing ecological index changes from the perspective of geospatial differentiation: a case study of the Weihe River Basin, China. International Journal of Environmental Research and Public Health, 19(17): 10930, doi: 10.3390/ijerph191710930.
|
|
|
| [56] |
Zhang L Y, Li X, Liu X H, et al. 2025. Dynamic monitoring and drivers of ecological environmental quality in the Three-North region, China: Insights based on remote sensing ecological index. Ecological Informatics, 85: 102936, doi: 10.1016/j.ecoinf.2024.102936.
|
|
|
| [57] |
Zhang P P, Chen X D, Ren Y, et al. 2023a. A novel mine-specific eco-environment index (MSEEI) for mine ecological environment monitoring using Landsat imagery. Remote Sensing, 15(4): 933, doi: 10.3390/rs15040933.
|
|
|
| [58] |
Zhang X, Gao Z L, Li Y H, et al. 2023b. Eco-environment quality response to climate change and human activities on the Loess Plateau, China. Land, 12(9): 1792, doi: 10.3390/land12091792.
|
|
|
| [59] |
Zhang Y, She J Y, Long X R, et al. 2022c. Spatio-temporal evolution and driving factors of eco-environmental quality based on RSEI in Chang-Zhu-Tan metropolitan circle, central China. Ecological Indicators, 144: 109436, doi: 10.1016/j.ecolind.2022.109436.
|
|
|
| [60] |
Zhang Y B, Song T L, Fan J H, et al. 2022d. Land use and climate change altered the ecological quality in the Luanhe River Basin. International Journal of Environmental Research and Public Health, 19(13), 7719, doi: 10.3390/ijerph19137719.
|
|
|
| [61] |
Zheng Z H, Wu Z F, Chen Y B, et al. 2022. Instability of remote sensing based ecological index (RSEI) and its improvement for time series analysis. Science of the Total Environment, 814: 152595, doi: 10.1016/j.scitotenv.2021.152595.
|
|
|
| [62] |
Zhou M L, Li Z H, Gao M L, et al. 2024. Revealing the eco-environmental quality of the Yellow River Basin: Trends and drivers. Remote Sensing, 16(11): 2018, doi: 10.3390/rs16112018.
|
|
|
| [63] |
Zhou S, Huang Y F, Yu B F, et al. 2015. Effects of human activities on the eco-environment in the middle Heihe River Basin based on an extended environmental Kuznets curve model. Ecological Engineering, 76: 14-26.
|
|
|
| [64] |
Zhu D Y, Chen T, Wang Z W, et al. 2021. Detecting ecological spatial-temporal changes by remote sensing ecological index with local adaptability. Journal of Environmental Management, 299: 113655, doi: 10.1016/j.jenvman.2021.113655.
|
|
|
| [65] |
Zou S B, Qian J K, Xu B R, et al. 2022. Spatiotemporal changes of ecosystem health and their driving mechanisms in alpine regions on the northeastern Tibetan Plateau. Ecological Indicators, 143: 109396, doi: 10.1016/j.ecolind.2022.109396.
|
|
|
|
Viewed |
|
|
|
Full text
|
|
|
|
|
Abstract
|
|
|
|
|
Cited |
|
|
|
|
| |
Shared |
|
|
|
|
| |
Discussed |
|
|
|
|