| Research article |
|


|
|
|
| Spatiotemporal variation and driving factors of vegetation net primary productivity in the Guanzhong Plain Urban Agglomeration, China from 2001 to 2020 |
LIU Yuke, HUANG Chenlu*( ), YANG Chun, CHEN Chen ), YANG Chun, CHEN Chen |
| School of Tourism & Research Institute of Human Geography, Xi'an International Studies University, Xi'an 710128, China |
|
|
|
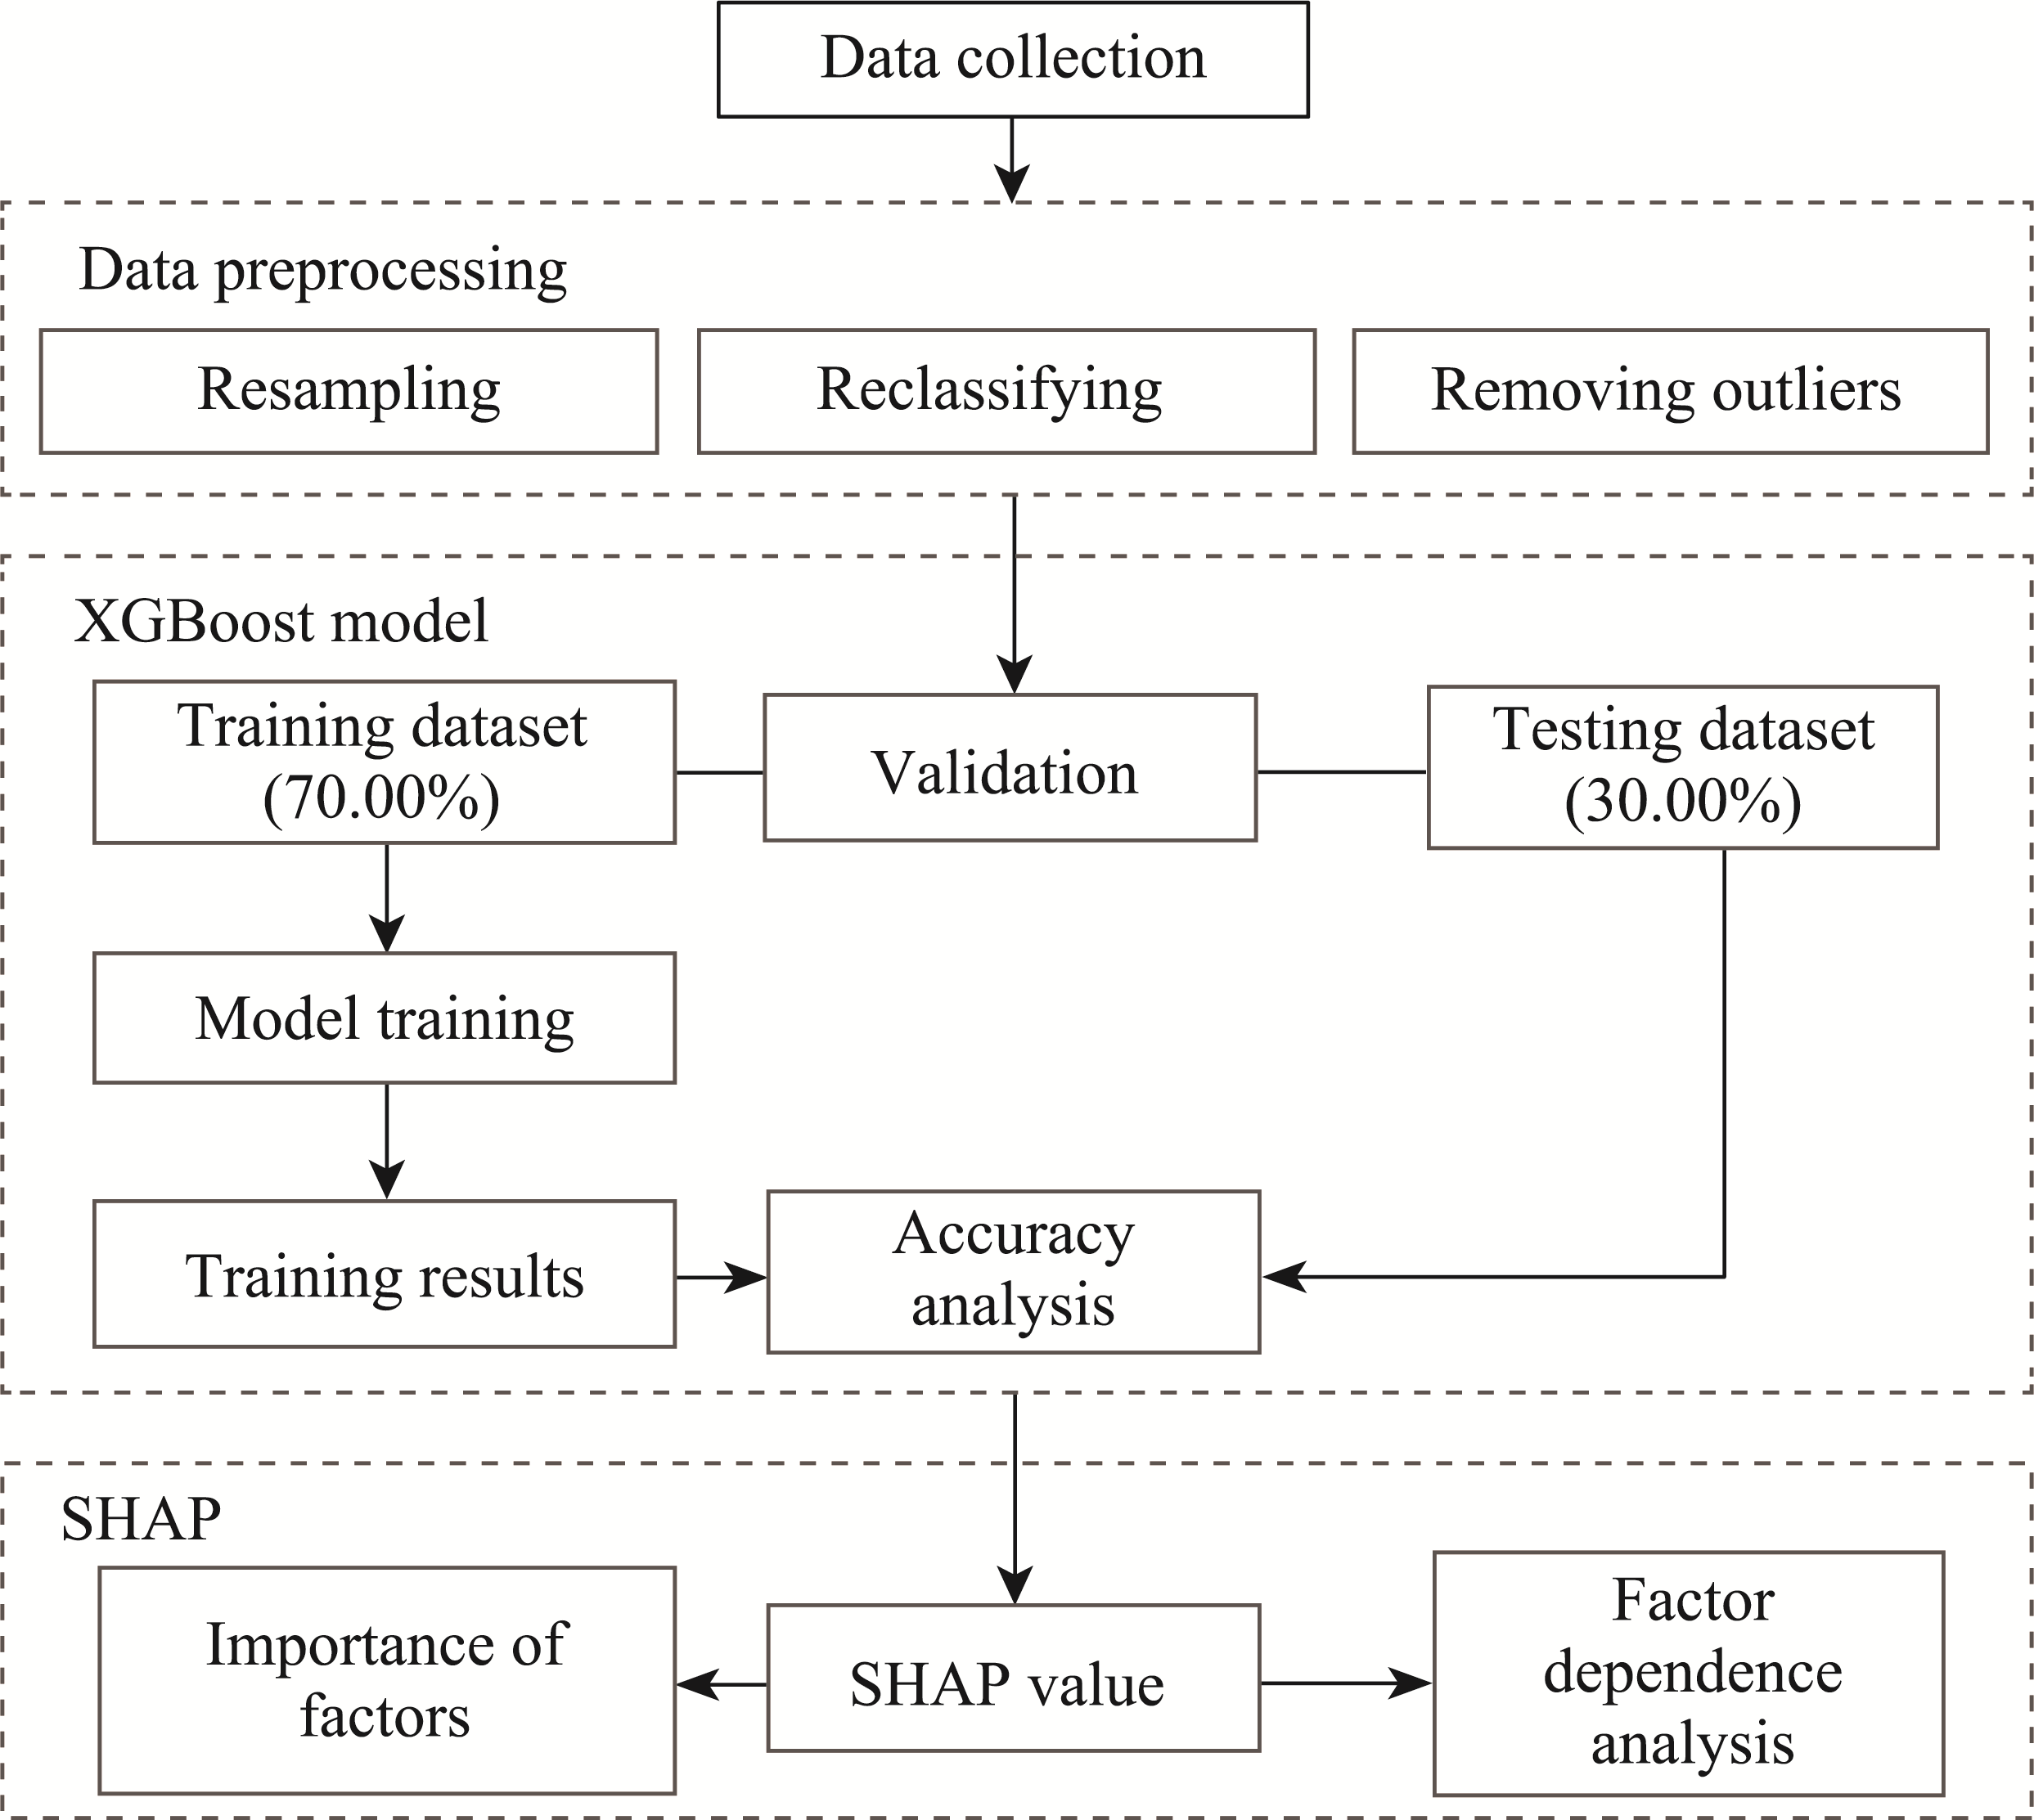
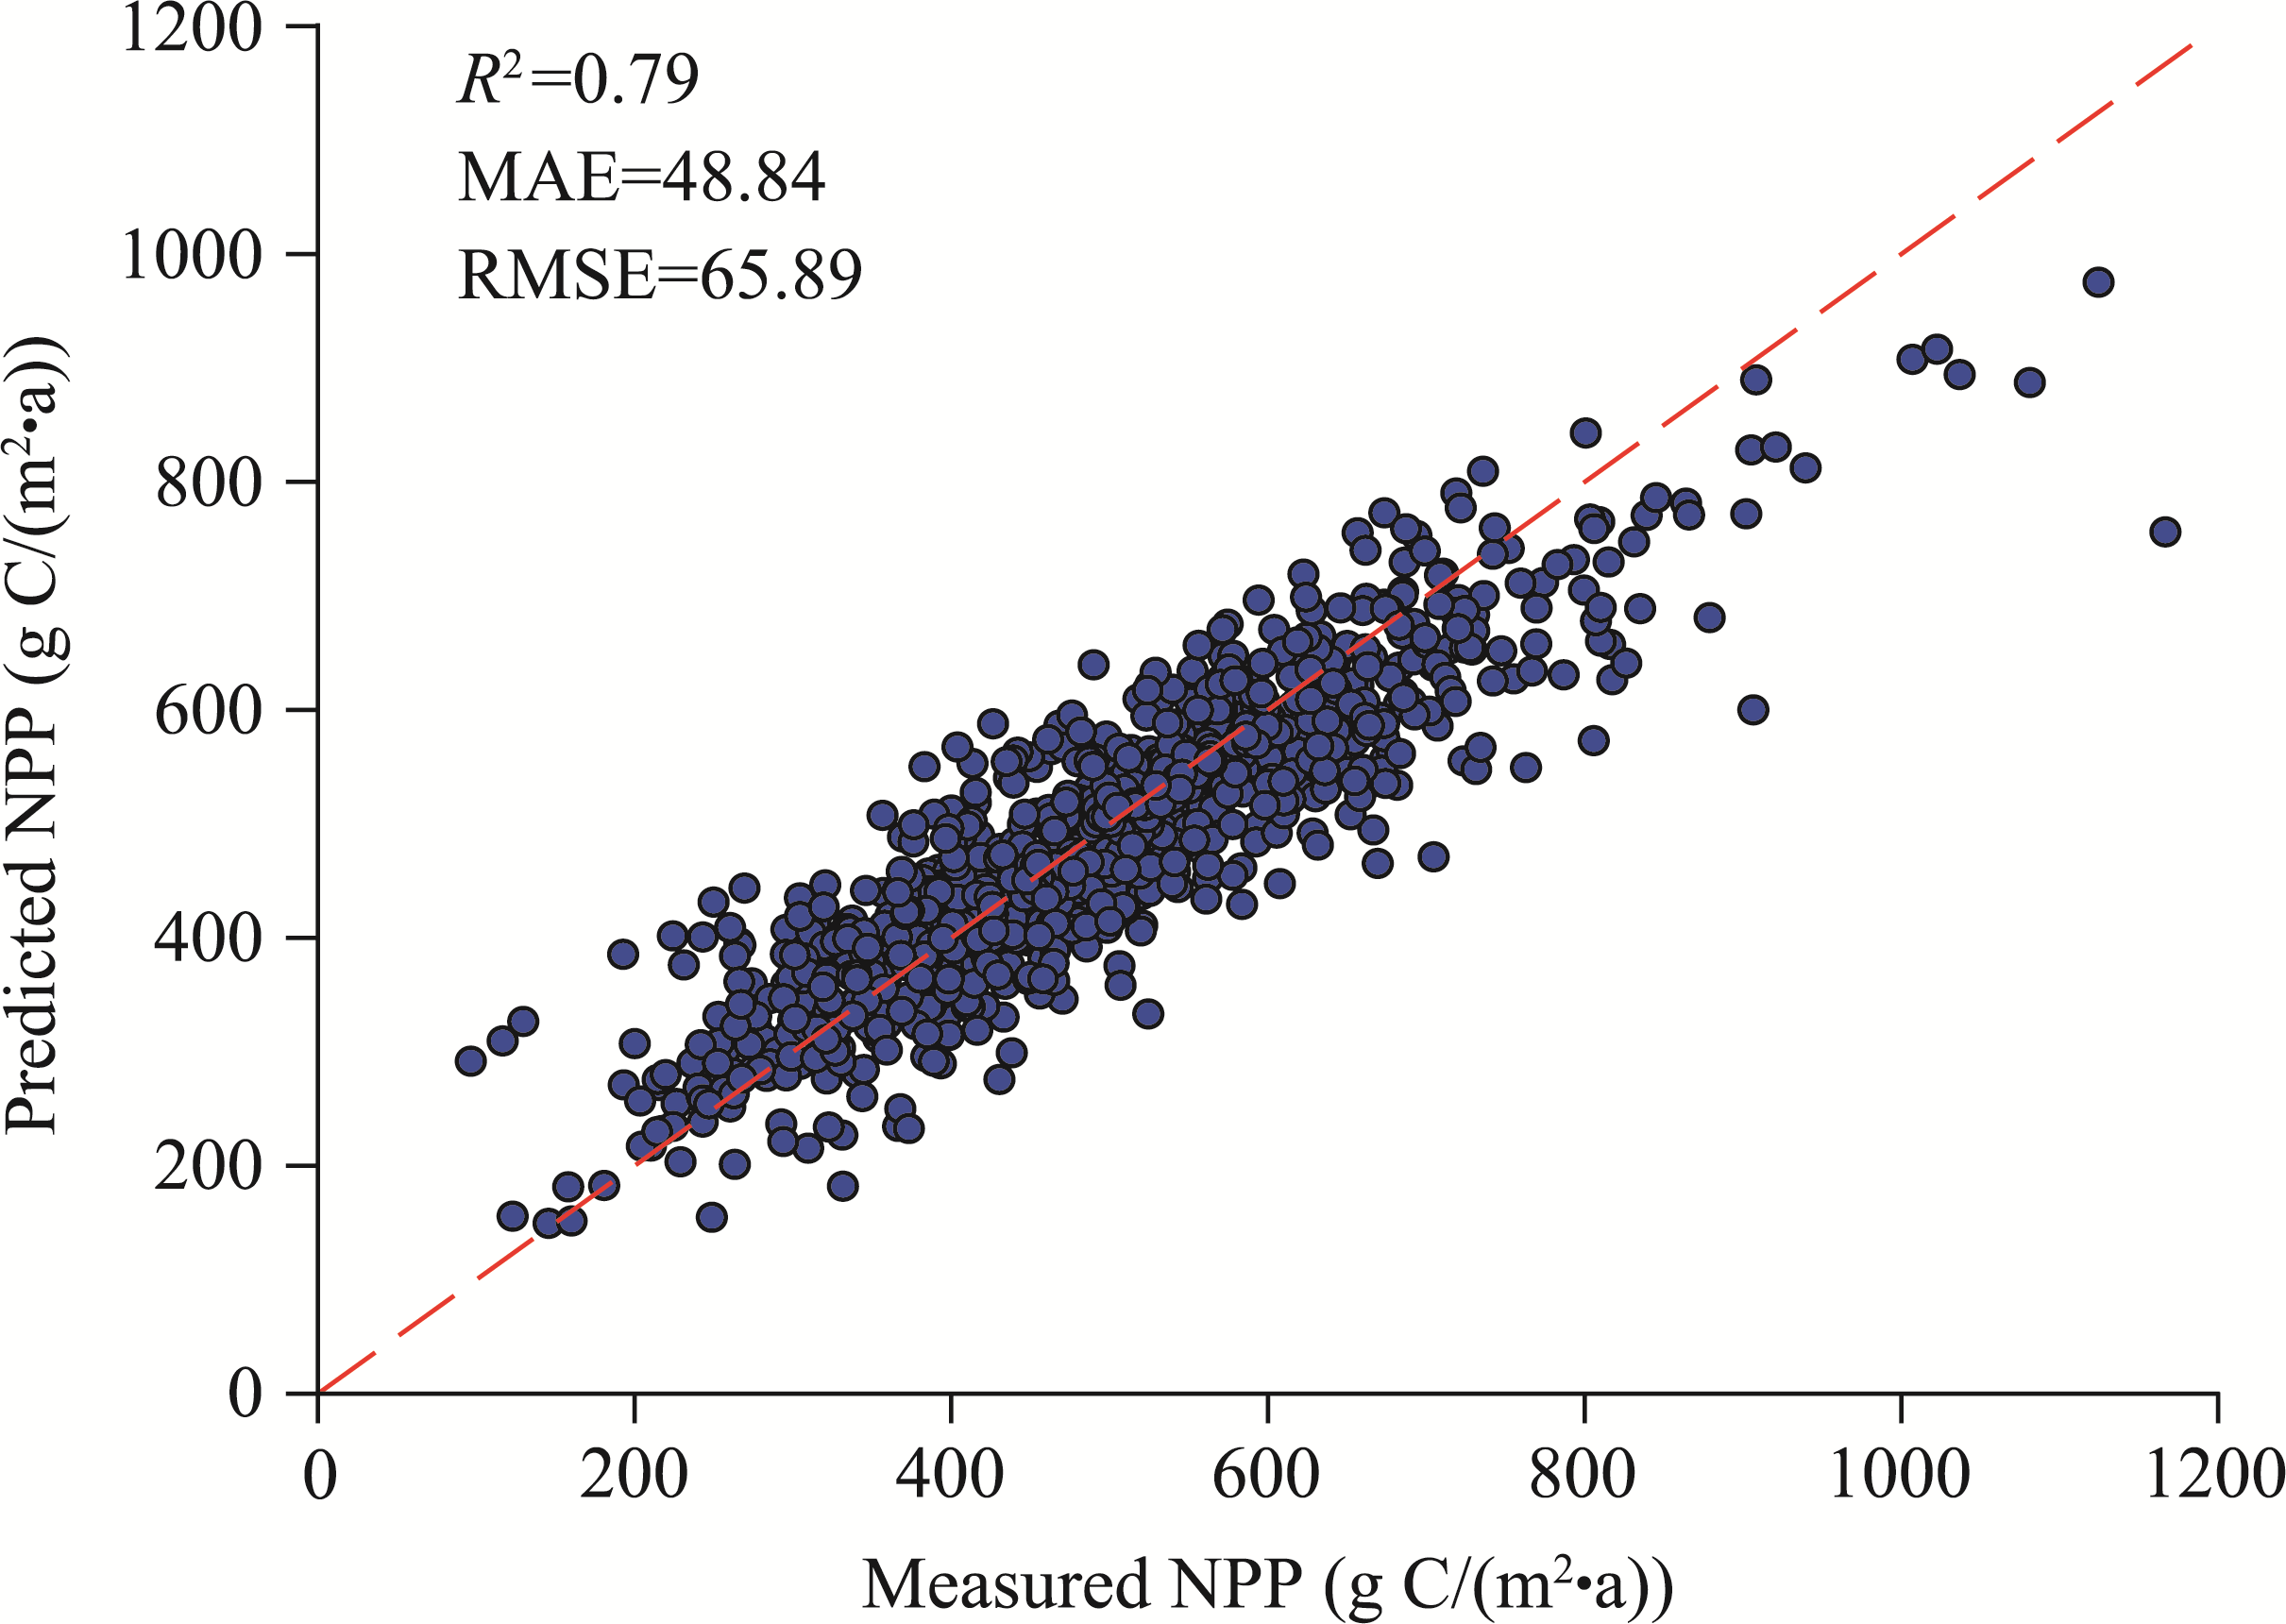
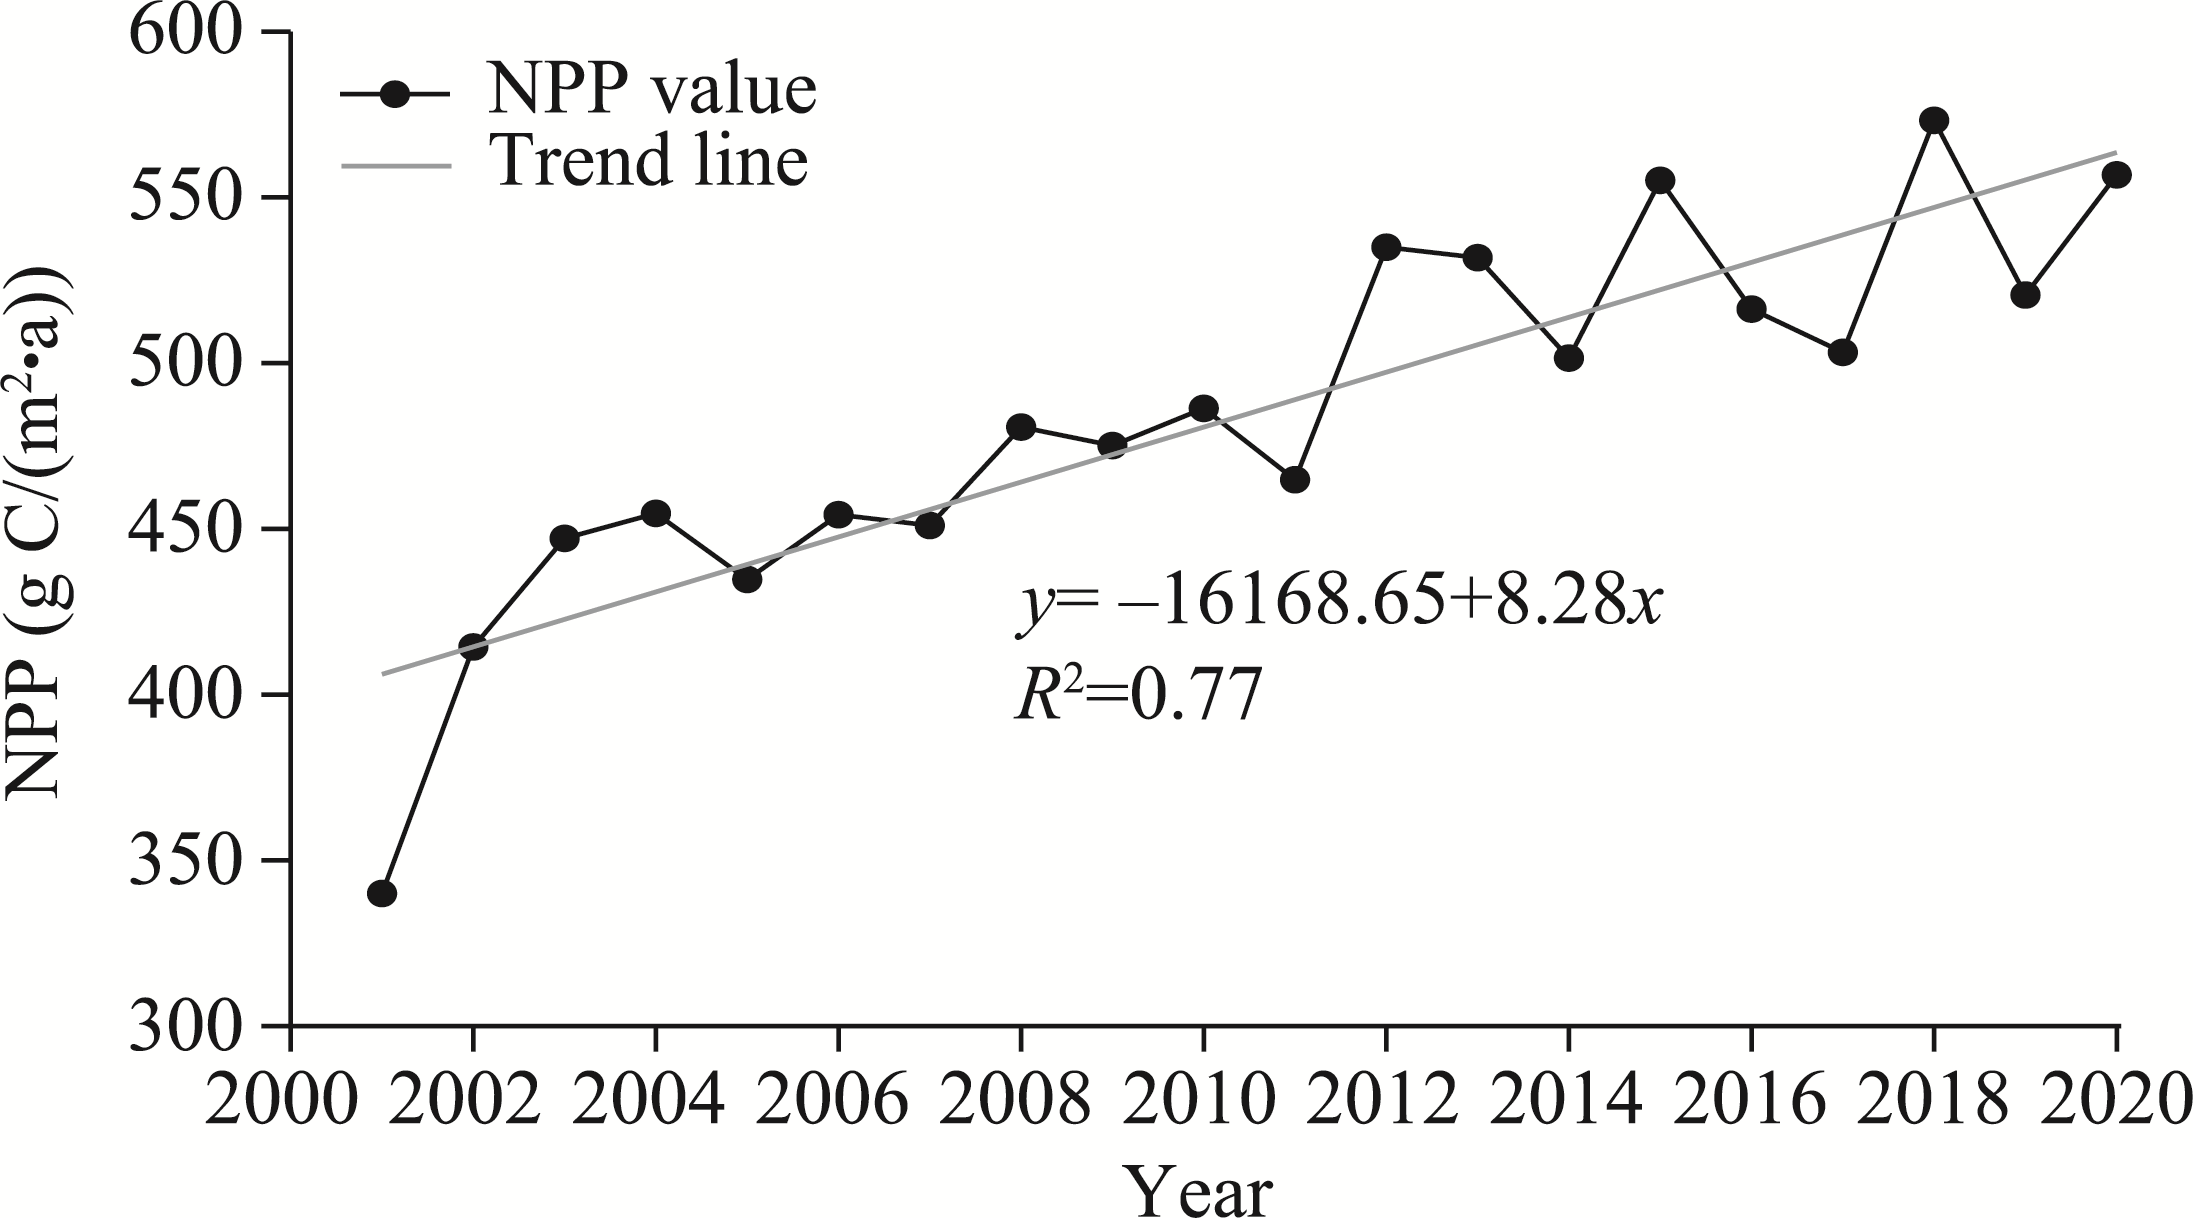
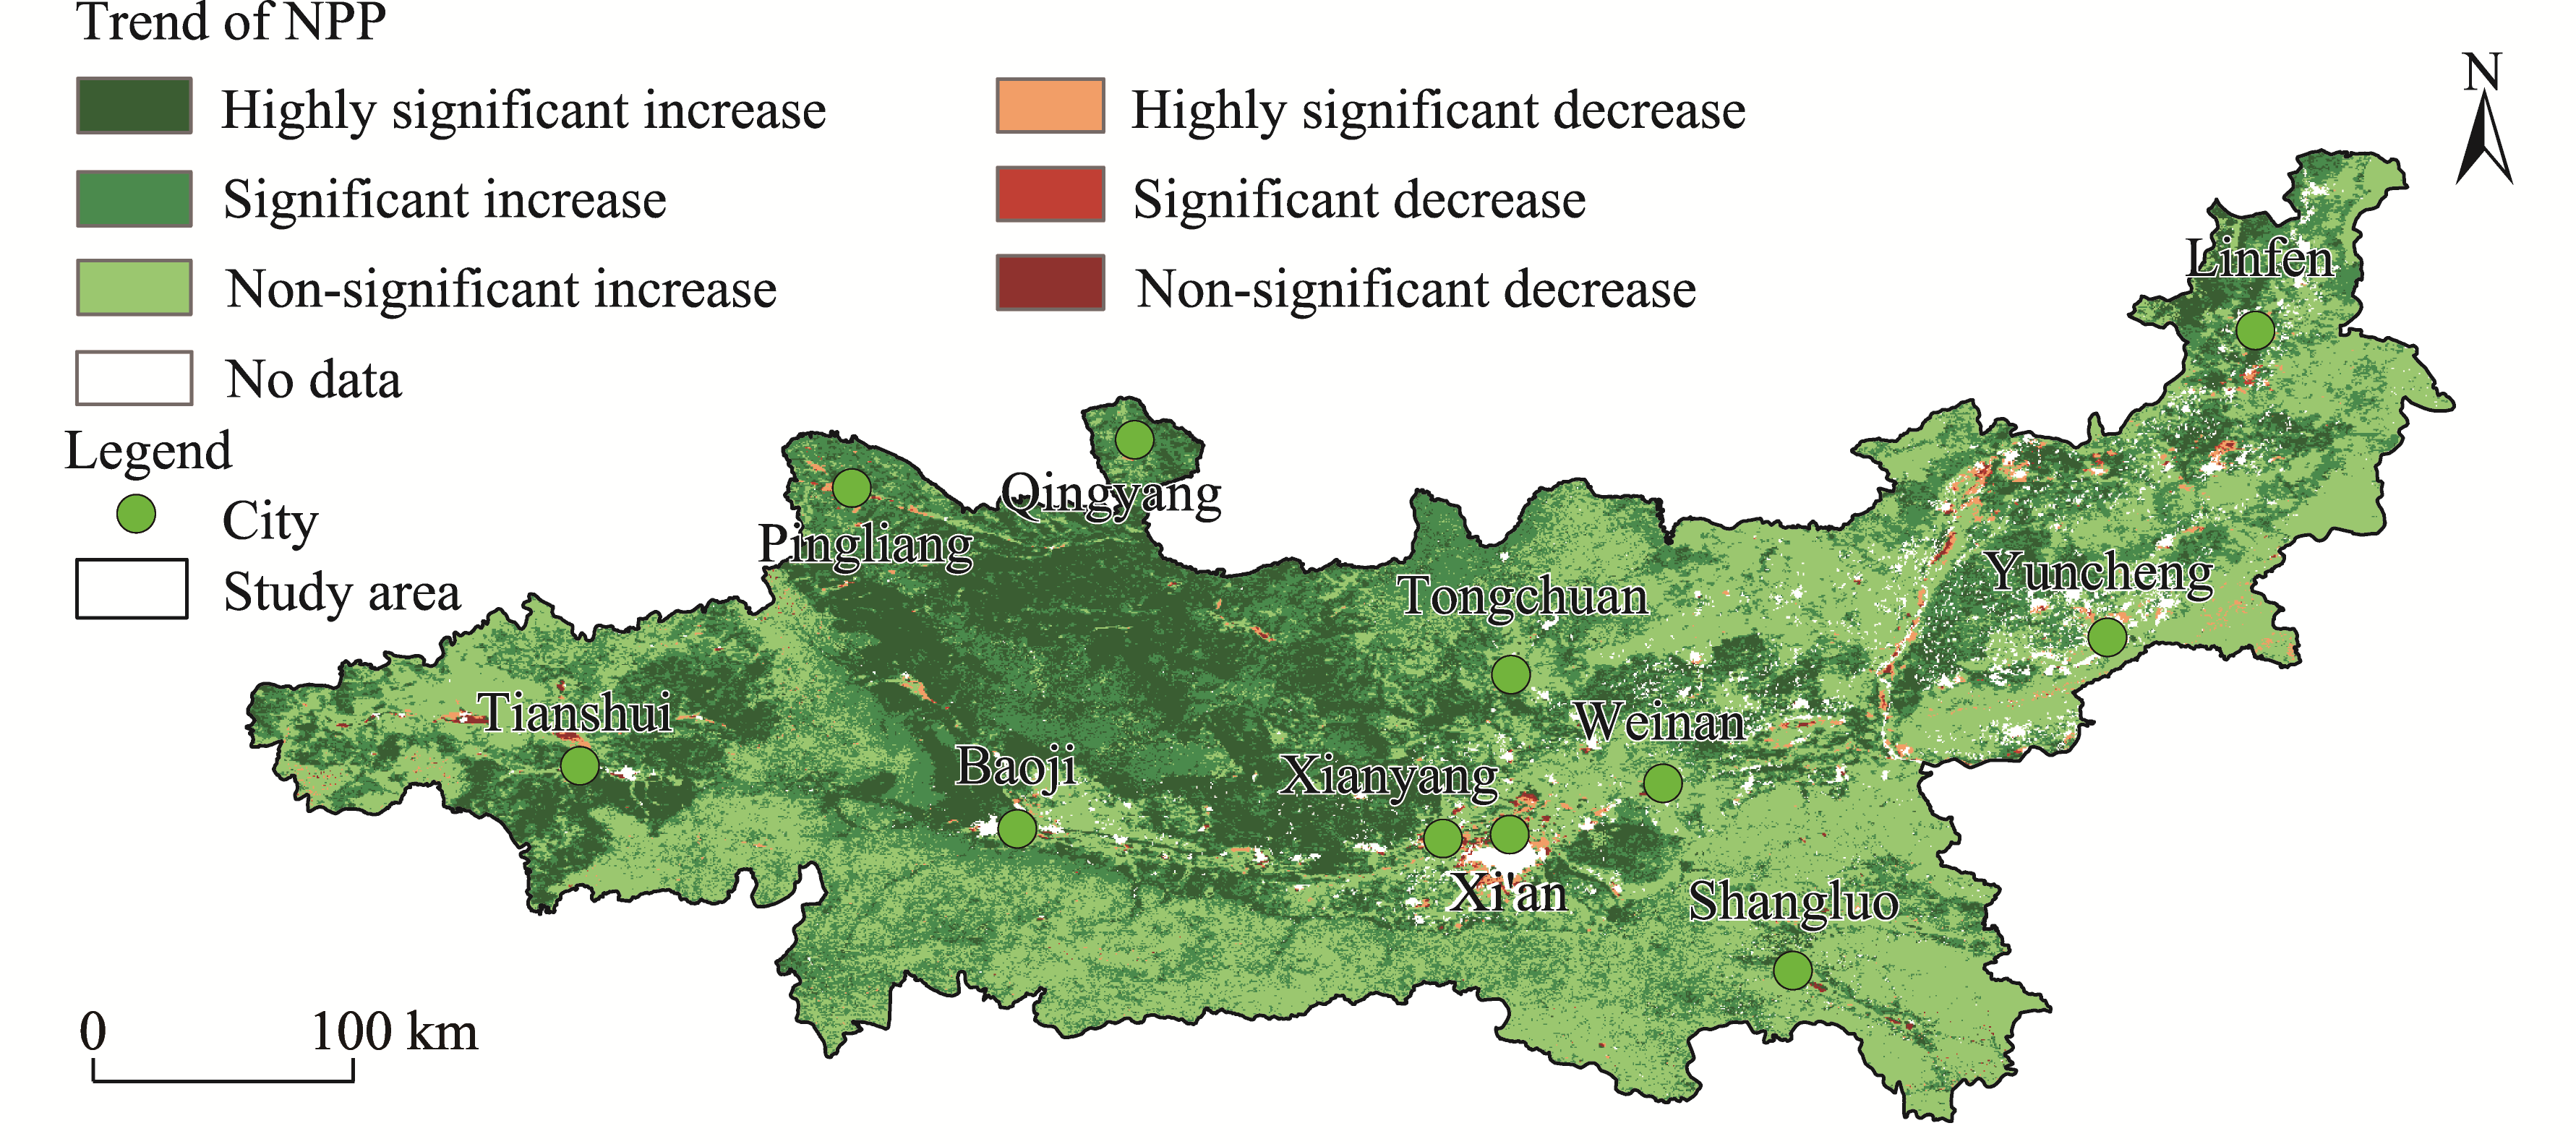
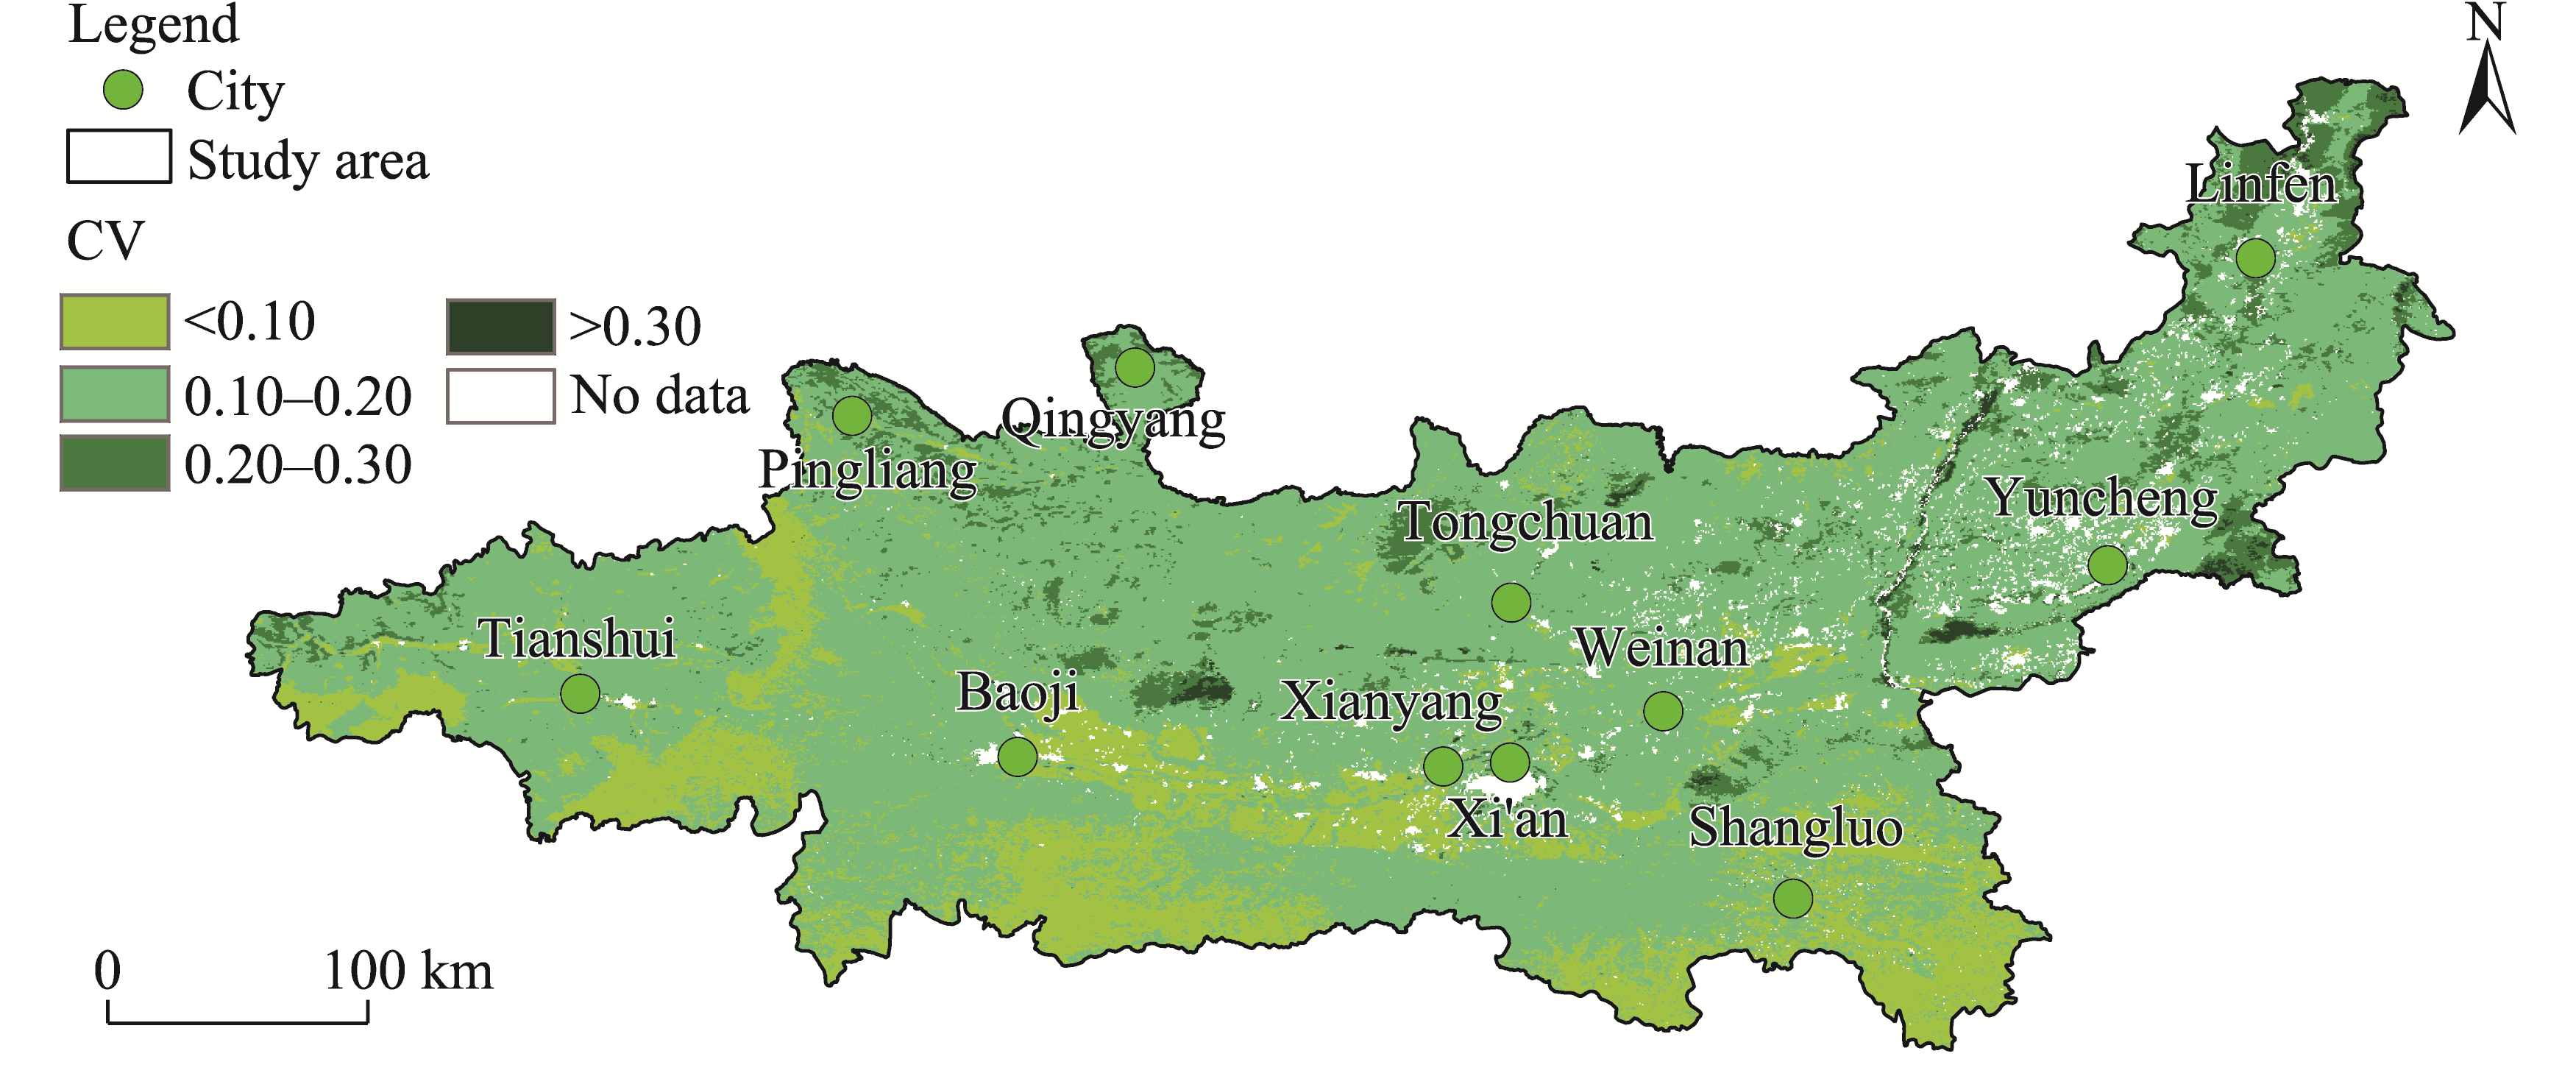
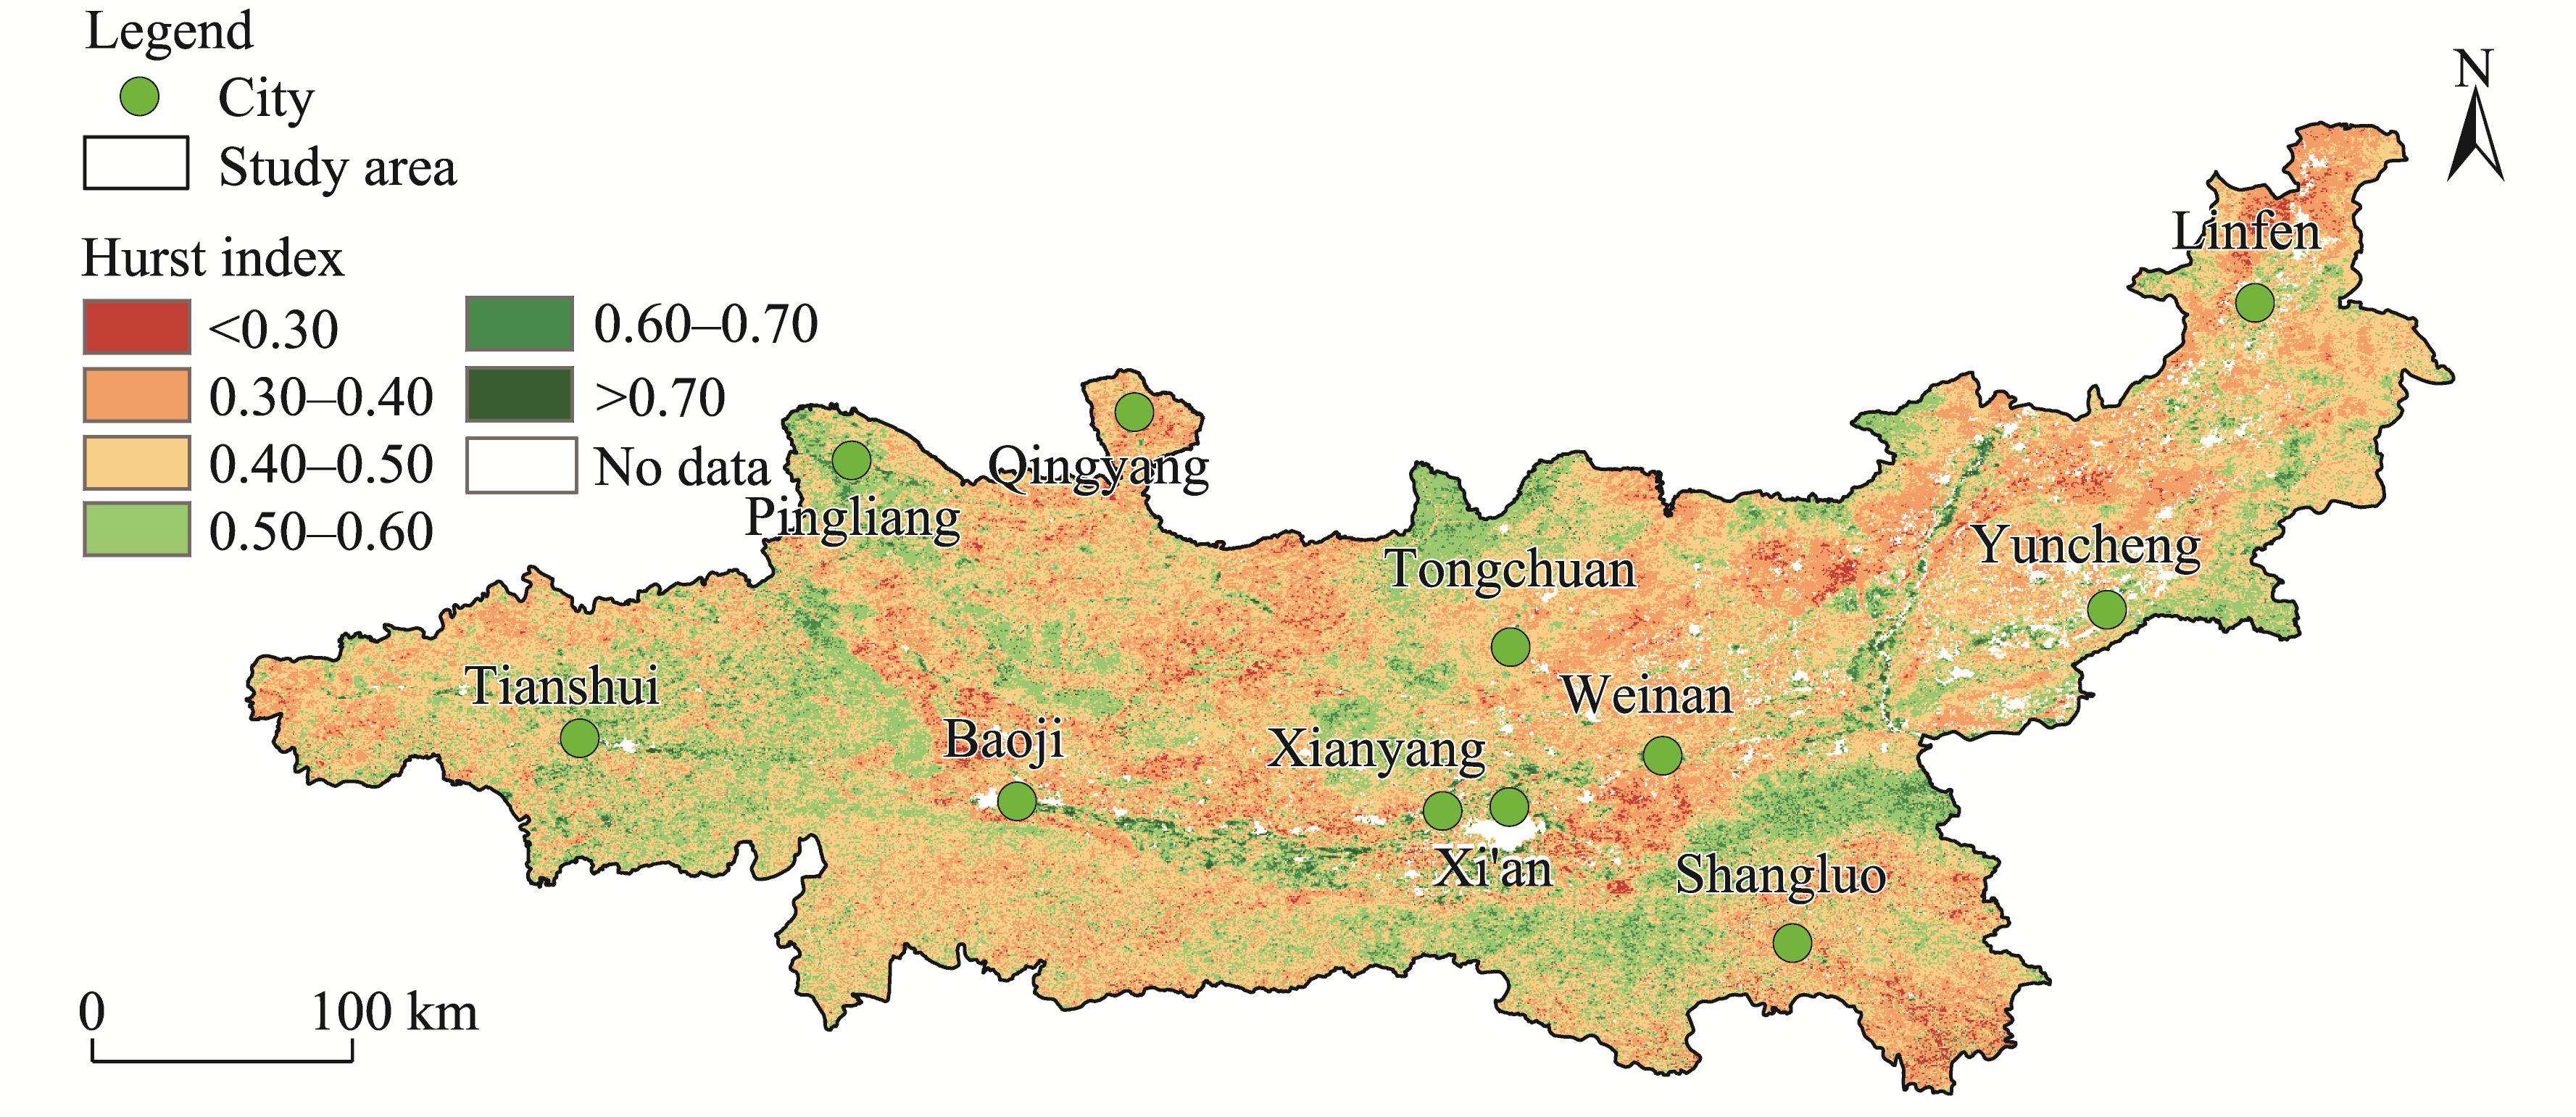
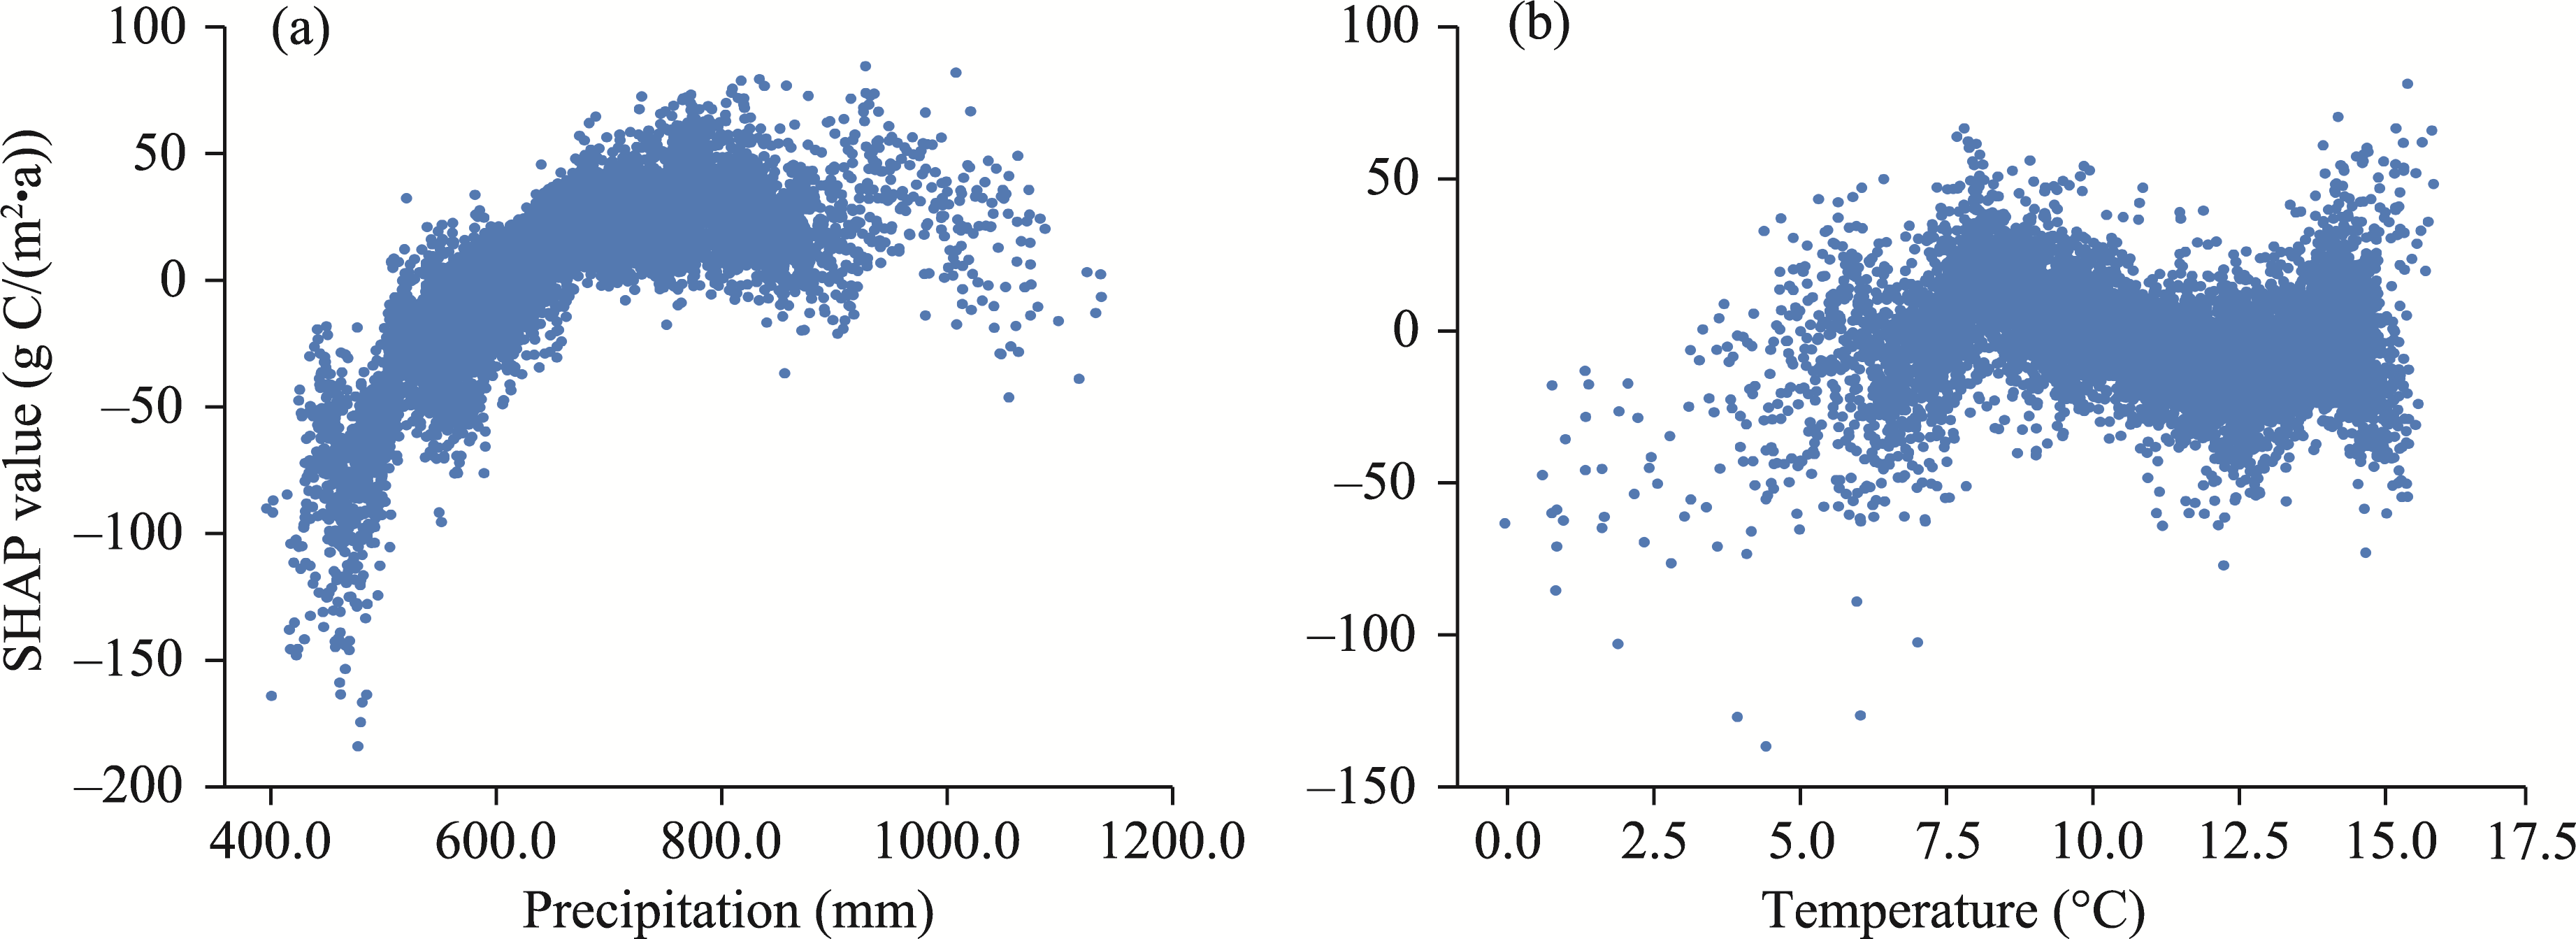
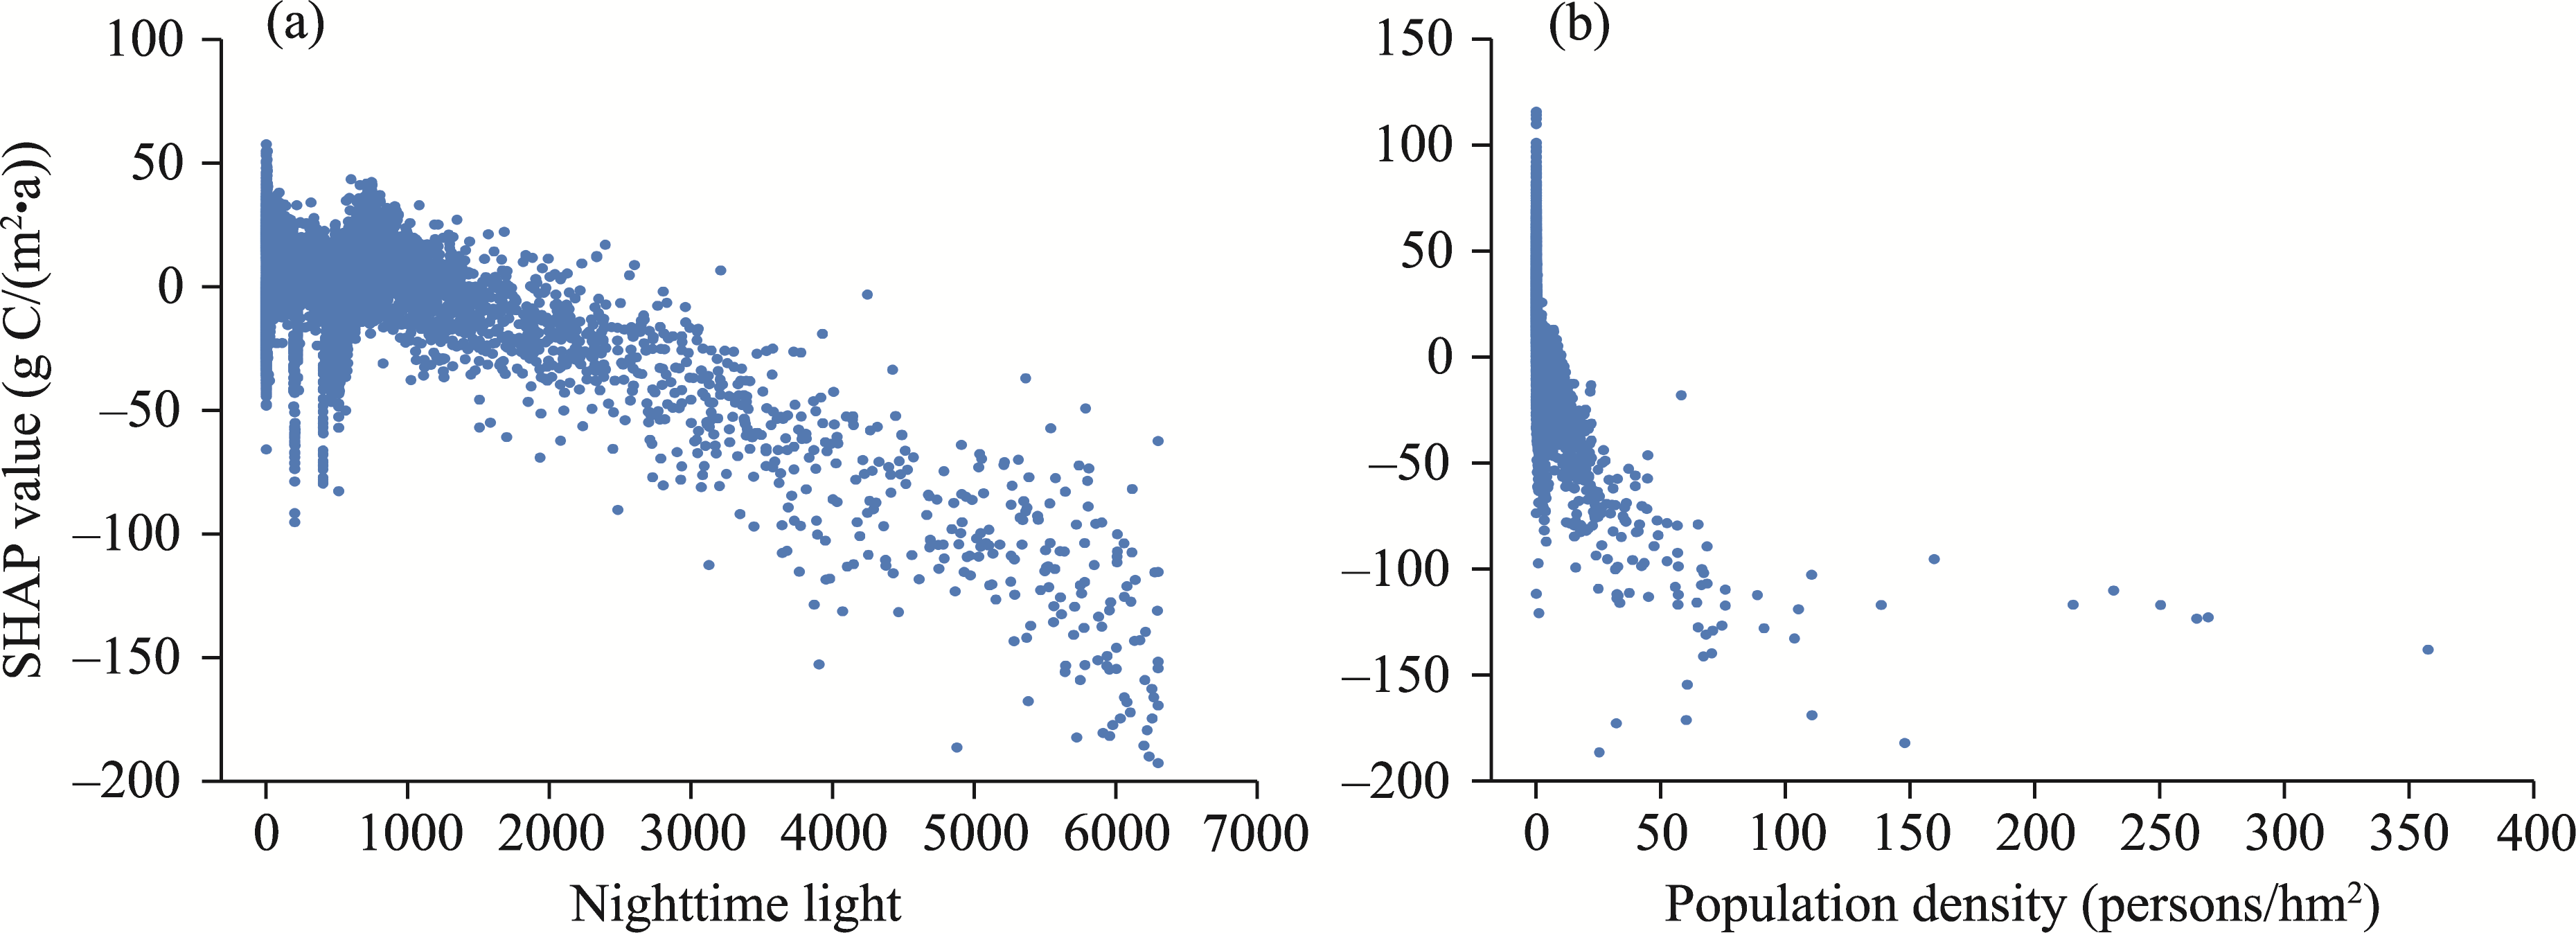
Abstract Studying the spatiotemporal variation and driving mechanisms of vegetation net primary productivity (NPP) in the Guanzhong Plain Urban Agglomeration (GPUA) of China is highly important for regional green and low-carbon development. This study used the Theil-Sen trend analysis, Mann-Kendall trend test, coefficient of variation, Hurst index, and machine learning method (eXtreme Gradient Boosting and SHapley Additive exPlanations (XGBoost-SHAP)) to analyze the spatiotemporal variation of NPP in the GPUA from 2001 to 2020 and reveal its response to climate change and human activities. The results found that during 2001-2020, the averageNPP in the GPUA showed a significant upward trend, with an annual growth rate of 10.84 g C/(m2•a). The multi-year average NPP in the GPUA was 484.83 g C/(m2•a), with higher values in the southwestern Qinling Mountains and lower values in the central and northeastern cropland and built-up areas. The average coefficient of variation of NPP in the GPUA was 0.14, indicating a relatively stable state overall, but 72.72% of the study area showed weak anti-persistence, suggesting that NPP in most areas may have declined in the short term. According to XGBoost-SHAP analyses, elevation, land use type and precipitation were identified as the main driving factors of NPP. Appropriate precipitation and higher temperatures promote NPP growth, whereas extreme climates, high population density, and nighttime lighting inhibit NPP. This study has important theoretical and practical significance for achieving regional sustainable development, offers a scientific basis for formulating effective ecological protection and restoration strategies, and promotes green, coordinated, and sustainable development in the GPUA.
|
|
Received: 26 July 2024
Published: 31 January 2025
|
|
Corresponding Authors:
*HUANG Chenlu (E-mail: nwuhcl@163.com)
|
|
|
| [1] |
Ahmad F, Draz M U, Ozturk I, et al. 2020. Looking for asymmetries and nonlinearities: The nexus between renewable energy and environmental degradation in the northwestern provinces of China. Journal of Cleaner Production, 266: 121714, doi: 10.1016/j.jclepro.2020.121714.
|
|
|
| [2] |
Ahmed S M. 2014. Assessment of irrigation system sustainability using the Theil-Sen estimator of slope of time series. Sustainability Science, 9(3): 293-302.
|
|
|
| [3] |
Airiken M, Li S C. 2024. The dynamic monitoring and driving forces analysis of ecological environment quality in the Tibetan Plateau based on the Google Earth Engine. Remote Sensing, 16(4): 682, doi: 10.3390/rs16040682.
|
|
|
| [4] |
An H, Xiao W D, Huang J. 2023. Relationship of construction land expansion and ecological environment changes in the Three Gorges reservoir area of China. Ecological Indicators, 157: 111209, doi: 10.1016/j.ecolind.2023.111209.
|
|
|
| [5] |
Baptista M L, Goebel K, Henriques E M P. 2022. Relation between prognostics predictor evaluation metrics and local interpretability SHAP values. Artificial Intelligence, 306: 103667, doi: 10.1016/j.artint.2022.103667.
|
|
|
| [6] |
Berhe A A, Harte J, Harden J W, et al. 2007. The significance of the erosion-induced terrestrial carbon sink. BioScience, 57(4): 337-346.
|
|
|
| [7] |
Bullock A, King B. 2011. Evaluating China's Slope Land Conversion Program as sustainable management in Tianquan and Wuqi Counties. Journal of Environmental Management, 92(8): 1916-1922.
doi: 10.1016/j.jenvman.2011.03.002
pmid: 21481524
|
|
|
| [8] |
Chamoli A, Ram Bansal A, Dimri V P. 2007. Wavelet and rescaled range approach for the Hurst coefficient for short and long time series. Computers & Geosciences, 33(1): 83-93.
|
|
|
| [9] |
Chen T Q, Guestrin C. 2016. XGBoost:A scalable tree boosting system. Proceedings of the 22nd ACM SIGKDD International Conference on Knowledge Discovery and Data Mining. New York: Association for Computing Machinery, 785-794.
|
|
|
| [10] |
Chen X, Zhang Y P. 2023. Impacts of climate, phenology, elevation and their interactions on the net primary productivity of vegetation in Yunnan, China under global warming. Ecological Indicators, 154(7725): 110533, doi: 10.1016/j.ecolind.2023.110533.
|
|
|
| [11] |
Chen Y, Guo D B, Cao W J, et al. 2023. Changes in net primary productivity and factor detection in China's Yellow River Basin from 2000 to 2019. Remote Sensing, 15(11): 2798, doi: 10.3390/rs15112798.
|
|
|
| [12] |
Dang X, Ma B B, Xue D Q, et al. 2024. The spatial pattern of polluting enterprises and the effects of local regulation in the Guanzhong Plain Urban Agglomeration. Land, 13(6): 733, doi: 10.3390/land13060733.
|
|
|
| [13] |
De'ath G, Fabricius K E. 2000. Classification and regression trees: A powerful yet simple technique for ecological data analysis. Ecology, 81(11): 3178-3192.
|
|
|
| [14] |
Fang C L, Liu H M, Wang S J. 2021. The coupling curve between urbanization and the eco-environment: China's urban agglomeration as a case study. Ecological Indicators, 130(4): 108107, doi: 10.1016/j.ecolind.2021.108107.
|
|
|
| [15] |
Feng D R, Bao W K, Yang Y Y, et al. 2021. How do government policies promote greening? Evidence from China. Land Use Policy, 104: 105389, doi: 10.1016/j.landusepol.2021.105389.
|
|
|
| [16] |
Feng X, Liu G, Chen J M, et al. 2007. Net primary productivity of China's terrestrial ecosystems from a process model driven by remote sensing. Journal of Environmental Management, 85(3): 563-573.
pmid: 17234327
|
|
|
| [17] |
Gao M D, Piao S L, Chen A P, et al. 2019. Divergent changes in the elevational gradient of vegetation activities over the last 30 years. Nature Communications, 10(1): 2970, doi: 10.1038/s41467-019-11035-w.
|
|
|
| [18] |
Ge W Y, Deng L Q, Wang F, et al. 2021. Quantifying the contributions of human activities and climate change to vegetation net primary productivity dynamics in China from 2001 to 2016. Science of the Total Environment, 773: 145648, doi: 10.1016/j.scitotenv.2021.145648.
|
|
|
| [19] |
Hamilton R I, Papadopoulos P N. 2024. Using SHAP values and machine learning to understand trends in the transient stability limit. IEEE Transactions on Power Systems, 39(1): 1384-1397.
|
|
|
| [20] |
Hassija V, Chamola V, Mahapatra A, et al. 2024. Interpreting black-box models: A review on explainable artificial intelligence. Cognitive Computation, 16(1): 45-74.
|
|
|
| [21] |
Hatfield J L, Prueger J H. 2015. Temperature extremes: Effect on plant growth and development. Weather and Climate Extremes, 10: 4-10.
|
|
|
| [22] |
Hu W B, Li Z F, Chen D L, et al. 2024. Unlocking the potential of collaborative innovation to narrow the inter-city urban land green use efficiency gap: Empirical study on 19 urban agglomerations in China. Environmental Impact Assessment Review, 104: 107341, doi: 10.1016/j.eiar.2023.107341.
|
|
|
| [23] |
Kang J M, Li C L, Zhang B L, et al. 2023. How do natural and human factors influence ecosystem services changing? A case study in two most developed regions of China. Ecological Indicators, 146(3): 109891, doi: 10.1016/j.ecolind.2023.109891.
|
|
|
| [24] |
Kaur G, Singh G, Motavalli P P, et al. 2020. Impacts and management strategies for crop production in waterlogged or flooded soils: A review. Agronomy Journal, 112(3): 1475-1501.
|
|
|
| [25] |
Kavzoglu T, Teke A. 2022. Advanced hyperparameter optimization for improved spatial prediction of shallow landslides using extreme gradient boosting (XGBoost). Bulletin of Engineering Geology and the Environment, 81(5): 201, doi: 10.1007/s10064-022-02708-w.
|
|
|
| [26] |
Kim J Y, Shin U H, Kim K. 2023. Predicting biomass composition and operating conditions in fluidized bed biomass gasifiers: An automated machine learning approach combined with cooperative game theory. Energy, 280: 128138, doi: 10.1016/j.energy.2023.128138.
|
|
|
| [27] |
Li L N, Xia R, Dou M, et al. 2024. Integrated machine learning reveals aquatic biological integrity patterns in semi-arid watersheds. Journal of Environmental Management, 359(5): 121054, doi: 10.1016/j.jenvman.2024.121054.
|
|
|
| [28] |
Li L Y, Zeng Z Z, Zhang G, et al. 2022. Exploring the individualized effect of climatic drivers on MODIS net primary productivity through an explainable machine learning framework. Remote Sensing, 14(17): 4401, doi: 10.3390/rs14174401.
|
|
|
| [29] |
Li Y K, Li X Z, Lu T. 2023. Coupled coordination analysis between urbanization and eco-environment in ecologically fragile areas: A case study of Northwestern Sichuan, Southwest China. Remote Sensing, 15(6): 1661, doi: 10.3390/rs15061661.
|
|
|
| [30] |
Li Z Q. 2022. Extracting spatial effects from machine learning model using local interpretation method: An example of SHAP and XGBoost. Computers, Environment and Urban Systems, 96(7): 101845, doi: 10.1016/j.compenvurbsys.2022.101845.
|
|
|
| [31] |
Lin X Q, Wang Y, Wang S J, et al. 2015. Spatial differences and driving forces of land urbanization in China. Journal of Geographical Sciences, 25(5): 545-558.
doi: 10.1007/s11442-015-1186-7
|
|
|
| [32] |
Liu Y Y, Yang Y, Wang Q, et al. 2019. Evaluating the responses of net primary productivity and carbon use efficiency of global grassland to climate variability along an aridity gradient. Science of the Total Environment, 652: 671-682.
|
|
|
| [33] |
Lundberg S M, Lee S I. 2017. A unified approach to interpreting model predictions. In: Advances in Neural Information Processing Systems 30. New York:Curran Associates Inc., 4768-4777.
|
|
|
| [34] |
Ma L Y, Sun B H. 2020. Machine learning and AI in marketing—Connecting computing power to human insights. International Journal of Research in Marketing, 37(3): 481-504.
|
|
|
| [35] |
Mann H B. 1945. Nonparametric tests against trend. Econometrica, 13(3): 245-259.
|
|
|
| [36] |
Ouyang Y, Li X W, Zhou W J, et al. 2024. Integration of machine learning XGBoost and SHAP models for NBA game outcome prediction and quantitative analysis methodology. PLoS ONE, 19(7): e0307478, doi: 10.1371/journal.pone.0307478.
|
|
|
| [37] |
Piao S L, Fang J Y. 2002. Terrestrial net primary production and its spatio-temporal patterns in Qinghai-Xizang Plateau, China during 1982-1999. Journal of Natural Resources, 17(3): 373-380. (in Chinese)
|
|
|
| [38] |
Pichler M, Hartig F. 2023. Machine learning and deep learning—A review for ecologists. Methods in Ecology and Evolution, 14(4): 994-1016.
|
|
|
| [39] |
Sagi O, Rokach L. 2021. Approximating XGBoost with an interpretable decision tree. Information Sciences, 572: 522-542.
|
|
|
| [40] |
Saltelli A, Annoni P. 2010. How to avoid a perfunctory sensitivity analysis. Environmental Modelling & Software, 25(12): 1508-1517.
|
|
|
| [41] |
Scowen M, Athanasiadis I N, Bullock J M, et al. 2021. The current and future uses of machine learning in ecosystem service research. Science of the Total Environment, 799: 149263, doi: 10.1016/j.scitotenv.2021.149263.
|
|
|
| [42] |
Singh S. 2018. Understanding the role of slope aspect in shaping the vegetation attributes and soil properties in Montane ecosystems. Tropical Ecology, 59(3): 417-430.
|
|
|
| [43] |
Tufail S, Riggs H, Tariq M, et al. 2023. Advancements and challenges in machine learning: a comprehensive review of models, libraries, applications, and algorithms. Electronics, 12(8): 1789, doi: 10.3390/electronics12081789.
|
|
|
| [44] |
Wang G J, Peng W F, Zhang L D, et al. 2023. Quantifying the impacts of natural and human factors on changes in NPP using an optimal parameters-based geographical detector. Ecological Indicators, 155(3): 111018, doi: 10.1016/j.ecolind.2023.111018.
|
|
|
| [45] |
Wang J F, Xu C D. 2017. Geodetector: Principle and prospective. Acta Geographica Sinica, 72(1): 116-134. (in Chinese)
doi: 10.11821/dlxb201701010
|
|
|
| [46] |
Wang K, Tian J, Zheng C, et al. 2021. Interpretable prediction of 3-year all-cause mortality in patients with heart failure caused by coronary heart disease based on machine learning and SHAP. Computers in Biology and Medicine, 137(5): 104813, doi: 10.1016/j.compbiomed.2021.104813.
|
|
|
| [47] |
Whittaker R H, Likens G E. 1975. The Biosphere and Man.In: Lieth H, Whittaker R H. Primary Productivity of the Biosphere. Berlin, Heidelberg: Springer Berlin, 305-328.
|
|
|
| [48] |
Wu D D, Xie X H, Tong J X, et al. 2020. Sensitivity of vegetation growth to precipitation in a typical afforestation area in the Loess Plateau: Plant-water coupled modelling. Ecological Modelling, 430(16): 109128, doi: 10.1016/j.ecolmodel.2020.109128.
|
|
|
| [49] |
Yang J X, Ma X, Zhao X Y, et al. 2022. Spatiotemporal of the coupling relationship between ecosystem services and human well-being in Guanzhong Plain Urban Agglomeration. International Journal of Environmental Research and Public Health, 19(19): 12535, doi: 10.3390/ijerph191912535.
|
|
|
| [50] |
Yang L, Meng H H, Wang J T, et al. 2024. The vulnerability assessment and obstacle factor analysis of urban agglomeration along the Yellow River in China from the perspective of production-living-ecological space. PLoS ONE, 19(4): e0299729, doi: 10.1371/journal.pone.0299729.
|
|
|
| [51] |
Yang S, Su H. 2022. Multi-scenario simulation of ecosystem service values in the Guanzhong Plain Urban Agglomeration, China. Sustainability, 14(14): 8812, doi: 10.3390/su14148812.
|
|
|
| [52] |
Ye D, Yang L, Zhou M. 2023. Spatiotemporal variation in ecosystem health and its driving factors in Guizhou Province. Land, 12(7): 1439, doi: 10.3390/land12071439.
|
|
|
| [53] |
Yuan Z, Wang Y Q, Xu J J, et al. 2021. Effects of climatic factors on the net primary productivity in the source region of Yangtze. Scientific Reports, 11: 1376, doi: 10.1038/s41598-020-80494-9.
pmid: 33446790
|
|
|
| [54] |
Zhang B Q, Tian L, He C S, et al. 2023. Response of erosive precipitation to vegetation restoration and its effect on soil and water conservation over China's Loess Plateau. Water Resources Research, 59(1): e2022WR033382, doi: 10.1029/2022WR033382.
|
|
|
| [55] |
Zhao S Q, Da L J, Tang Z Y, et al. 2006. Ecological consequences of rapid urban expansion: Shanghai, China. Frontiers in Ecology and the Environment, 4(7): 341-346.
|
|
|
| [56] |
Zhao Y H, Qu Z, Zhang Y, et al. 2022. Effects of human activity intensity on habitat quality based on nighttime light remote sensing: A case study of Northern Shaanxi, China. Science of the Total Environment, 851(126): 158037, doi: 10.1016/j.scitotenv.2022.158037.
|
|
|
|
Viewed |
|
|
|
Full text
|
|
|
|
|
Abstract
|
|
|
|
|
Cited |
|
|
|
|
| |
Shared |
|
|
|
|
| |
Discussed |
|
|
|
|