| Research article |
|

|
|
|
| Mechanistic insights into mixed gravel-soil mulching effects on soil hydrology in arid ecosystems: A field micro-lysimeter study |
JIA Zhenjiang1, LIU Xuezhi1,2, JIA Zixuan3, AN Wenju1, ZHAO Guangxing4, LIU Qiaoling5, WU Yangyang1, HUANG Yahao1, MA Bo1,2, LI Wangcheng1,2,6,*( ) ) |
1 School of Civil and Hydraulic Engineering, Ningxia University, Yinchuan 750021, China
2 Engineering Research Center for Efficient Utilization of Modern Agricultural Water Resources in Arid Regions, Ministry of Education, Yinchuan 750021, China
3 College of Agriculture, Nanjing Agricultural University, Nanjing 210095, China
4 Xinjiang Institute of Ecology and Geography, Chinese Academy of Sciences, Urumqi 830011, China
5 College of Water Resources and Civil Engineering, China Agricultural University, Beijing 100083, China
6 State Key Laboratory of Land Degradation and Ecological Restoration in Northwest China, Yinchuan 750021, China |
|
|
|
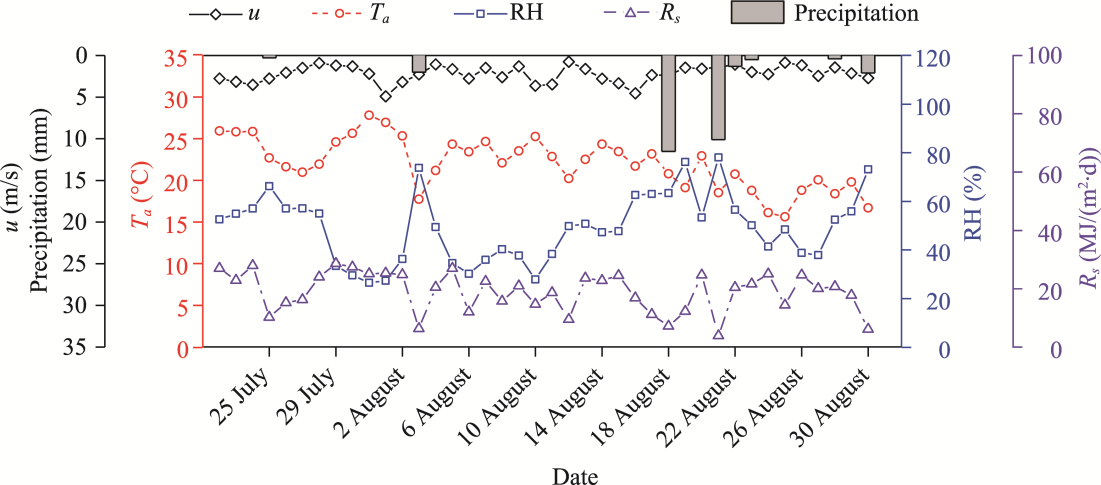
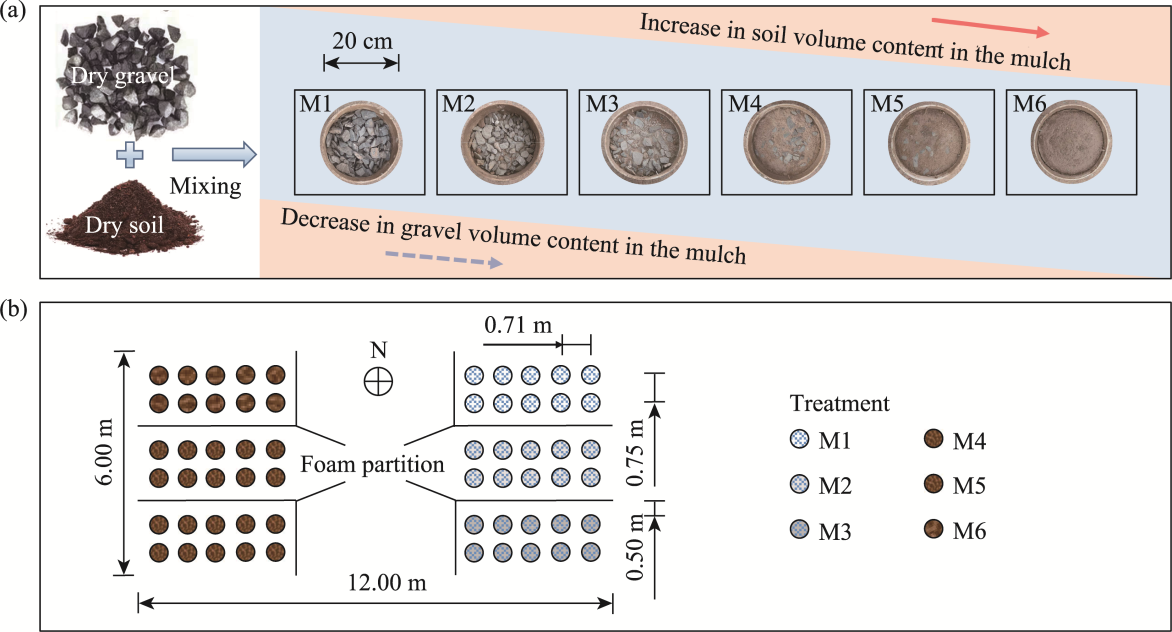
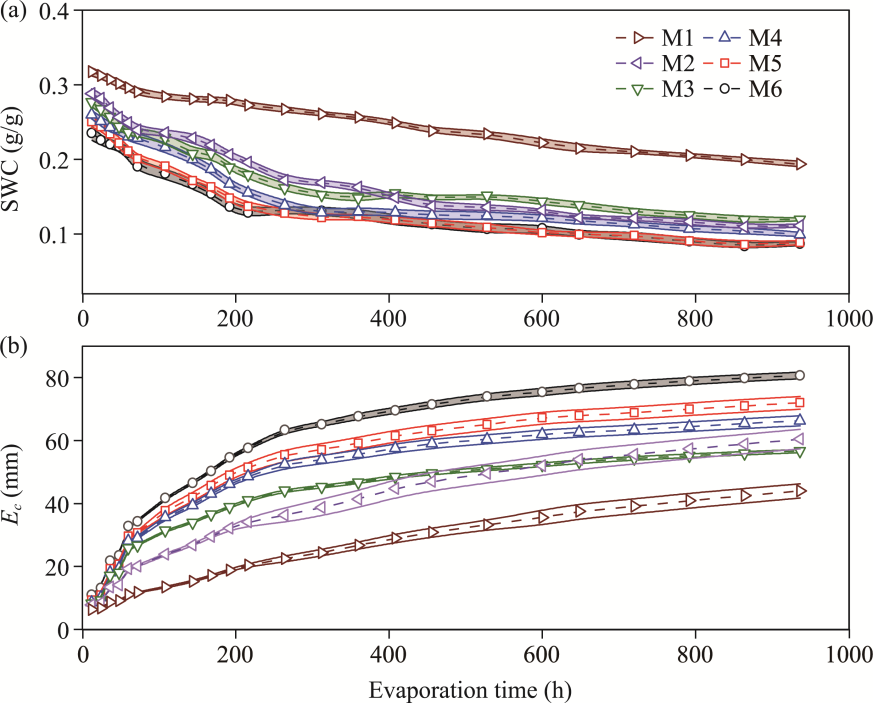
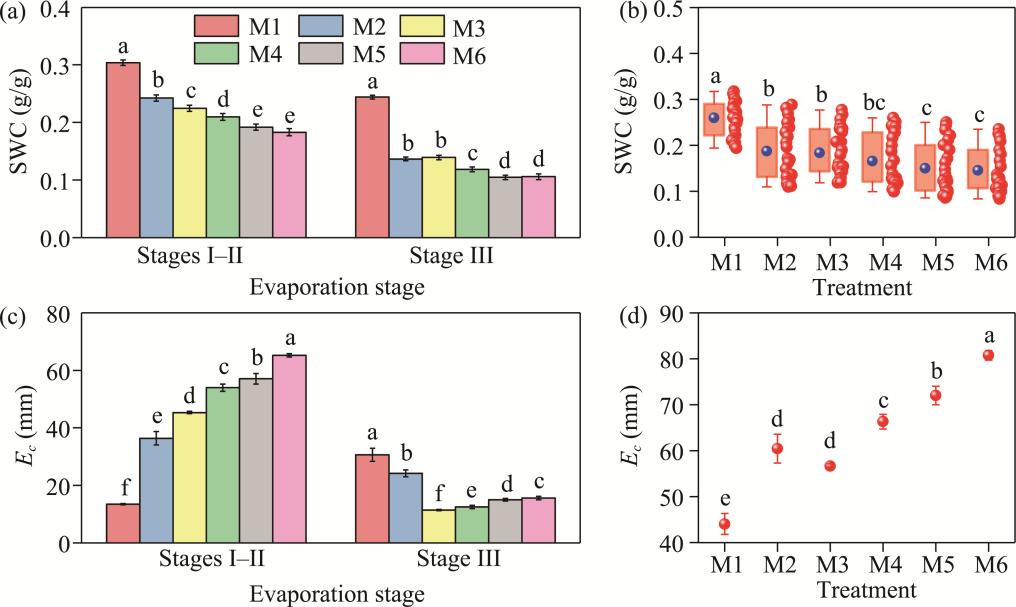
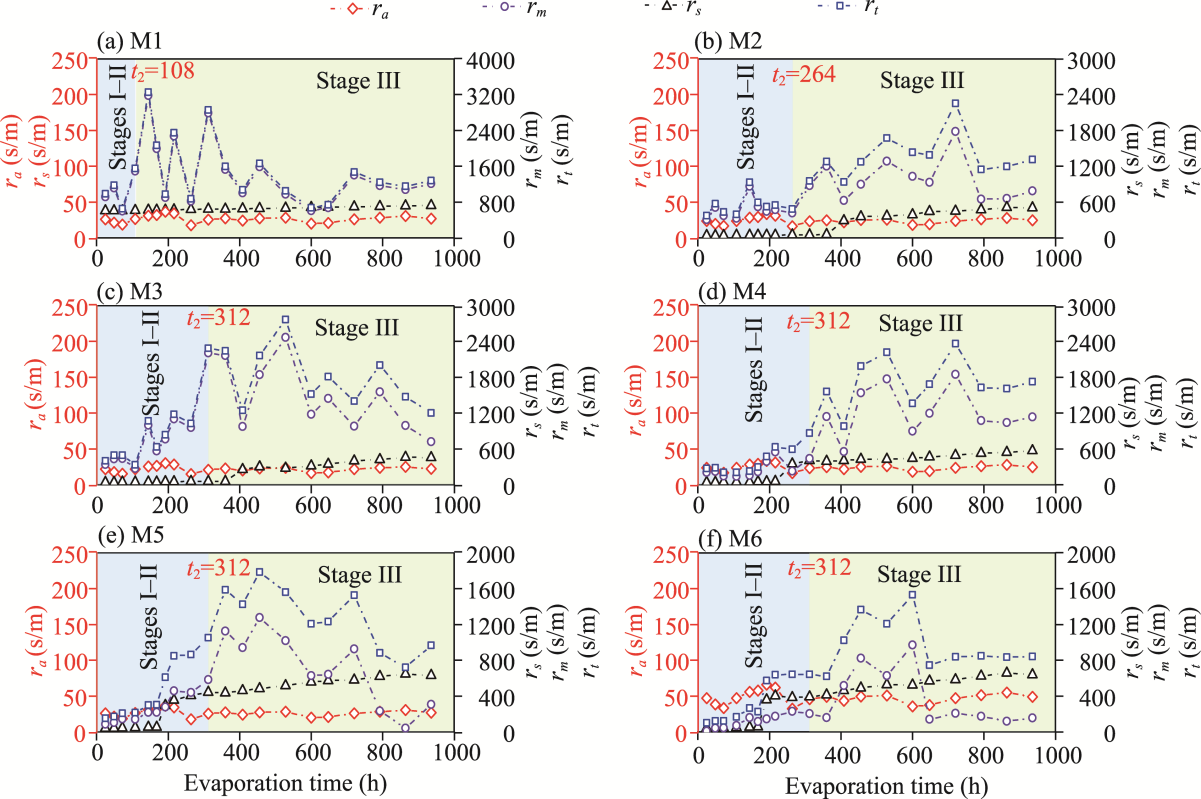
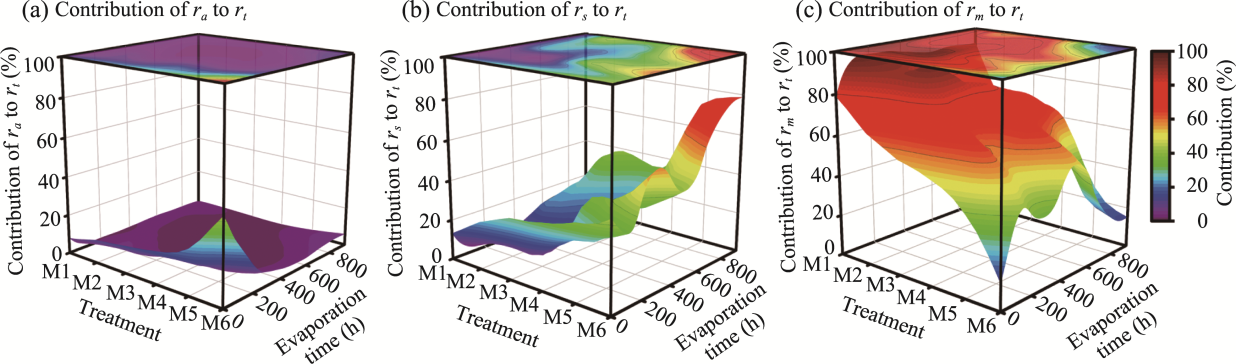
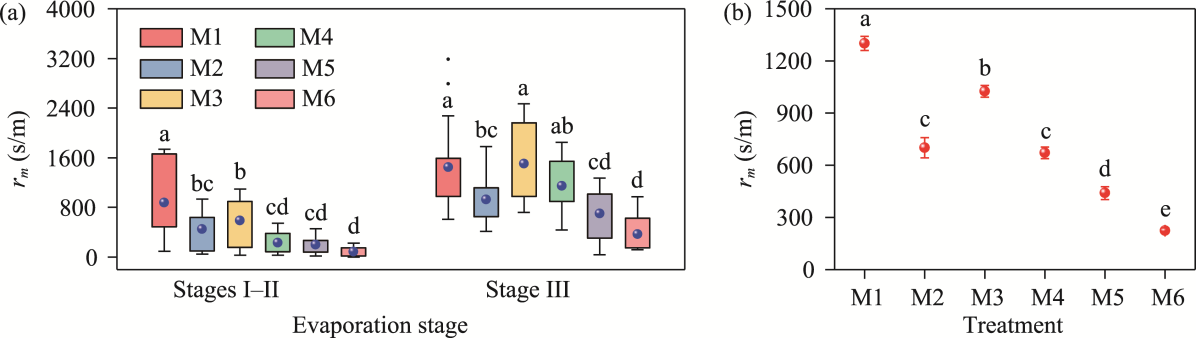
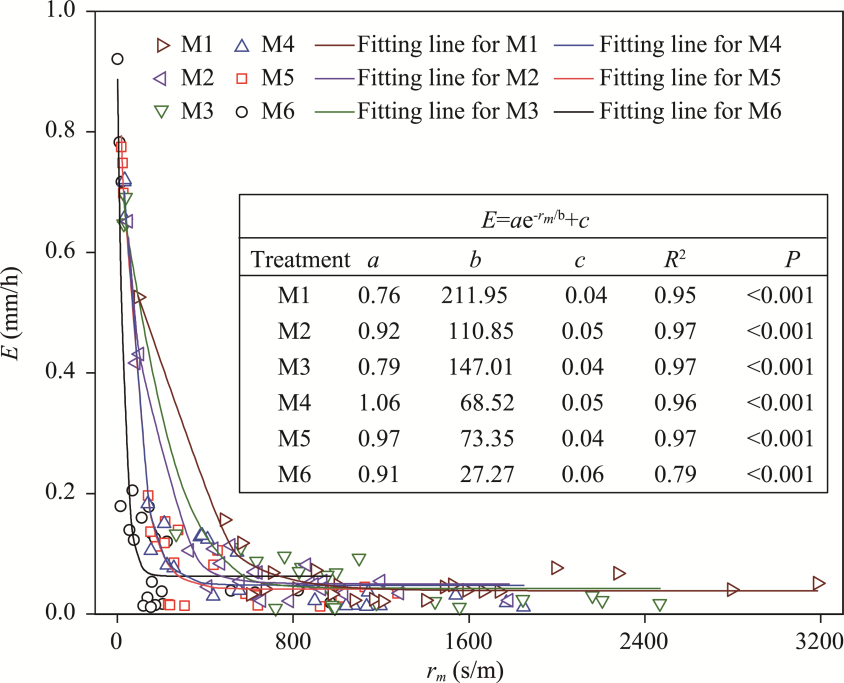
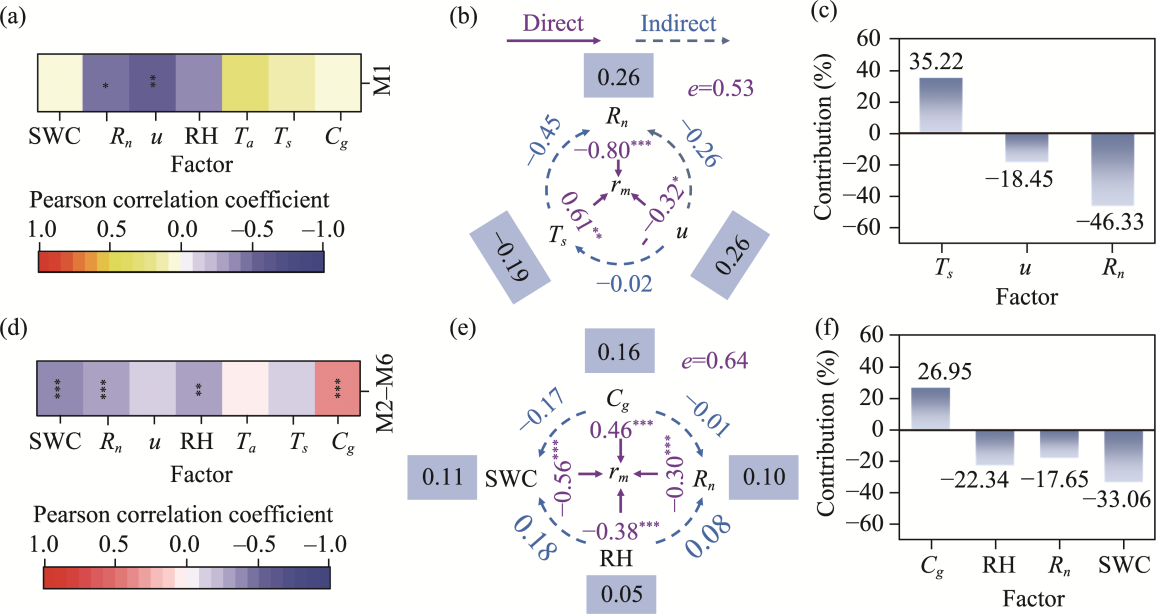
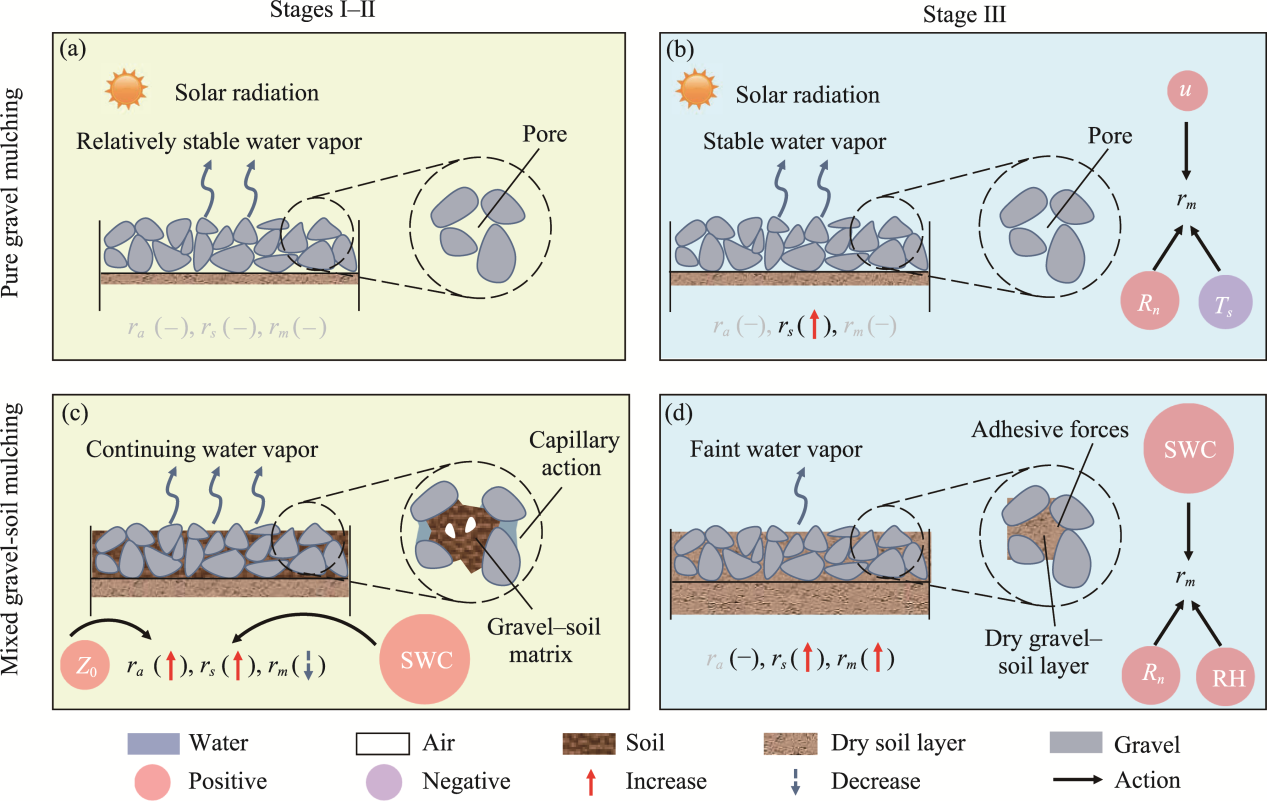
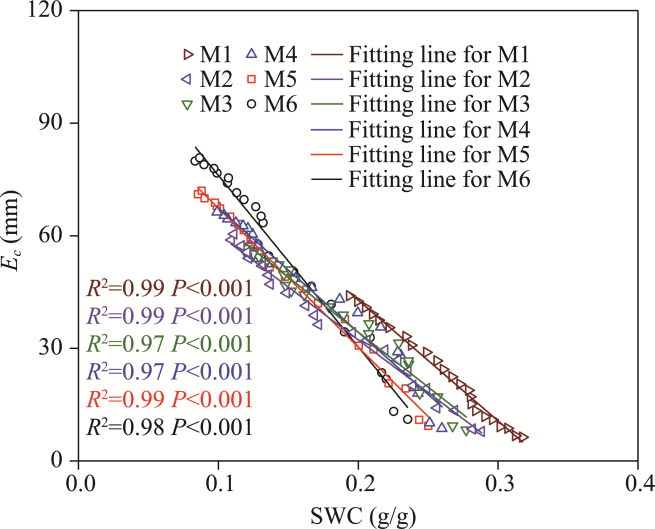
Abstract Gravel mulching plays a vital role in modifying the hydrological cycle in arid and semi-arid areas. Yet, the mechanisms underlying long-term mulching effects on soil evaporation remain poorly understood. To investigate the hydrological effects of mixed gravel-soil mulching (MGSM), we conducted a controlled 39-d soil evaporation experiment (from 22 July to 30 August 2021) using micro-lysimeters at the field experimental site of Ningxia University, China. The soil evaporation rate (E), cumulative soil evaporation (Ec), soil water content (SWC), mulch resistance (rm), and micro-meteorological variables were assessed for six mulch treatments, each containing a different proportion of gravel by volume: 100.00% (M1), 80.00% (M2), 60.00% (M3), 40.00% (M4), 20.00% (M5), and 0.00% (M6). The treatments (M2-M6) showed a prolonged soil moisture depletion phase and greater Ec (28.71%-83.31%) relative to the gravel-only treatment (M1) (P<0.050); these effects were primarily attributed to reduced rm. As compared to Ec, the SWC showed an inverse response, decreasing as Cg decreased. A robust exponential relationship was observed between E and rm (P<0.001). Evaporation suppression mediated by rm was particularly pronounced during the residual evaporation stage (>312 h post-wetting), with the strongest effect occurring in M3, where the mean rm doubled. The SWC, mulch properties, and micro-meteorological parameters (i.e., air relative humidity and surface net radiation flux) were the most important predictors of rm in the mulch treatments. Together, these results suggested that MGSM unexpectedly exacerbated surface soil moisture loss by reducing rm. To mitigate this effect, an optimized mixed gravel-soil mulch, containing 60.00% gravel by volume, might be used; this mixture balances evaporation control with hydrological sustainability and represents a practical strategy for dryland management, offering a compromise between short-term water retention and sustained soil moisture regulation.
|
|
Received: 17 June 2025
Published: 30 April 2026
|
|
Corresponding Authors:
*LI Wangcheng (E-mail: liwangcheng@126.com)
|
| Cite this article:
JIA Zhenjiang, LIU Xuezhi, JIA Zixuan, AN Wenju, ZHAO Guangxing, LIU Qiaoling, WU Yangyang, HUANG Yahao, MA Bo, LI Wangcheng. Mechanistic insights into mixed gravel-soil mulching effects on soil hydrology in arid ecosystems: A field micro-lysimeter study. Journal of Arid Land, 2026, 18(4): 715-734.
URL:
http://jal.xjegi.com/10.1016/j.jaridl.2026.04.009 OR http://jal.xjegi.com/Y2026/V18/I4/715
|
|
|
| [1] |
Allen R G, Pereira L S, Raes D, et al. 1998. Crop Evapotranspiration: Guidelines for Computing Crop Water Requirements. FAO Irrigation and drainage Paper 56. Rome: Food and Agriculture Organization of the United Nations (FAO), 36-51.
|
|
|
| [2] |
An N, Tang C S, Xu S K, et al. 2018. Effects of soil characteristics on moisture evaporation. Engineering Geology, 239: 126-135.
doi: 10.1016/j.enggeo.2018.03.028
|
|
|
| [3] |
Aydin M, Yang S L, Kurt N, et al. 2005. Test of a simple model for estimating evaporation from bare soils in different environments. Ecological Modelling, 182(1): 91-105.
doi: 10.1016/j.ecolmodel.2004.07.013
|
|
|
| [4] |
Bonachela S, López J C, Granados M R, et al. 2020. Effects of gravel mulch on surface energy balance and soil thermal regime in an unheated plastic greenhouse. Biosystems Engineering, 192: 1-13.
doi: 10.1016/j.biosystemseng.2020.01.010
|
|
|
| [5] |
Camillo P J, Gurney R J. 1986. A resistance parameter for bare soil evaporation models. Soil Science, 141(2): 95-105.
doi: 10.1097/00010694-198602000-00001
|
|
|
| [6] |
Carter M R, Gregorich E G. 2008. Soil Sampling and Methods of Analysis (2nd ed.). Boca Raton: CRC Press, 1224.
|
|
|
| [7] |
Deardorff J W. 1978. Efficient prediction of ground surface temperature and moisture, with inclusion of a layer of vegetation. Journal of Geophysical Research, 83(C4): 1889-1903.
doi: 10.1029/JC083iC04p01889
|
|
|
| [8] |
Diaz F, Jimenez C C, Tejedor M. 2005. Influence of the thickness and grain size of tephra mulch on soil water evaporation. Agricultural Water Management, 74(1): 47-55.
doi: 10.1016/j.agwat.2004.10.011
|
|
|
| [9] |
Fisher E A. 1923. Some factors affecting the evaporation of water from soil. The Journal of Agricultural Science, 13(2): 121-143.
doi: 10.1017/S0021859600003270
|
|
|
| [10] |
Fuchs M, Hadas A. 2011. Mulch resistance to water vapor transport. Agricultural Water Management, 98(6): 990-998.
doi: 10.1016/j.agwat.2011.01.008
|
|
|
| [11] |
Gardner W R. 1958. Some steady-state solutions of the unsaturated moisture flow equation with application to evaporation from a water table. Soil Science, 85(4): 228-232.
doi: 10.1097/00010694-195804000-00006
|
|
|
| [12] |
Halihan T, Miller R B, Correll D, et al. 2019. Field evidence of a natural capillary barrier in a gravel alluvial aquifer. Vadose Zone Journal, 18(1): 1-12.
|
|
|
| [13] |
Jia Z J, Liu X Z, Xu T Y, et al. 2023. Analysis of soil water evaporation characteristics and its influencing factors under mixed sand cover. Journal of Soil and Water Conservation, 37(2): 227-236. (in Chinese)
|
|
|
| [14] |
Jia Z J, Liu X Z, Li W C, et al. 2024a. Evolution and regulation of soil quality and land productivity in continuous cropping gravel-sand mulched field in arid region: progress and perspective. Acta Ecologica Sinica, 44(5): 2136-2148. (in Chinese)
|
|
|
| [15] |
Jia Z J, Wu Y Y, Li W C, et al. 2024b. Meta-analysis of effects of continuous cropping on topsoil nutrients in gravel-sand mulched field in arid regions of Northwest China. Acta Ecologica Sinica, 44(15): 6597-6608. (in Chinese)
|
|
|
| [16] |
Kang W R, Zhang Y Y, Zhao W Z, et al. 2025. The effect of gravel mulch on soil evaporation and resistance: Experimental findings and modeling. Journal of Soil Science and Plant Nutrition, 25: 1135-1148.
doi: 10.1007/s42729-024-02190-1
|
|
|
| [17] |
Kaseke K F, Mills A J, Henschel J, et al. 2012. The effects of desert pavements (gravel mulch) on soil micro-hydrology. Pure and Applied Geophysics, 169(5-6): 873-880.
doi: 10.1007/s00024-011-0367-2
|
|
|
| [18] |
Katra I, Lavee H, Sarah P. 2008. The effect of rock fragment size and position on topsoil moisture on arid and semi-arid hillslopes. CATENA, 72(1): 49-55.
doi: 10.1016/j.catena.2007.04.001
|
|
|
| [19] |
Konapala G, Mishra A K, Wada Y, et al. 2020. Climate change will affect global water availability through compounding changes in seasonal precipitation and evaporation. Nature Communications, 11(1): 3044, doi: 10.1038/s41467-020-16757-w.
pmid: 32576822
|
|
|
| [20] |
Kondo J, Saigusa N, Sato T. 1990. A parameterization of evaporation from bare soil surfaces. Journal of Applied Meteorology, 29(5): 385-389.
doi: 10.1175/1520-0450(1990)029<0385:APOEFB>2.0.CO;2
|
|
|
| [21] |
Lai X M, Liu Y, Li L Y, et al. 2022. Spatial variation of global surface soil rock fragment content and its roles on hydrological and ecological patterns. CATENA, 208: 105752, doi: 10.1016/j.catena.2021.105752.
|
|
|
| [22] |
Lehmann P, Assouline S, Or D. 2008. Characteristic lengths affecting evaporative drying of porous media. Physical Review E, 77(5): 056309, doi: 10.1103/PhysRevE.77.056309.
|
|
|
| [23] |
Lehmann P, Or D. 2009. Evaporation and capillary coupling across vertical textural contrasts in porous media. Physical Review E, 80(4): 046318, doi: 10.1103/PhysRevE.80.046318.
|
|
|
| [24] |
Li W X, Brunner P, Hendricks Franssen H J, et al. 2020. Potential evaporation dynamics over saturated bare soil and an open water surface. Journal of Hydrology, 590: 125140, doi: 10.1016/j.jhydrol.2020.125140.
|
|
|
| [25] |
Li X Y, Gong J D, Gao Q Z, et al. 2000. Rainfall interception loss by pebble mulch in the semiarid region of China. Journal of Hydrology, 228(3-4): 165-173.
doi: 10.1016/S0022-1694(00)00152-9
|
|
|
| [26] |
Li X Y. 2003. Gravel-sand mulch for soil and water conservation in the semiarid loess region of northwest China. CATENA, 52(2): 105-127.
doi: 10.1016/S0341-8162(02)00181-9
|
|
|
| [27] |
Li X Y, Shi P J, Liu L Y, et al. 2005. Influence of pebble size and cover on rainfall interception by gravel mulch. Journal of Hydrology, 312(1-4): 70-78.
doi: 10.1016/j.jhydrol.2005.02.010
|
|
|
| [28] |
Li Y, Liu H J, Huang G H. 2015. Modeling resistance of soil evaporation and soil evaporation under straw mulching. Transactions of the Chinese Society of Agricultural Engineering, 31(1): 98-106. (in Chinese)
|
|
|
| [29] |
Liu X P, Dong Z B. 2003. Aerodynamic roughness of gravel beds. Journal of Desert Research, 23(1): 38-48. (in Chinese)
|
|
|
| [30] |
Lu Y, Liu S H, Zhang Y G, et al. 2021. Hydraulic conductivity of gravelly soils with various coarse particle contents subjected to freeze-thaw cycles. Journal of Hydrology, 598: 126302, doi: 10.1016/j.jhydrol.2021.126302.
|
|
|
| [31] |
Lü H S, Yu Z B, Horton R, et al. 2013. Effect of gravel-sand mulch on soil water and temperature in the semiarid loess region of northwest China. Journal of Hydrologic Engineering, 18(11): 1484-1494.
doi: 10.1061/(ASCE)HE.1943-5584.0000449
|
|
|
| [32] |
Ma Y J, Li X Y. 2011. Water accumulation in soil by gravel and sand mulches: Influence of textural composition and thickness of mulch layers. Journal of Arid Environments, 75(5): 432-437.
doi: 10.1016/j.jaridenv.2010.12.017
|
|
|
| [33] |
Marvel K, Cook B I, Bonfils C J W, et al. 2019. Twentieth-century hydroclimate changes consistent with human influence. Nature, 569: 59-65.
doi: 10.1038/s41586-019-1149-8
|
|
|
| [34] |
Meier C I, Hauer F R. 2010. Strong effect of coarse surface layer on moisture within gravel bars: Results from an outdoor experiment. Water Resources Research, 46(5): 3311, doi: 10.1029/2008WR007250.
|
|
|
| [35] |
Miller F T, Guthrie R L. 1984. Classification and distribution of soils containing rock fragments in the United States. In: Nichols J D, Brown P L, Grant W J. Erosion and Productivity of Soils Containing Rock Fragments. Madison: Soil Science Society of America, 1-6.
|
|
|
| [36] |
Novak M D. 2010. Dynamics of the near-surface evaporation zone and corresponding effects on the surface energy balance of a drying bare soil. Agricultural and Forest Meteorology, 150(10): 1358-1365.
doi: 10.1016/j.agrformet.2010.06.005
|
|
|
| [37] |
Or D, Lehmann P, Shahraeeni E, et al. 2013. Advances in soil evaporation physics-A review. Vadose Zone Journal, 12(4): 1-16.
|
|
|
| [38] |
Pérez F L. 2000. The influence of surface volcaniclastic layers from Haleakala (Maui, Hawaii) on soil water conservation. CATENA, 38(4): 301-332.
doi: 10.1016/S0341-8162(99)00076-4
|
|
|
| [39] |
Poesen J, Lavee H. 1994. Rock fragments in top soils: Significance and processes. CATENA, 23(1-2): 1-28.
doi: 10.1016/0341-8162(94)90050-7
|
|
|
| [40] |
Qiu Y, Xie Z K, Wang Y J, et al. 2014. Influence of gravel mulch stratum thickness and gravel grain size on evaporation resistance. Journal of Hydrology, 519: 1908-1913.
doi: 10.1016/j.jhydrol.2014.09.085
|
|
|
| [41] |
Qiu Y, Xie Z K, Wang Y J, et al. 2015. Long-term effects of gravel-sand mulch on soil organic carbon and nitrogen in the Loess Plateau of northwestern China. Journal of Arid Land, 7(1): 46-53.
doi: 10.1007/s40333-014-0076-7
|
|
|
| [42] |
Ritchie J T. 1973. Influence of soil water status and meteorological conditions on evaporation from a corn canopy. Agronomy Journal, 65(6): 893-897.
doi: 10.2134/agronj1973.00021962006500060014x
|
|
|
| [43] |
Song R Q, Chu G X, Ye J, et al. 2010. Effects of surface soil mixed with sand on water infiltration and evaporation in laboratory. Transactions of the Chinese Society of Agricultural Engineering, 26(13): 109-114. (in Chinese)
|
|
|
| [44] |
Sun C T, Deng Y P, Zhang J P, et al. 2020. Model on coastal soil evaporation resistance under straw coverage. Transactions of the Chinese Society for Agricultural Machinery, 51(12): 284-291. (in Chinese)
|
|
|
| [45] |
Sun S F. 1982. Moisture and heat transport in a soil layer forced by atmosphere conditions. MSc Thesis. Storrs: University of Connecticut.
|
|
|
| [46] |
Tugwell-Wootton T, Skrzypek G, Dogramaci S, et al. 2020. Soil moisture evaporative losses in response to wet-dry cycles in a semiarid climate. Journal of Hydrology, 590: 125533, doi: 10.1016/j.jh-ydrol.2020.125533.
|
|
|
| [47] |
Van Bavel C H M, Hillel D I. 1976. Calculating potential and actual evaporation from a bare soil surface by simulation of concurrent flow of water and heat. Agricultural Meteorology, 17(6): 453-476.
doi: 10.1016/0002-1571(76)90022-4
|
|
|
| [48] |
Van Loon A F, Rangecroft S, Coxon G, et al. 2019. Using paired catchments to quantify the human influence on hydrological droughts. Hydrology and Earth System Sciences, 23(3): 1725-1739.
doi: 10.5194/hess-23-1725-2019
|
|
|
| [49] |
Wang D L, Feng H, Li Y, et al. 2019. Energy input-output, water use efficiency and economics of winter wheat under gravel mulching in Northwest China. Agricultural Water Management, 222: 354-366.
doi: 10.1016/j.agwat.2019.06.009
|
|
|
| [50] |
Wang X X. 2015. Vapor flow resistance of dry soil layer to soil water evaporation in arid environment: An overview. Water, 7(8): 4552-4574.
doi: 10.3390/w7084552
|
|
|
| [51] |
Wang Y W, Zhu Q, Lai X M, et al. 2023. Response of soil hydrological processes to soil rock fragments: A global Meta-analysis. Science China Earth Sciences, 66(9): 2066-2080.
doi: 10.1007/s11430-023-1132-4
|
|
|
| [52] |
Weng D M, Chen W L, Shen J C, et al. 1981. Microclimate and Farmland Microclimate. Beijing: China Agriculture Press, 32-33. (in Chinese)
|
|
|
| [53] |
Wu Y Y, Jia Z J, Li W C, et al. 2024. Gravel mulching significantly improves crop yield and water productivity in arid and semi-arid regions of northwest China: Evidence from a meta-analysis. Agronomy, 14(8): 1717, doi: 10.3390/agronomy14081717.
|
|
|
| [54] |
Xie Z K, Wang Y J, Jiang W L, et al. 2006. Evaporation and evapotranspiration in a watermelon field mulched with gravel of different sizes in northwest China. Agricultural Water Management, 81(1-2): 173-184.
doi: 10.1016/j.agwat.2005.04.004
|
|
|
| [55] |
Xie Z K, Wang Y J, Cheng G D, et al. 2010. Particle-size effects on soil temperature, evaporation, water use efficiency and watermelon yield in fields mulched with gravel and sand in semi-arid Loess Plateau of northwest China. Agricultural Water Management, 97(6): 917-923.
doi: 10.1016/j.agwat.2010.01.023
|
|
|
| [56] |
Yamanaka T, Inoue M, Kaihotsu I. 2004. Effects of gravel mulch on water vapor transfer above and below the soil surface. Agricultural Water Management, 67(2): 145-155.
doi: 10.1016/j.agwat.2004.01.002
|
|
|
| [57] |
Yang Y, Zhang M J, Zhang Y, et al. 2022. Evaluating the soil evaporation loss rate in a gravel-sand mulching environment based on stable isotopes data. Journal of Arid Land, 14(8): 925-939.
doi: 10.1007/s40333-022-0101-1
|
|
|
| [58] |
Yuan C P, Lei T W, Mao L L, et al. 2009. Soil surface evaporation processes under mulches of different sized gravel. CATENA, 78(2): 117-121.
doi: 10.1016/j.catena.2009.03.002
|
|
|
| [59] |
Zhang L Y, Wang Z, He Z L, et al. 2024. Effects of gravel-sand and plastic film mulching on soil water and temperature retention in cold and arid regions without irrigation. Science of The Total Environment, 934: 173350, doi: 10.1016/j.scitotenv.2024.173350.
|
|
|
| [60] |
Zhang Y H, Zhang M X, Niu J Z, et al. 2016. Rock fragments and soil hydrological processes: Significance and progress. CATENA, 147: 153-166.
doi: 10.1016/j.catena.2016.07.012
|
|
|
| [61] |
Zhao W J, Cui Z, Zhou C Q. 2020. Spatiotemporal variability of soil-water content at different depths in fields mulched with gravel for different planting years. Journal of Hydrology, 590: 125253, doi: 10.1016/j.jhydrol.2020.125253.
|
|
|
| [62] |
Zhu G F, Yong L L, Zhang Z X, et al. 2021. Effects of plastic mulch on soil water migration in arid oasis farmland: Evidence of stable isotopes. CATENA, 207: 105580, doi: 10.1016/j.catena.2021.105580.
|
|
|
| [63] |
Zou X Y, Li J F, Cheng H, et al. 2018. Spatial variation of topsoil features in soil wind erosion areas of northern China. CATENA, 167: 429-439.
doi: 10.1016/j.catena.2018.05.022
|
|
|
|
Viewed |
|
|
|
Full text
|
|
|
|
|
Abstract
|
|
|
|
|
Cited |
|
|
|
|
| |
Shared |
|
|
|
|
| |
Discussed |
|
|
|
|