Windbreak and sand-fixing effects of typical nebkhas in the Yabrai Mountain aeolian corridor
LI Xiaoyang1,2, MENG Zhongju1,2,*()
1College of Desert Control Science and Engineering, Inner Mongolia Agricultural University, Hohhot 010018, China 2State Key Laboratory of Water Engineering Ecology and Environment in Arid Area, Inner Mongolia Agricultural University, Hohhot 010018, China
Nebkhas are important aeolian landforms in arid regions and have notable windbreak and sand-fixing functions. However, the effects of shrub type and developmental stage on nebkha performance in high-wind energy regions remain insufficiently understood. This study quantified the windbreak and sand-fixing effects of three typical nebkha types (i.e., nebkhas formed by Reaumuria soongorica, Caragana tibetica, and Nitraria tangutorum) at different developmental stages (i.e., initial, developing, stable, and activated stages) in the Yabrai Mountain aeolian corridor, a high-wind energy region in China. Field sampling was carried out in three subregions along the prevailing wind direction (upwind, central sand-transport, and downwind) in March and November 2025. Particle-size analysis was conducted to characterize the differentiation of surface aeolian sediments, and field measurements combined with numerical simulations were used to analyze wind-speed profiles, windbreak efficiency, and airflow structure. The results showed that surface sediments on the windward slope and mound crest were dominated by clay and silt, whereas higher sand fractions occurred on the leeward and lateral slopes. The mean particle size followed the order: N. tangutorum (2.27 Φ)<C. tibetica (2.30 Φ)<R. soongorica (2.37 Φ). Windbreak and sand-fixing effects ranked as stable stage>activated stage>developing stage>initial stage, with N. tangutorum nebkhas showing the strongest performance. When airflow passed over the nebkhas, wind speed increased above the canopy and along the lateral slopes; at the same time, a pronounced leeward deceleration zone formed within normalized horizontal distance (x/L) of 0-6 and relative height (z/H) of 0.0-0.5, where x is the horizontal distance, z is the vertical height, and L and H denote the shrub canopy major axis and shrub canopy height, respectively. Wind speed increased with z/H and x/L in the leeward direction and approached the reference wind speed over bare ground at z/H>1.2. Similar airflow patterns were observed among nebkha types. Prioritising N. tangutorum, combined with C. tibetica, and maintaining suitable developmental stages can enhance windbreak and sand-fixing performance in high-wind energy regions. These findings provide a scientific reference for constructing stable and efficient ecological protection systems in extreme wind environments, and support sand-control planning and vegetation configuration in arid and semi-arid areas.
Received: 01 December 2025
Published: 31 July 2026
Conceptualization: LI Xiaoyang, MENG Zhongju; Data curation: LI Xiaoyang; Formal analysis: LI Xiaoyang; Funding acquisition: MENG Zhongju; Investigation: LI Xiaoyang; Methodology: LI Xiaoyang, MENG Zhongju; Project administration: MENG Zhongju; Resources: MENG Zhongju; Software: LI Xiaoyang; Supervision: MENG Zhongju; Validation: LI Xiaoyang, MENG Zhongju; Visualization: LI Xiaoyang; Writing - original draft preparation: LI Xiaoyang; Writing - review and editing: MENG Zhongju. All authors approved the manuscript.
LI Xiaoyang, MENG Zhongju. Windbreak and sand-fixing effects of typical nebkhas in the Yabrai Mountain aeolian corridor. Journal of Arid Land, 2026, 18(7): 1159-1178.
Fig. 1Overview of the study area based on the satellite imagery. The satellite imagery is derived from the Google Earth (https://earth.google.com/).
Stage
Reaumuria soongorica
Caragana tibetica
Nitraria tangutorum
H (cm)
Hs (cm)
S (×103 cm2)
V (×103 cm3)
H (cm)
Hs (cm)
S (×103 cm2)
V (×103 cm3)
H (cm)
Hs (cm)
S (×103 cm2)
V (×103 cm2)
Initial
<9
<6
<0.5
<5.5
<15
<10
<1.5
<15.0
<20
<15
<1.5
<20.0
Developing
9-16
6-11
0.5-1.0
5.5-8.0
15-25
10-20
1.5-3.5
15.0-50.0
20-30
15-25
1.5-4.0
20.0-60.0
Stable
16-25
11-15
1.0-1.5
8.0-20.0
25-40
20-30
3.5-5.0
50.0-100.0
30-45
25-30
4.0-4.5
60.0-120.0
Activated
≥25
≥15
≥1.5
≥20.0
≥40
≥30
≥5.0
≥100.0
≥45
≥30
≥4.5
≥120.0
Table 1 Criteria for classifying developmental stages of typical nebkhas
Fig. 2Layout of wind speed observation around each nebkha. (a), main view; (b), vertical wind speed measurement; (c), top view; (d), horizontal wind speed measurement. The geometric centre of the shrub was taken as the coordinate origin; x is the horizontal distance along the prevailing wind direction; y is the horizontal distance perpendicular to the prevailing wind direction; z is the vertical height; L is the shrub canopy major axis; W is the shrub canopy minor axis; and H is the shrub canopy height.
Stage
Morphological characteristic
R. soongorica
C. tibetica
N. tangutorum
Initial stage
L (cm)
28.1±7.1
67.9±19.7
74.4±16.3
W (cm)
26.6±6.7
62.1±16.5
66.0±14.8
H (cm)
5.7±1.0
13.2±1.0
13.5±2.2
Ls (cm)
20.6±4.7
52.4±16.3
58.2±10.5
Ws (cm)
19.0±3.8
47.8±14.3
53.1±9.5
Hs (cm)
3.9±0.7
8.2±2.1
8.6±1.5
Lc (cm)
24.3±4.9
60.0±17.7
67.8±12.2
S (×103 cm2)
0.2±0.1
0.9±1.1
1.0±0.4
V (×103 cm3)
1.9±0.7
8.5±4.9
9.9±4.0
Sz (×103 cm2)
0.4±0.2
1.5±0.8
1.7±0.8
Developing stage
L (cm)
47.7±8.6
108.5±23.5
123.5±22.2
W (cm)
35.1±7.5
78.6±19.3
87.7±15.8
H (cm)
10.0±1.8
22.0±1.5
24.3±4.4
Ls (cm)
33.9±7.5
75.7±15.3
87.5±15.8
Ws (cm)
23.6±5.0
54.3±12.9
62.0±11.2
Hs (cm)
7.2±1.3
16.0±1.9
17.2±3.1
Lc (cm)
37.5±8.2
87.2±20.7
96.8±17.4
S (×103 cm2)
0.9±0.3
3.0±1.8
3.3±1.2
V (×103 cm3)
6.7±2.7
29.2±13.7
34.1±13.6
Sz (×103 cm2)
0.9±0.4
2.9±0.8
3.4±0.6
Stable stage
L (cm)
61.7±11.1
157.2±23.2
184.0±33.1
W (cm)
44.1±9.4
99.0±19.9
112.1±20.2
H (cm)
21.2±3.1
36.0±1.5
40.5±7.3
Ls (cm)
51.1±9.2
119.2±15.4
136.1±24.5
Ws (cm)
36.6±7.7
84.0±12.9
95.7±17.2
Hs (cm)
14.0±2.5
25.8±1.9
27.1±4.9
Lc (cm)
39.0±8.6
88.1±21.0
93.0±16.7
S (×103 cm2)
1.2±0.4
4.0±1.9
4.6±1.6
V (×103 cm3)
18.2±8.5
79.8±14.3
102.5±35.2
Sz (×103 cm2)
1.4±0.9
3.9±0.8
4.7±2.4
Activated stage
L (cm)
77.7±14.0
173.6±26.4
195.6±35.2
W (cm)
52.0±11.1
112.7±21.9
131.7±23.7
H (cm)
36.0±8.0
44.3±5.8
47.0±8.5
Ls (cm)
63.0±13.5
145.9±24.8
156.6±28.2
Ws (cm)
45.3±9.8
102.6±18.7
111.2±20.0
Hs (cm)
17.3±3.7
36.8±5.6
38.6±7.0
Lc (cm)
45.0±9.7
98.7±22.1
108.8±19.6
S (×103 cm2)
1.9±0.6
6.4±1.8
7.6±2.8
V (×103 cm3)
24.1±9.6
104.9±41.5
130.6±52.3
Sz (×103 cm2)
1.4±0.7
4.9±1.0
5.8±1.7
Table 2 Morphological parameters of typical nebkhas
Sample type
SP
Clay (%)
Silt (%)
Very fine sand (%)
Fine sand (%)
Medium sand (%)
Coarse sand (%)
R. soongorica (0-10 cm)
WS
0.02±0.00DEa
0.73±0.03Da
2.20±0.03Fb
53.28±0.19Eb
43.17±0.23Bc
0.61±0.01Bb
LS
0.01±0.00Eb
0.28±0.02Db
1.85±0.02Gc
52.89±0.16Gb
44.35±0.17Bb
0.62±0.02Bb
MC
0.01±0.00Cb
0.28±0.01Eb
2.30±0.02Ha
54.89±0.21Fa
42.00±0.23Ad
0.52±0.02Ac
LS
0.01±0.00Db
0.23±0.01Cb
1.48±0.01Ed
49.83±0.05Fc
47.53±0.06Aa
0.93±0.01Aa
R. soongorica (10-20 cm)
WS
0.02±0.00Ea
0.71±0.06Da
4.56±0.10Ca
61.74±0.36Da
32.81±0.46Cc
0.16±0.01Cbc
LS
0.01±0.00DEa
0.37±0.02Db
2.14±0.03Fc
53.67±0.23Fc
43.22±0.26Ca
0.59±0.02Ba
MC
0.02±0.00Ca
0.48±0.03Cb
4.62±0.10Ea
62.49±0.37Da
32.27±0.48Cc
0.15±0.01Cc
LS
0.01±0.00BCDa
0.38±0.03Cb
3.29±0.03CDb
60.30±0.17Db
35.83±0.21Cb
0.19±0.01Cb
R. soongorica (20-30 cm)
WS
0.01±0.00Ea
0.30±0.01Dbc
1.81±0.03Gc
51.02±0.25Fc
46.01±0.26Aa
0.84±0.03Aa
LS
0.01±0.00Da
0.25±0.01Dc
1.66±0.03Gd
50.72±0.30Hc
46.54±0.32Aa
0.83±0.03Aa
MC
0.01±0.00Ca
0.37±0.03Da
2.58±0.07Gb
55.65±0.37Fb
40.91±0.41Ab
0.47±0.03Ab
LS
0.01±0.00CDa
0.33±0.02Cab
3.04±0.02Da
58.34±0.14Ea
37.99±0.16Bc
0.29±0.01Bc
C. tibetica (0-10 cm)
WS
0.10±0.01Ba
2.28±0.15Ba
6.62±0.10Aa
67.92±0.14Ab
23.05±0.35Hc
0.02±0.00Fb
LS
0.05±0.01BCc
0.59±0.03Cc
4.66±0.05Dd
65.87±0.22Cc
28.77±0.27Ea
0.06±0.01DEa
MC
0.05±0.01ABb
0.68±0.03ABb
5.92±0.09Cb
68.58±0.22Ba
24.79±0.34EFb
0.02±0.00Eb
LS
0.09±0.02Ab
0.93±0.07Ab
5.64±0.02Ac
68.98±0.03Aa
24.37±0.13Fb
0.02±0.00Fb
C. tibetica (10-20 cm)
WS
0.03±0.00DEb
0.78±0.01Da
4.20±0.05Dd
63.76±0.28Cd
31.14±0.32Ea
0.09±0.00Da
LS
0.04±0.01BCa
0.58±0.03Cb
6.45±0.06Ab
68.60±0.17Ab
24.34±0.24Hc
0.02±0.00Ed
MC
0.03±0.01BCa
0.45±0.01CDc
7.48±0.04Aa
71.40±0.09Aa
20.62±0.14Gd
0.04±0.00DEc
LS
0.05±0.01Ba
0.64±0.04Bb
4.61±0.04Bc
66.15±0.12Bc
28.52±0.20Eb
0.06±0.00Eb
C. tibetica (20-30 cm)
WS
0.08±0.01BCa
1.54±0.11Ca
4.64±0.01Cc
65.09±0.03Bb
28.61±0.11Eb
0.06±0.00DEb
LS
0.04±0.01BCb
0.69±0.07BCc
4.67±0.07Dc
65.10±0.33Db
29.42±0.41Ea
0.07±0.00Da
MC
0.04±0.01Bb
0.60±0.03Bc
6.61±0.07Ba
68.89±0.21Ba
23.85±0.28Fc
0.02±0.00Ec
LS
0.09±0.02Aa
0.98±0.09Ab
5.86±0.02Ab
69.00±0.04Aa
24.08±0.16Fc
0.02±0.00Fc
N. tangutorum (0-10 cm)
WS
0.09±0.01Ba
1.73±0.07Ca
4.62±0.05Cb
64.61±0.13Bb
28.94±0.26Ec
0.06±0.01DEc
LS
0.03±0.01CDb
0.63±0.06Cb
4.92±0.02Ca
66.63±0.11Ba
27.78±0.14Fd
0.04±0.00DEd
MC
0.05±0.01ABb
0.74±0.04Ab
3.48±0.03Fc
62.88±0.20Dc
32.78±0.26Cb
0.10±0.01CDb
LS
0.04±0.01BCb
0.64±0.07Bb
3.32±0.04CDd
61.96±0.24Cd
33.10±0.31Da
0.12±0.01Da
N. tangutorum (10-20 cm)
WS
0.19±0.02Aa
2.94±0.09Aa
5.33±0.04Bb
64.88±0.10Bc
26.54±0.15Fb
0.04±0.00EFb
LS
0.07±0.01Ab
1.02±0.09Ab
5.50±0.02Ba
67.91±0.03Aa
25.51±0.16Gc
0.03±0.00Ec
MC
0.06±0.01Ab
0.77±0.03Ac
5.55±0.05Da
68.14±0.16Ba
25.47±0.21Ec
0.03±0.00Ec
LS
0.04±0.01Bb
0.76±0.04Bc
4.74±0.05Bc
66.19±0.17Bb
28.21±0.26Ea
0.05±0.00Ea
N. tangutorum (20-30 cm)
WS
0.05±0.01CDa
0.88±0.06Da
6.60±0.04Aa
68.46±0.11Ab
24.01±0.19Gb
0.02±0.00Fc
LS
0.05±0.01BCa
0.72±0.07BCab
4.89±0.07Cc
65.61±0.22CDd
28.66±0.36EFa
0.07±0.01Da
MC
0.04±0.01ABa
0.74±0.03Aab
4.83±0.04Ec
66.44±0.13Cc
27.94±0.20Da
0.05±0.00DEb
LS
0.04±0.01BCa
0.66±0.03Bb
5.82±0.04Ab
69.06±0.09Aa
24.43±0.17Fb
0.02±0.00Fc
CK
WS
0.04±0.00DEb
0.77±0.04Dab
3.10±0.25Ea
61.14±0.58Da
34.95±0.61Ca
0.18±0.01Ca
LS
0.05±0.00ABab
0.84±0.91Ba
3.09±0.44Ea
60.48±0.62Ea
35.52±0.92Da
0.18±0.01Ca
MC
0.59±0.00Aa
0.75±0.91Aab
2.43±0.48GHa
57..8±3.34Ea
38.67±0.39Ba
0.30±0.10Ba
LS
0.04±0.01BCb
0.63±0.60Bb
3.36±0.86Ca
61.92±3.25Ca
33.88±2.36Da
0.15±0.04Da
Table 3 Particle-size composition of surface sediments from typical nebkhas
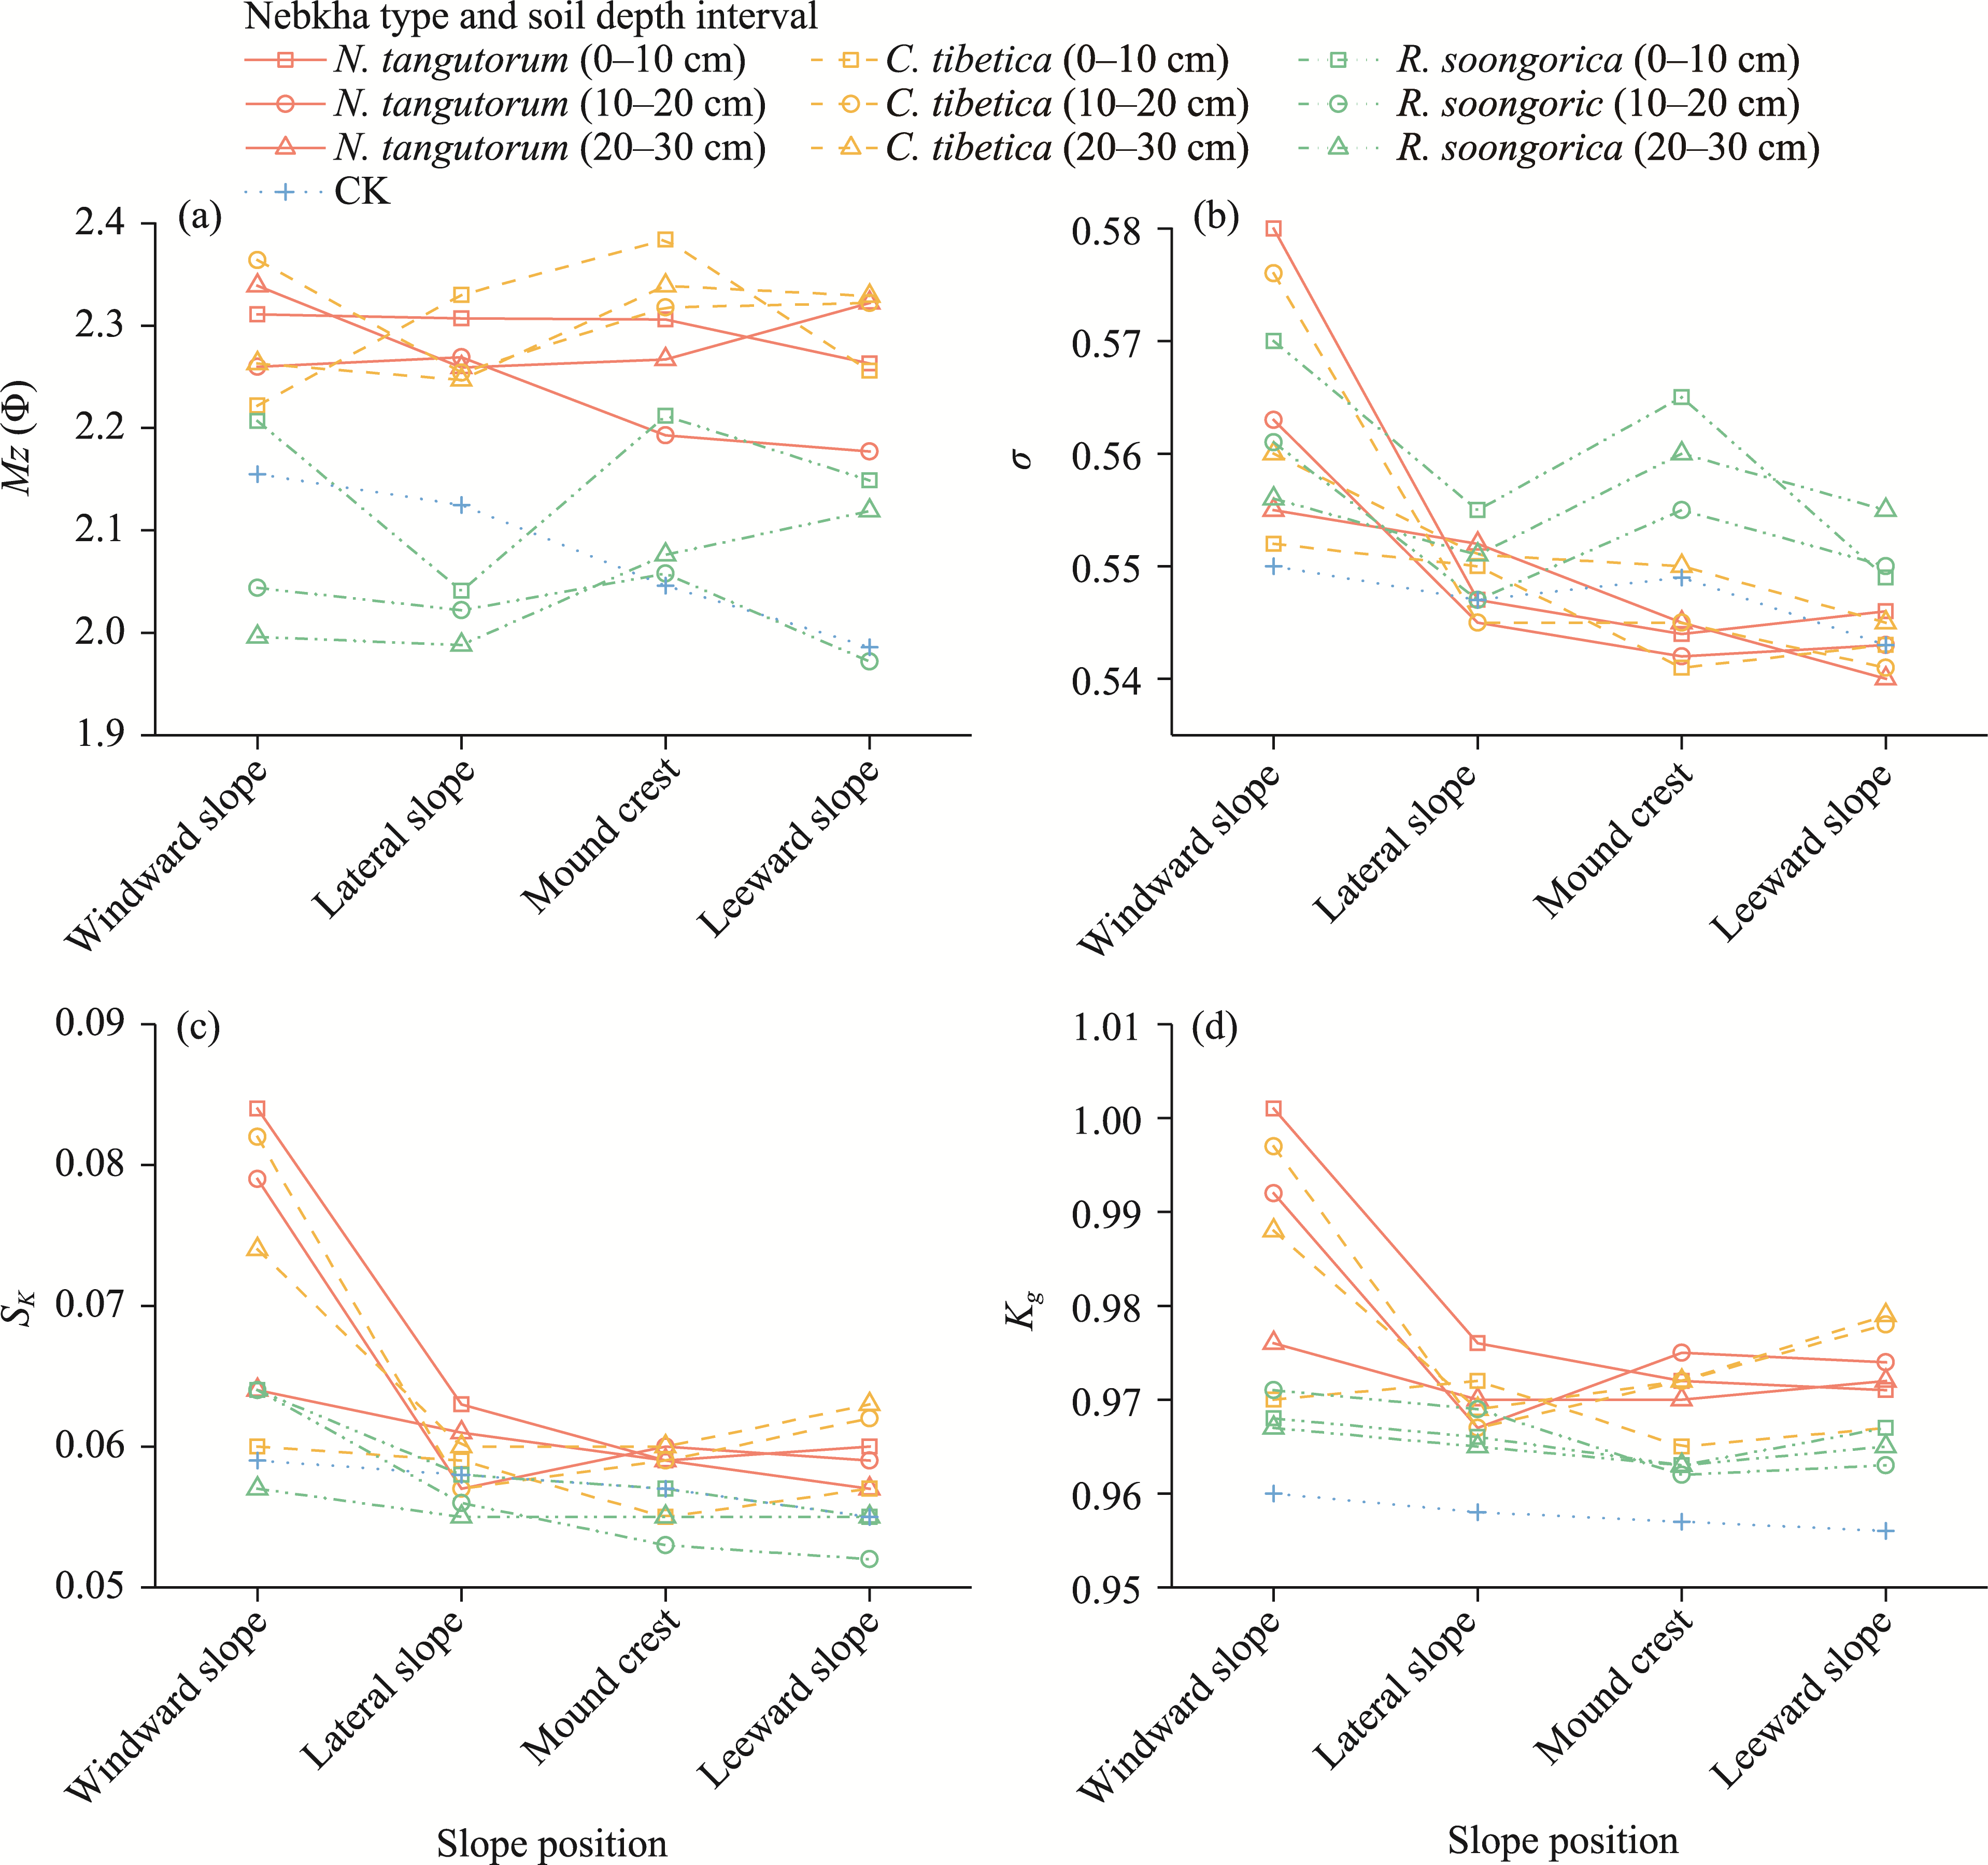
Fig. 3Variations in soil particle-size parameters of typical nebkhas at different soil depth intervals and slope positions. (a), mean particle size (Mz); (b), sorting coefficient (σ); (c), skewness (Sk); (d), kurtosis (Kg). CK means bare sand (control).
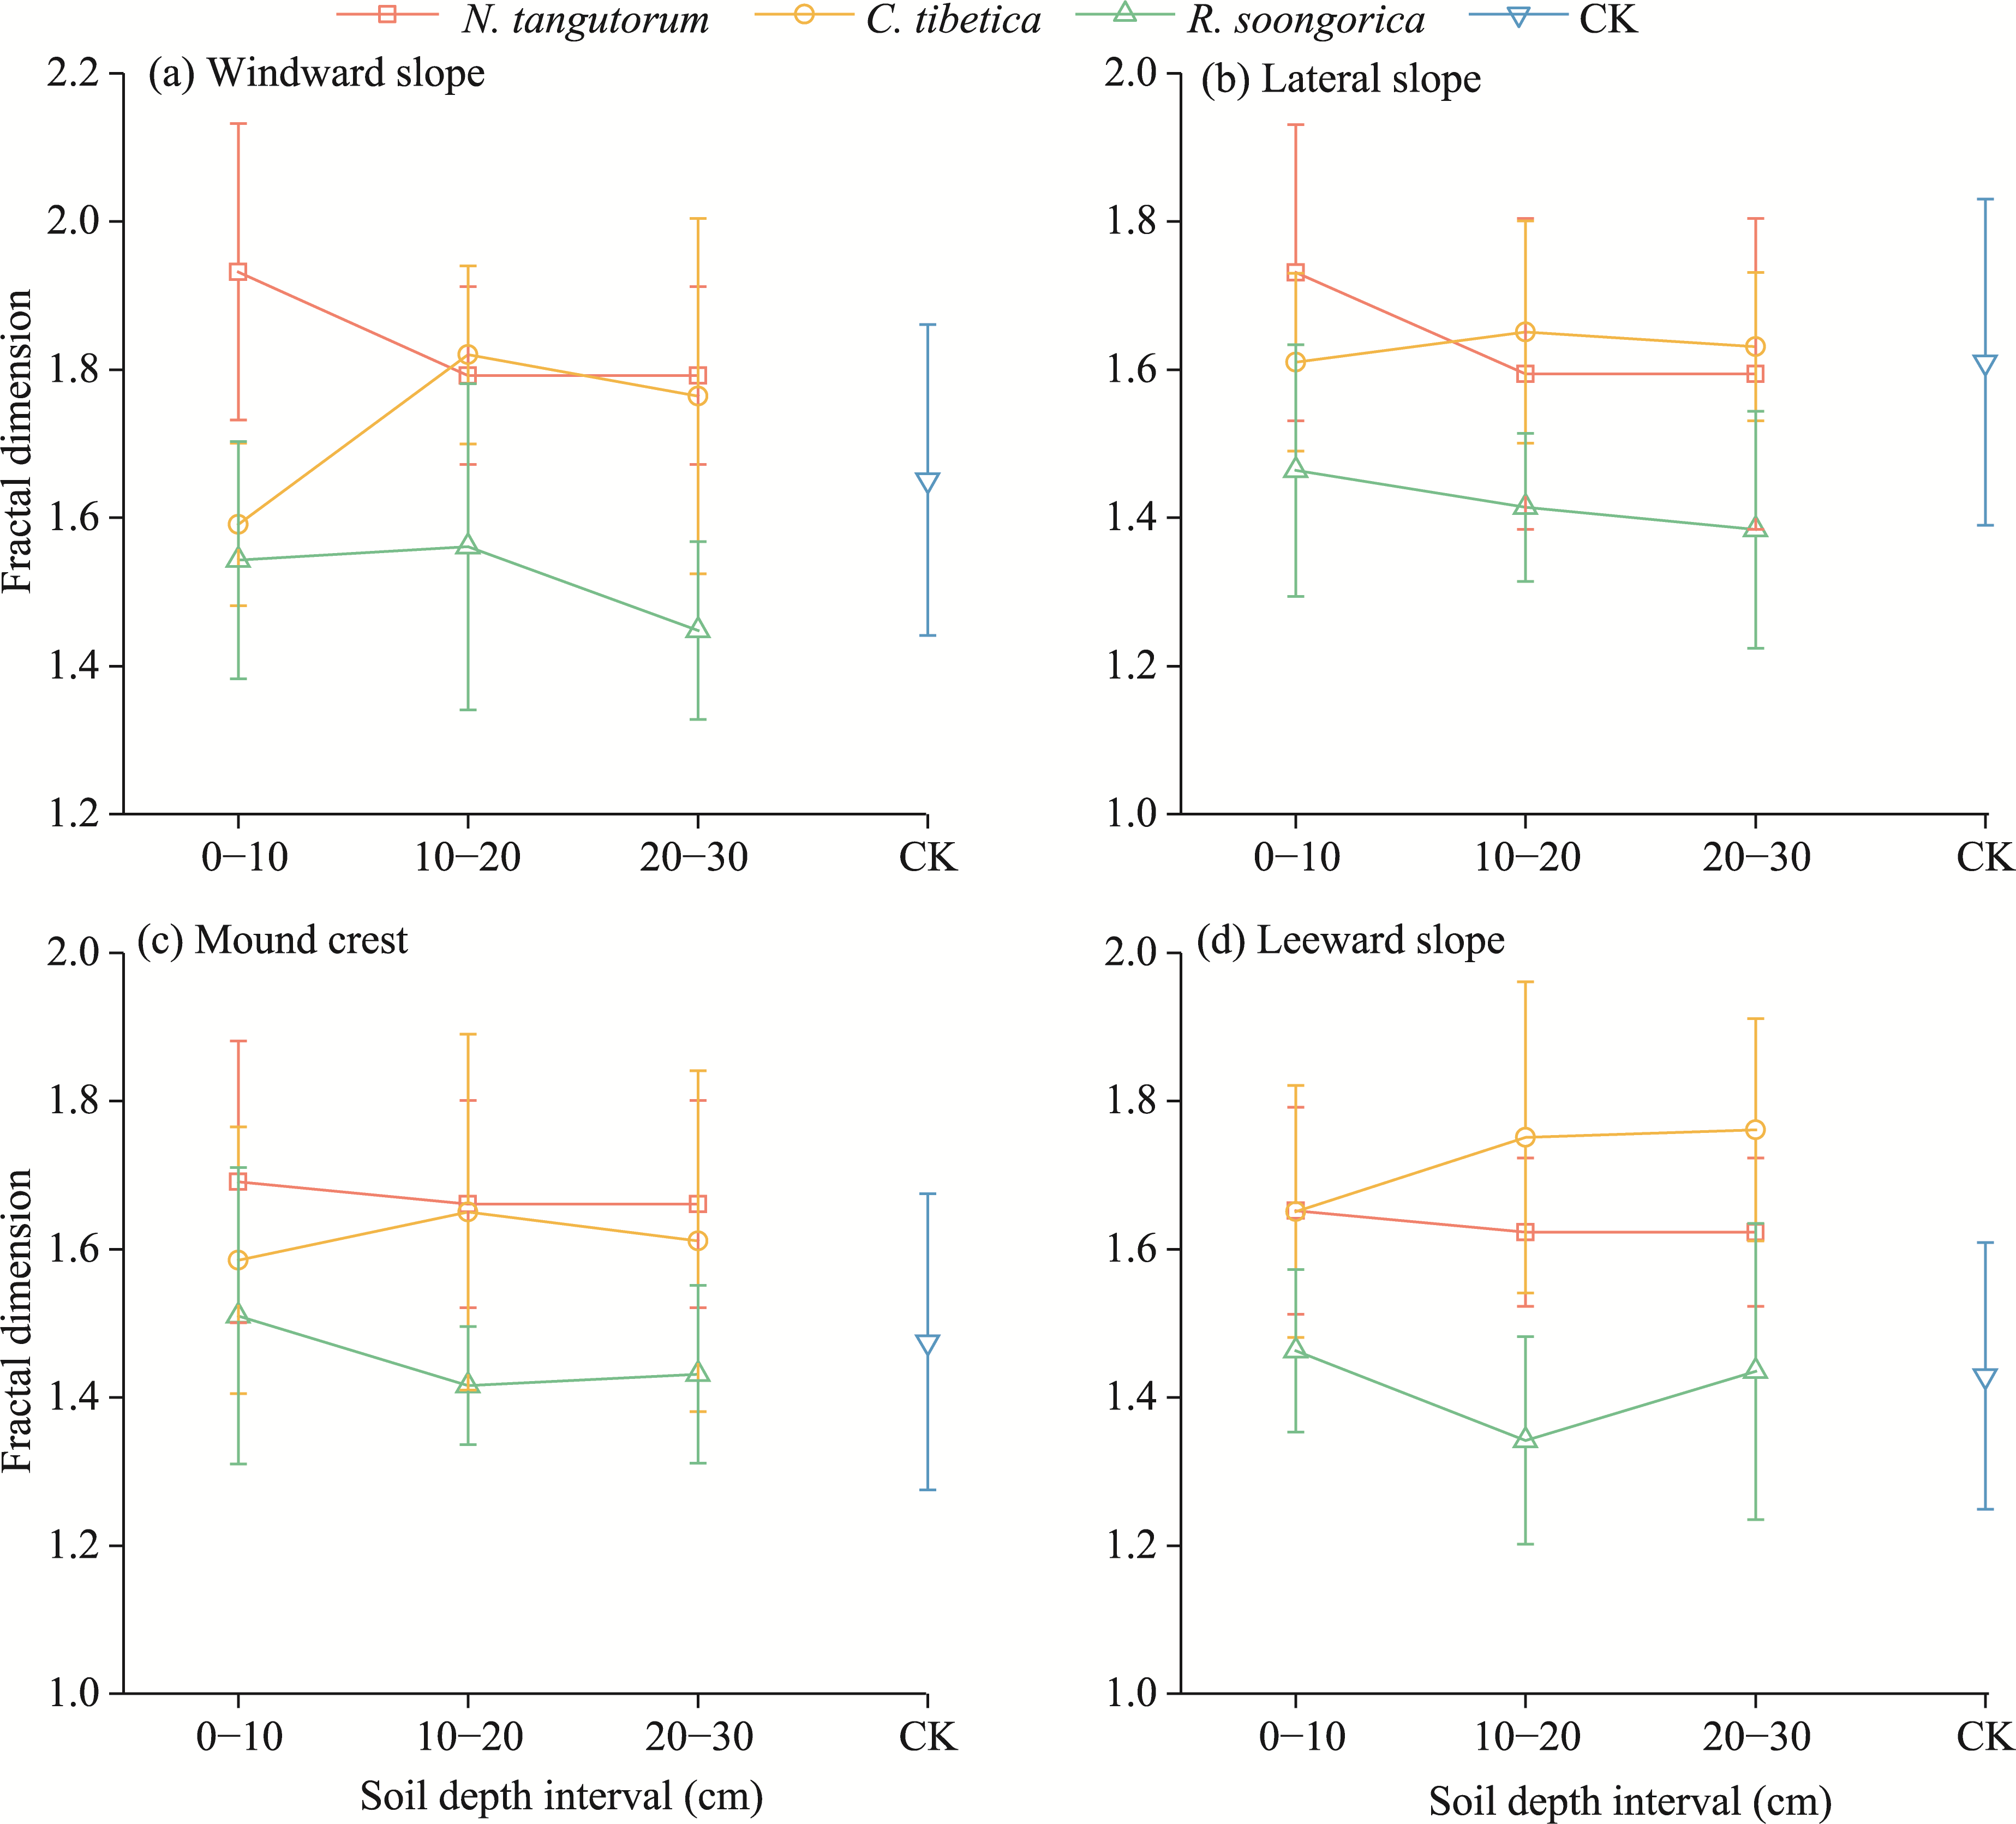
Fig. 4Variations in soil fractal dimension of typical nebkhas at different soil depth intervals. Bars mean standard deviation (SD).
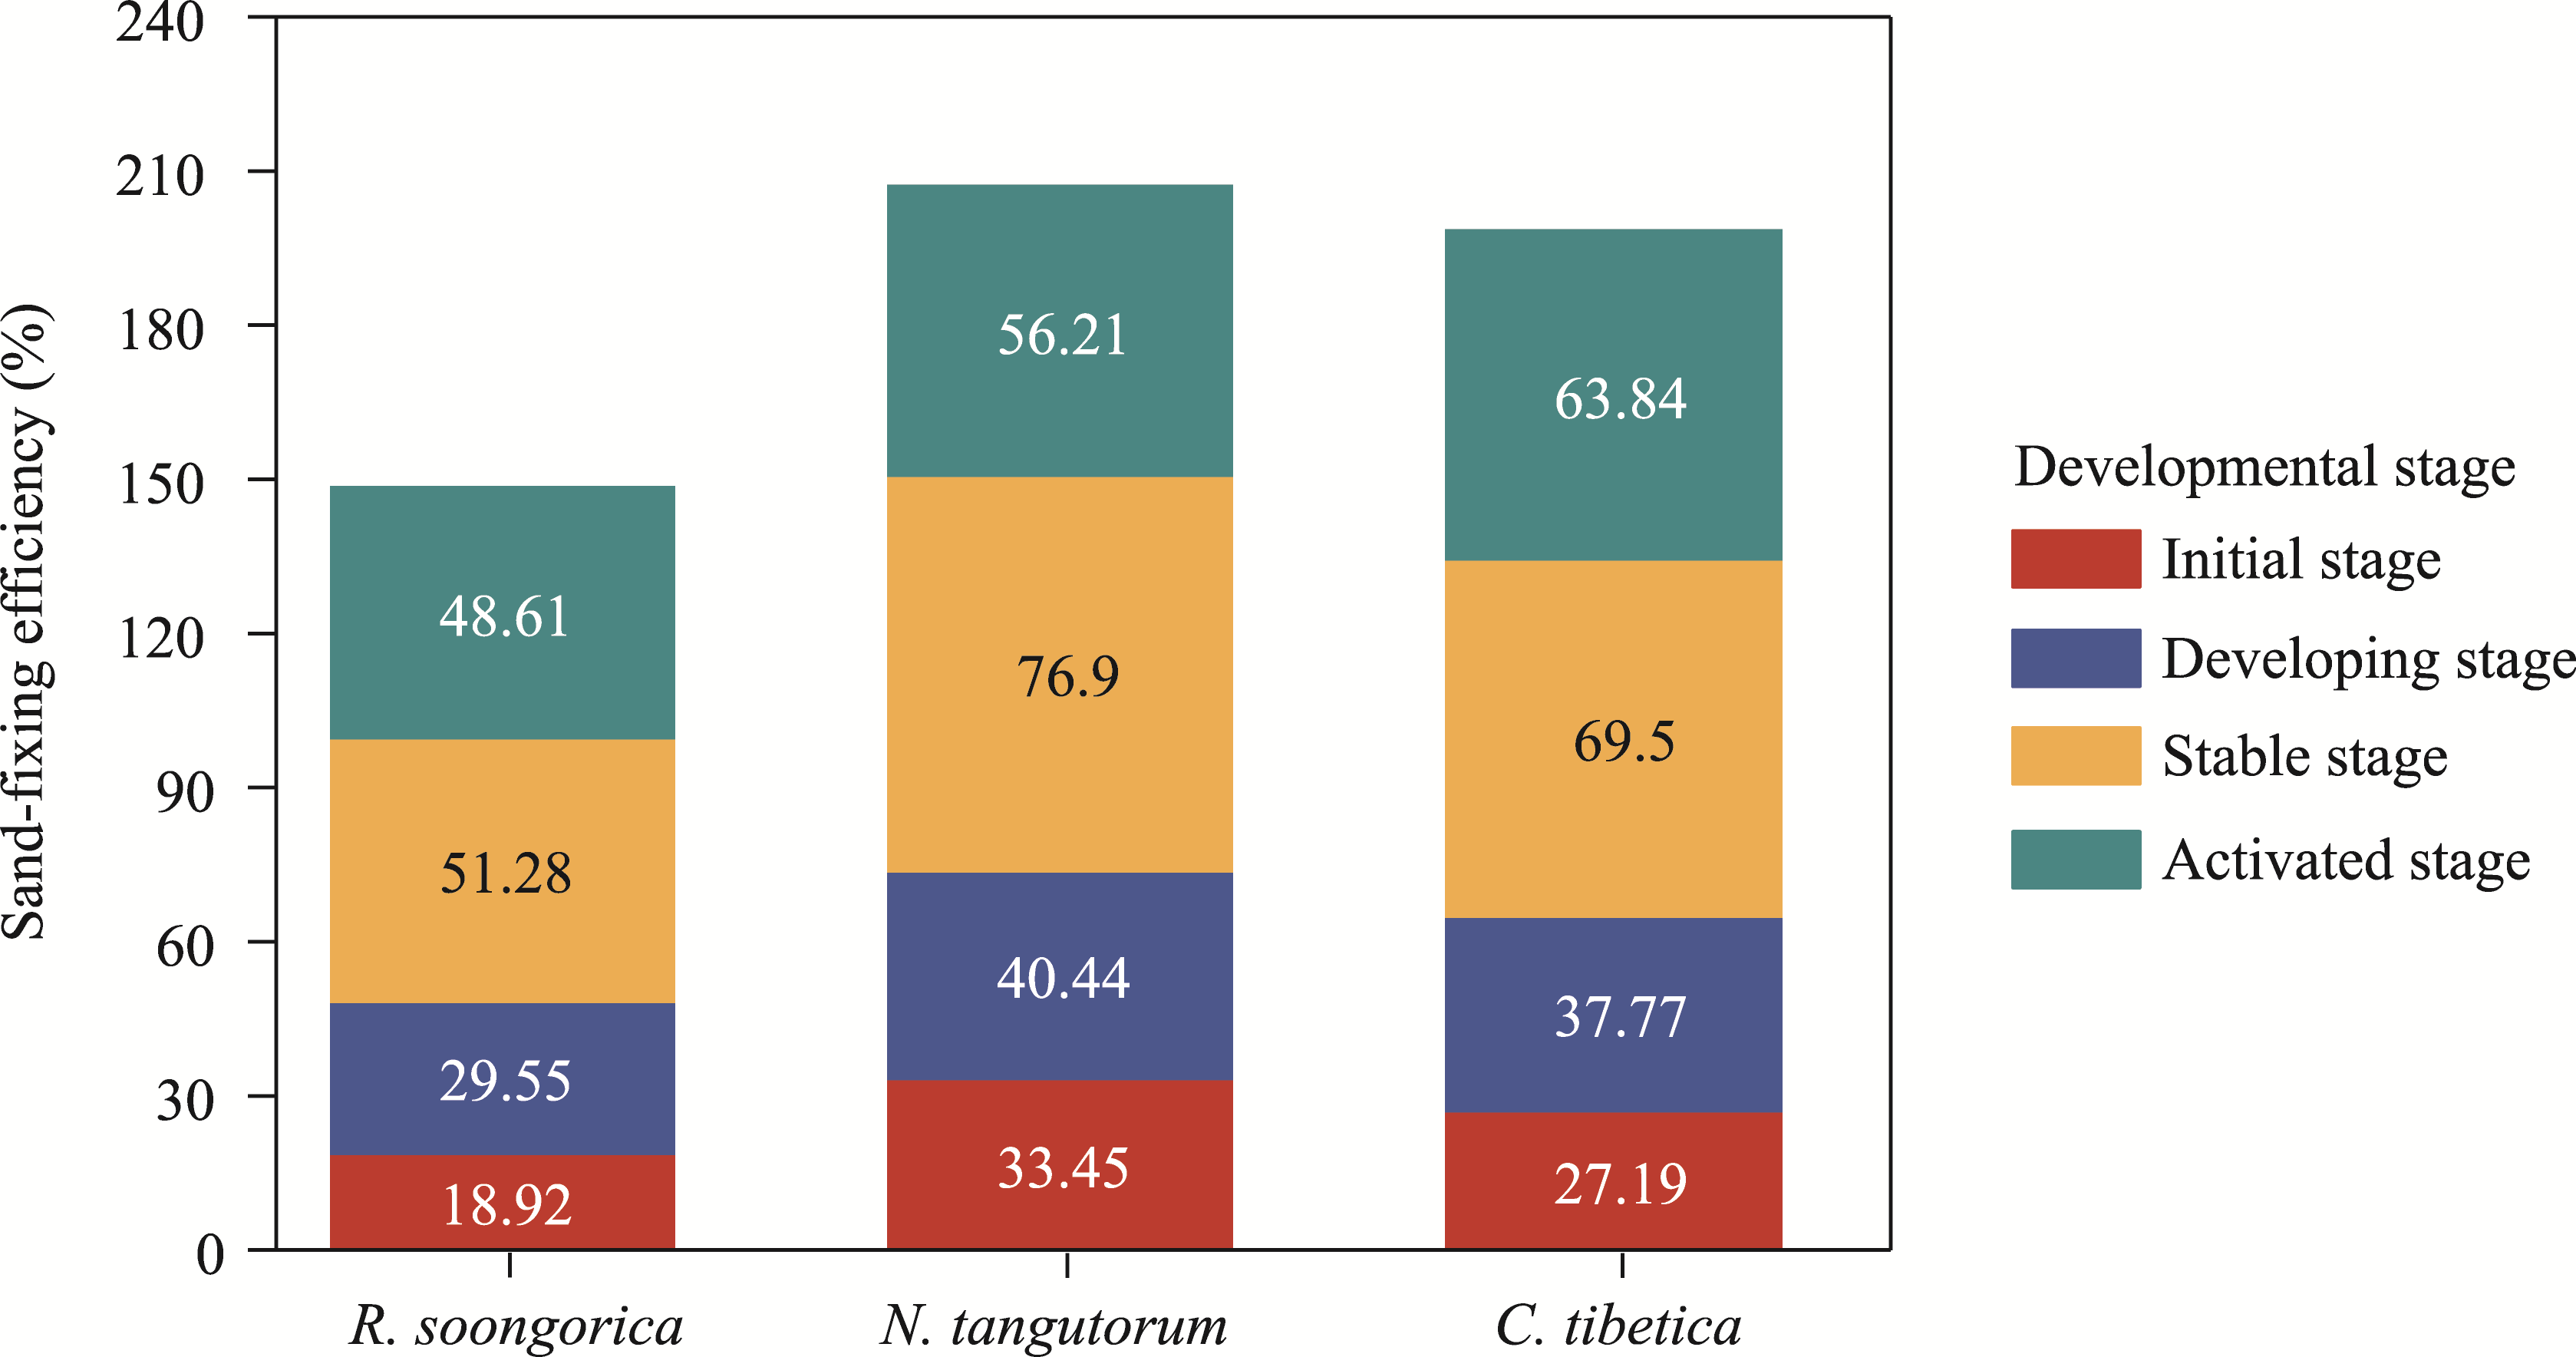
Fig. 5Windbreak and sand-fixing effects of typical nebkhas at different developmental stages
Fig. 6Variation in wind speed with relative height (z/H) and normalized horizontal distance (x/L) along the y=0 centerline of typical nebkhas at different developmental stages. (a), initial stage; (b), developing stage; (c), stable stage; (d), activated stage.
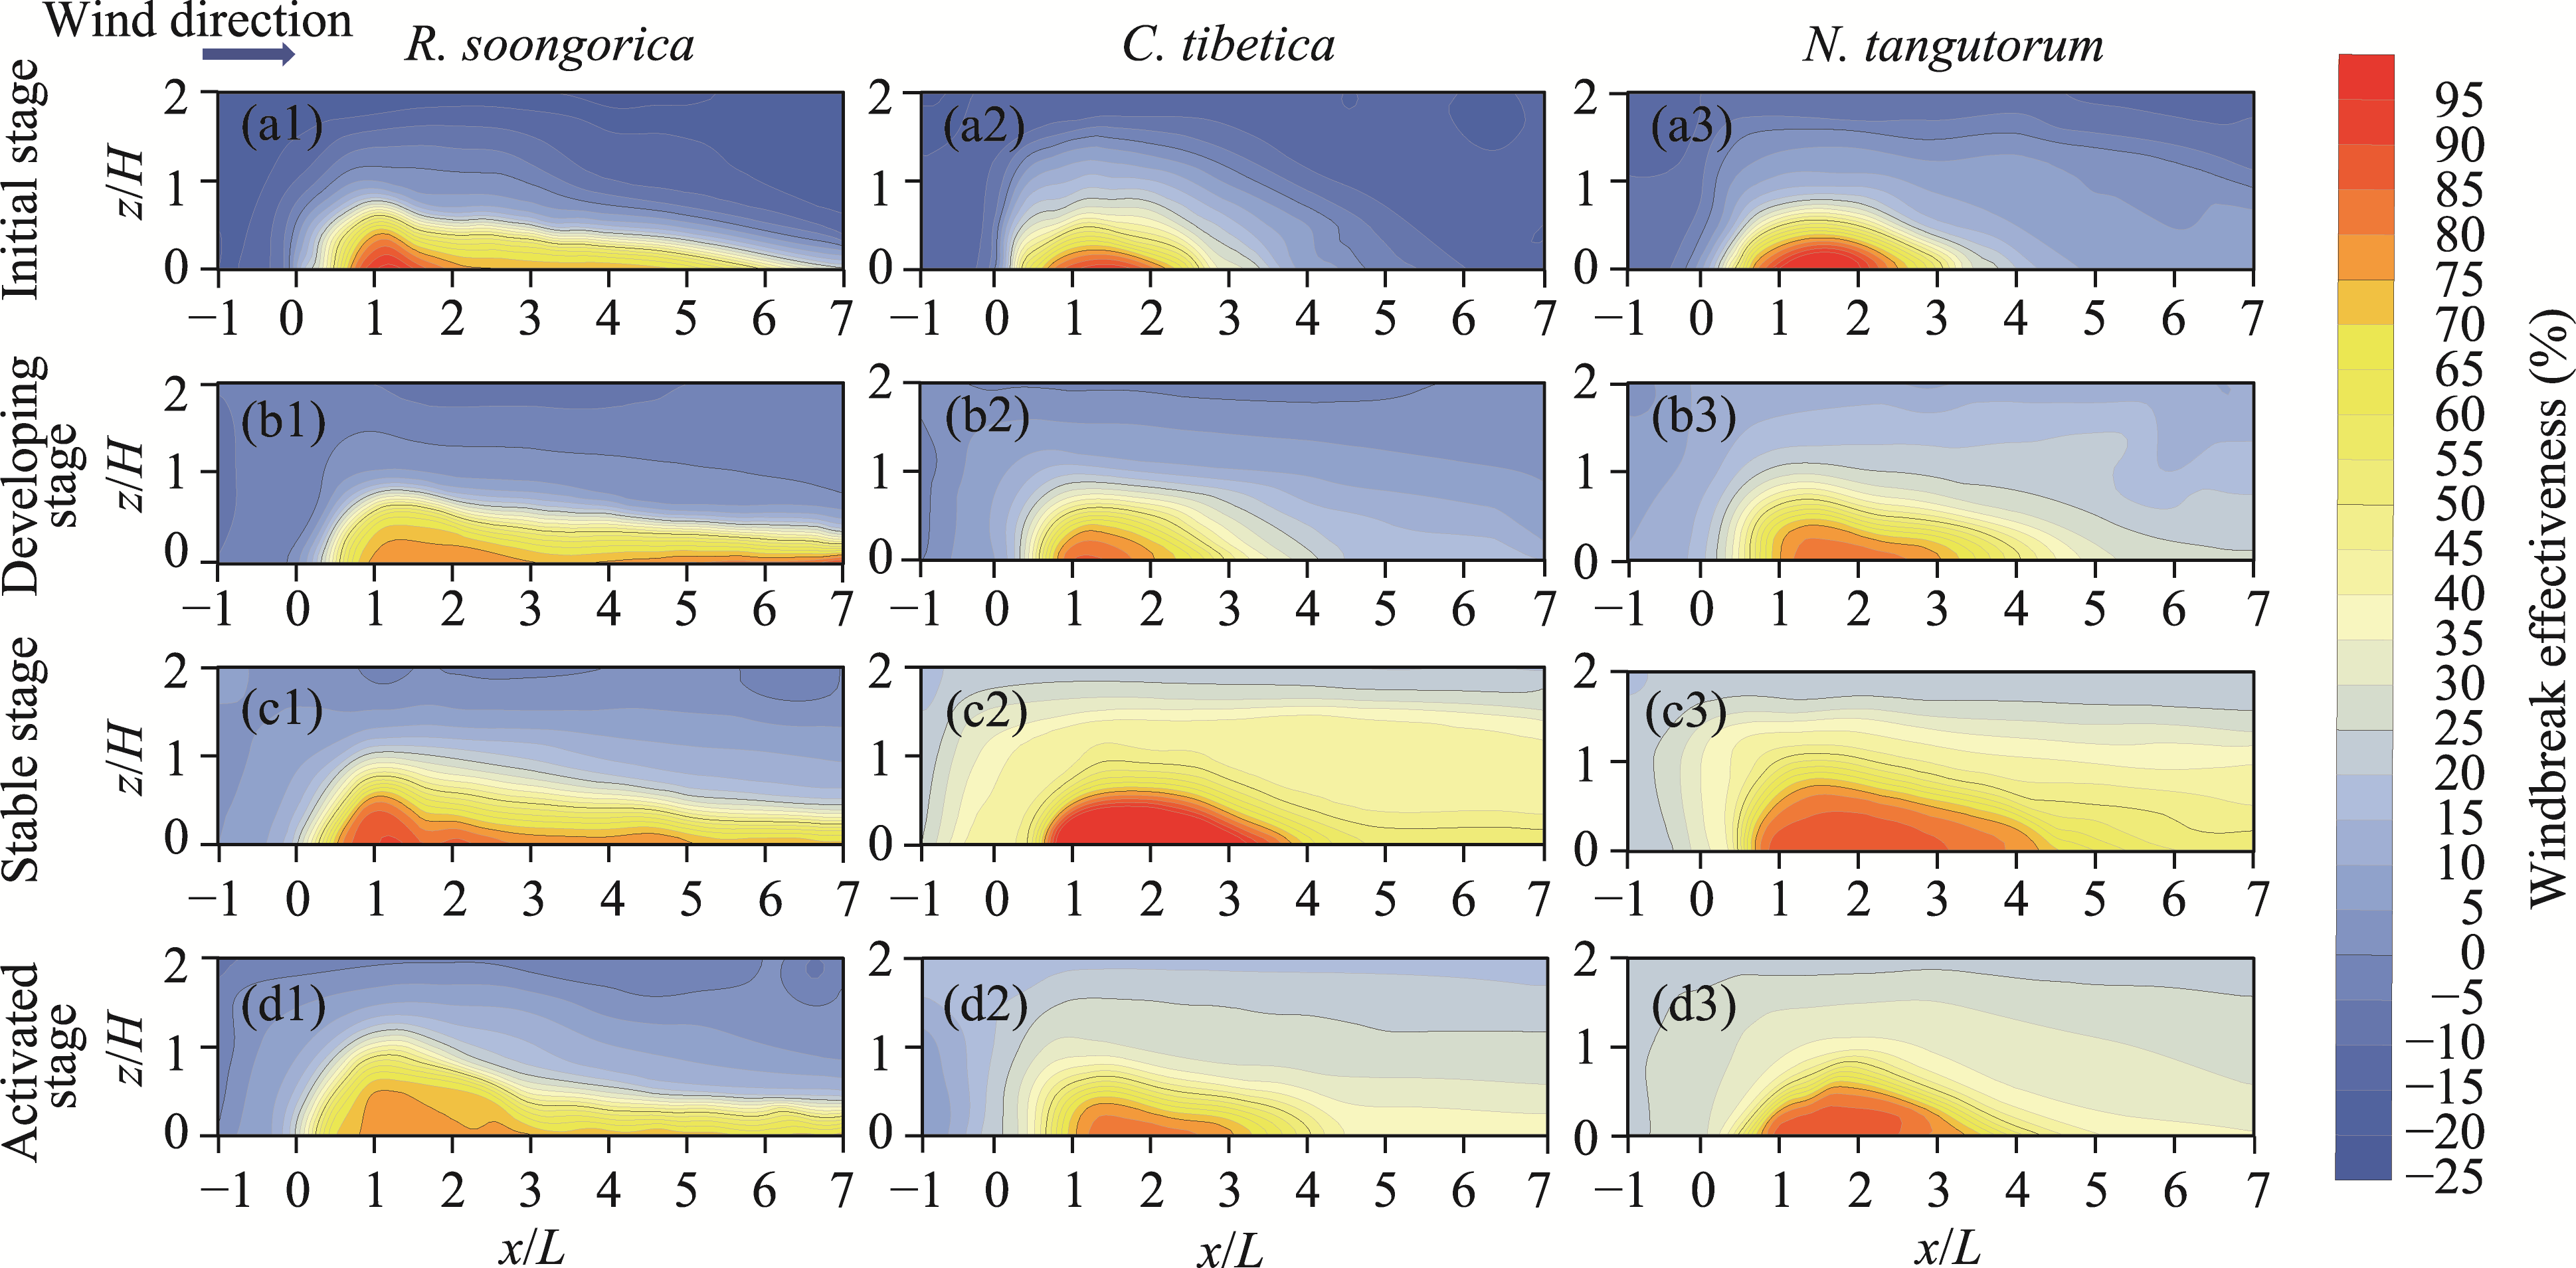
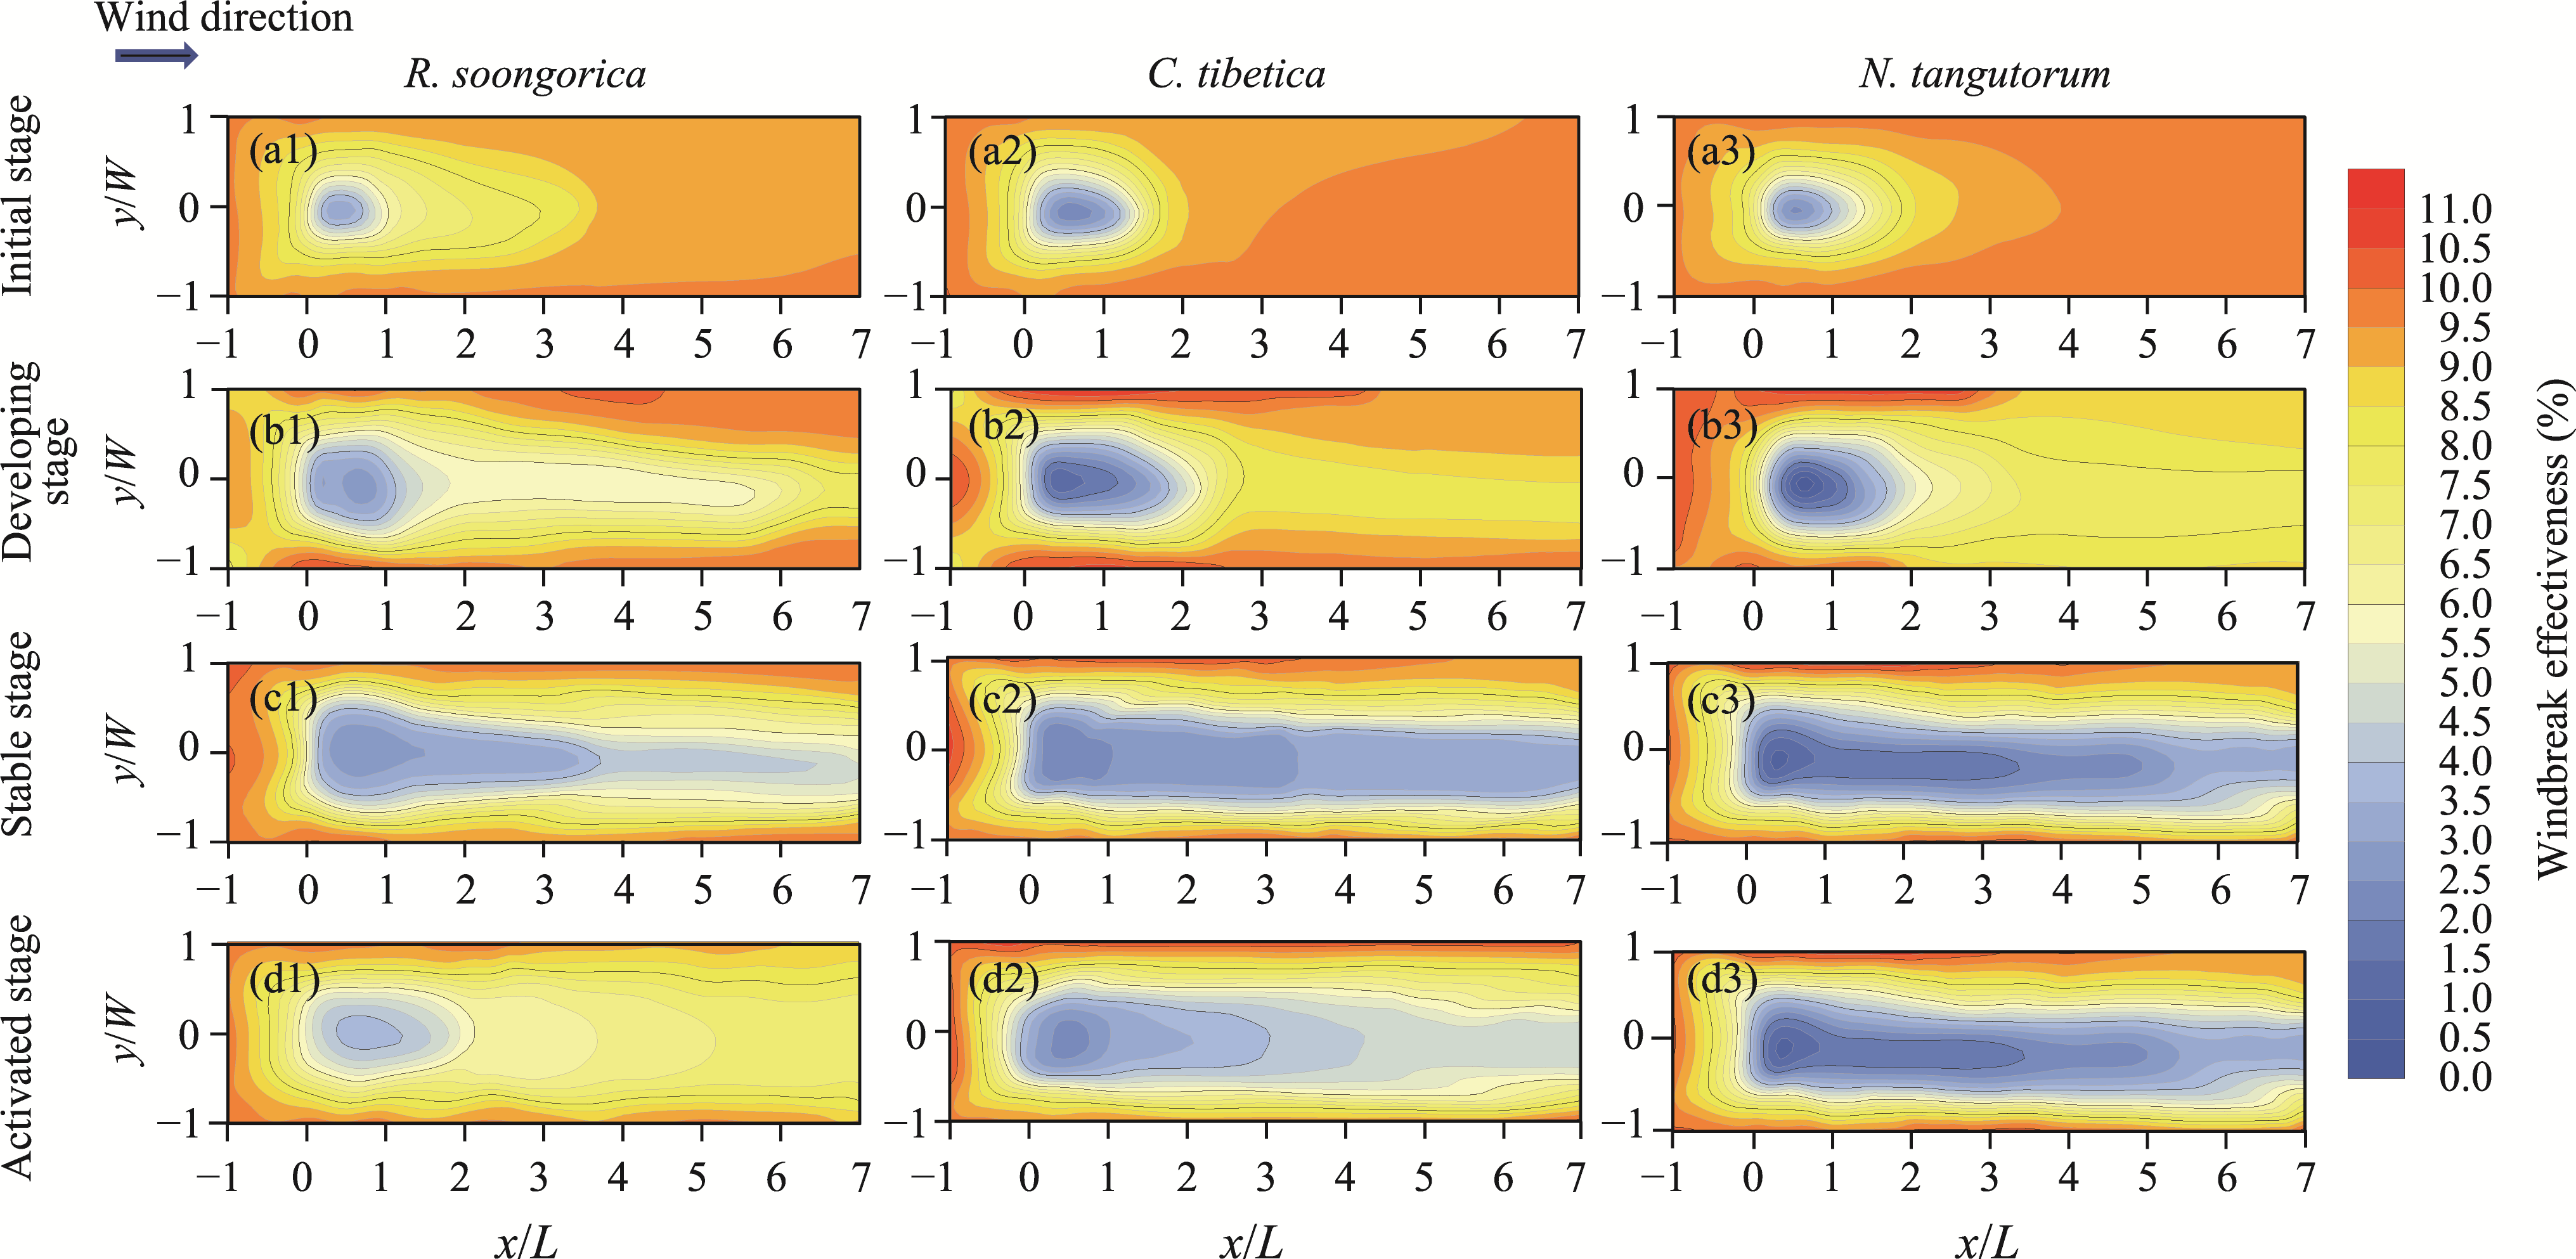
Fig. 7Windbreak efficiency of typical nebkhas at different developmental stages, shown as functions of x/L and z/H along the y=0 centerline. (a1-a3), initial stage; (b1-b3), developing stage; (c1-c3), stable stage; (d1-d3), activated stage.
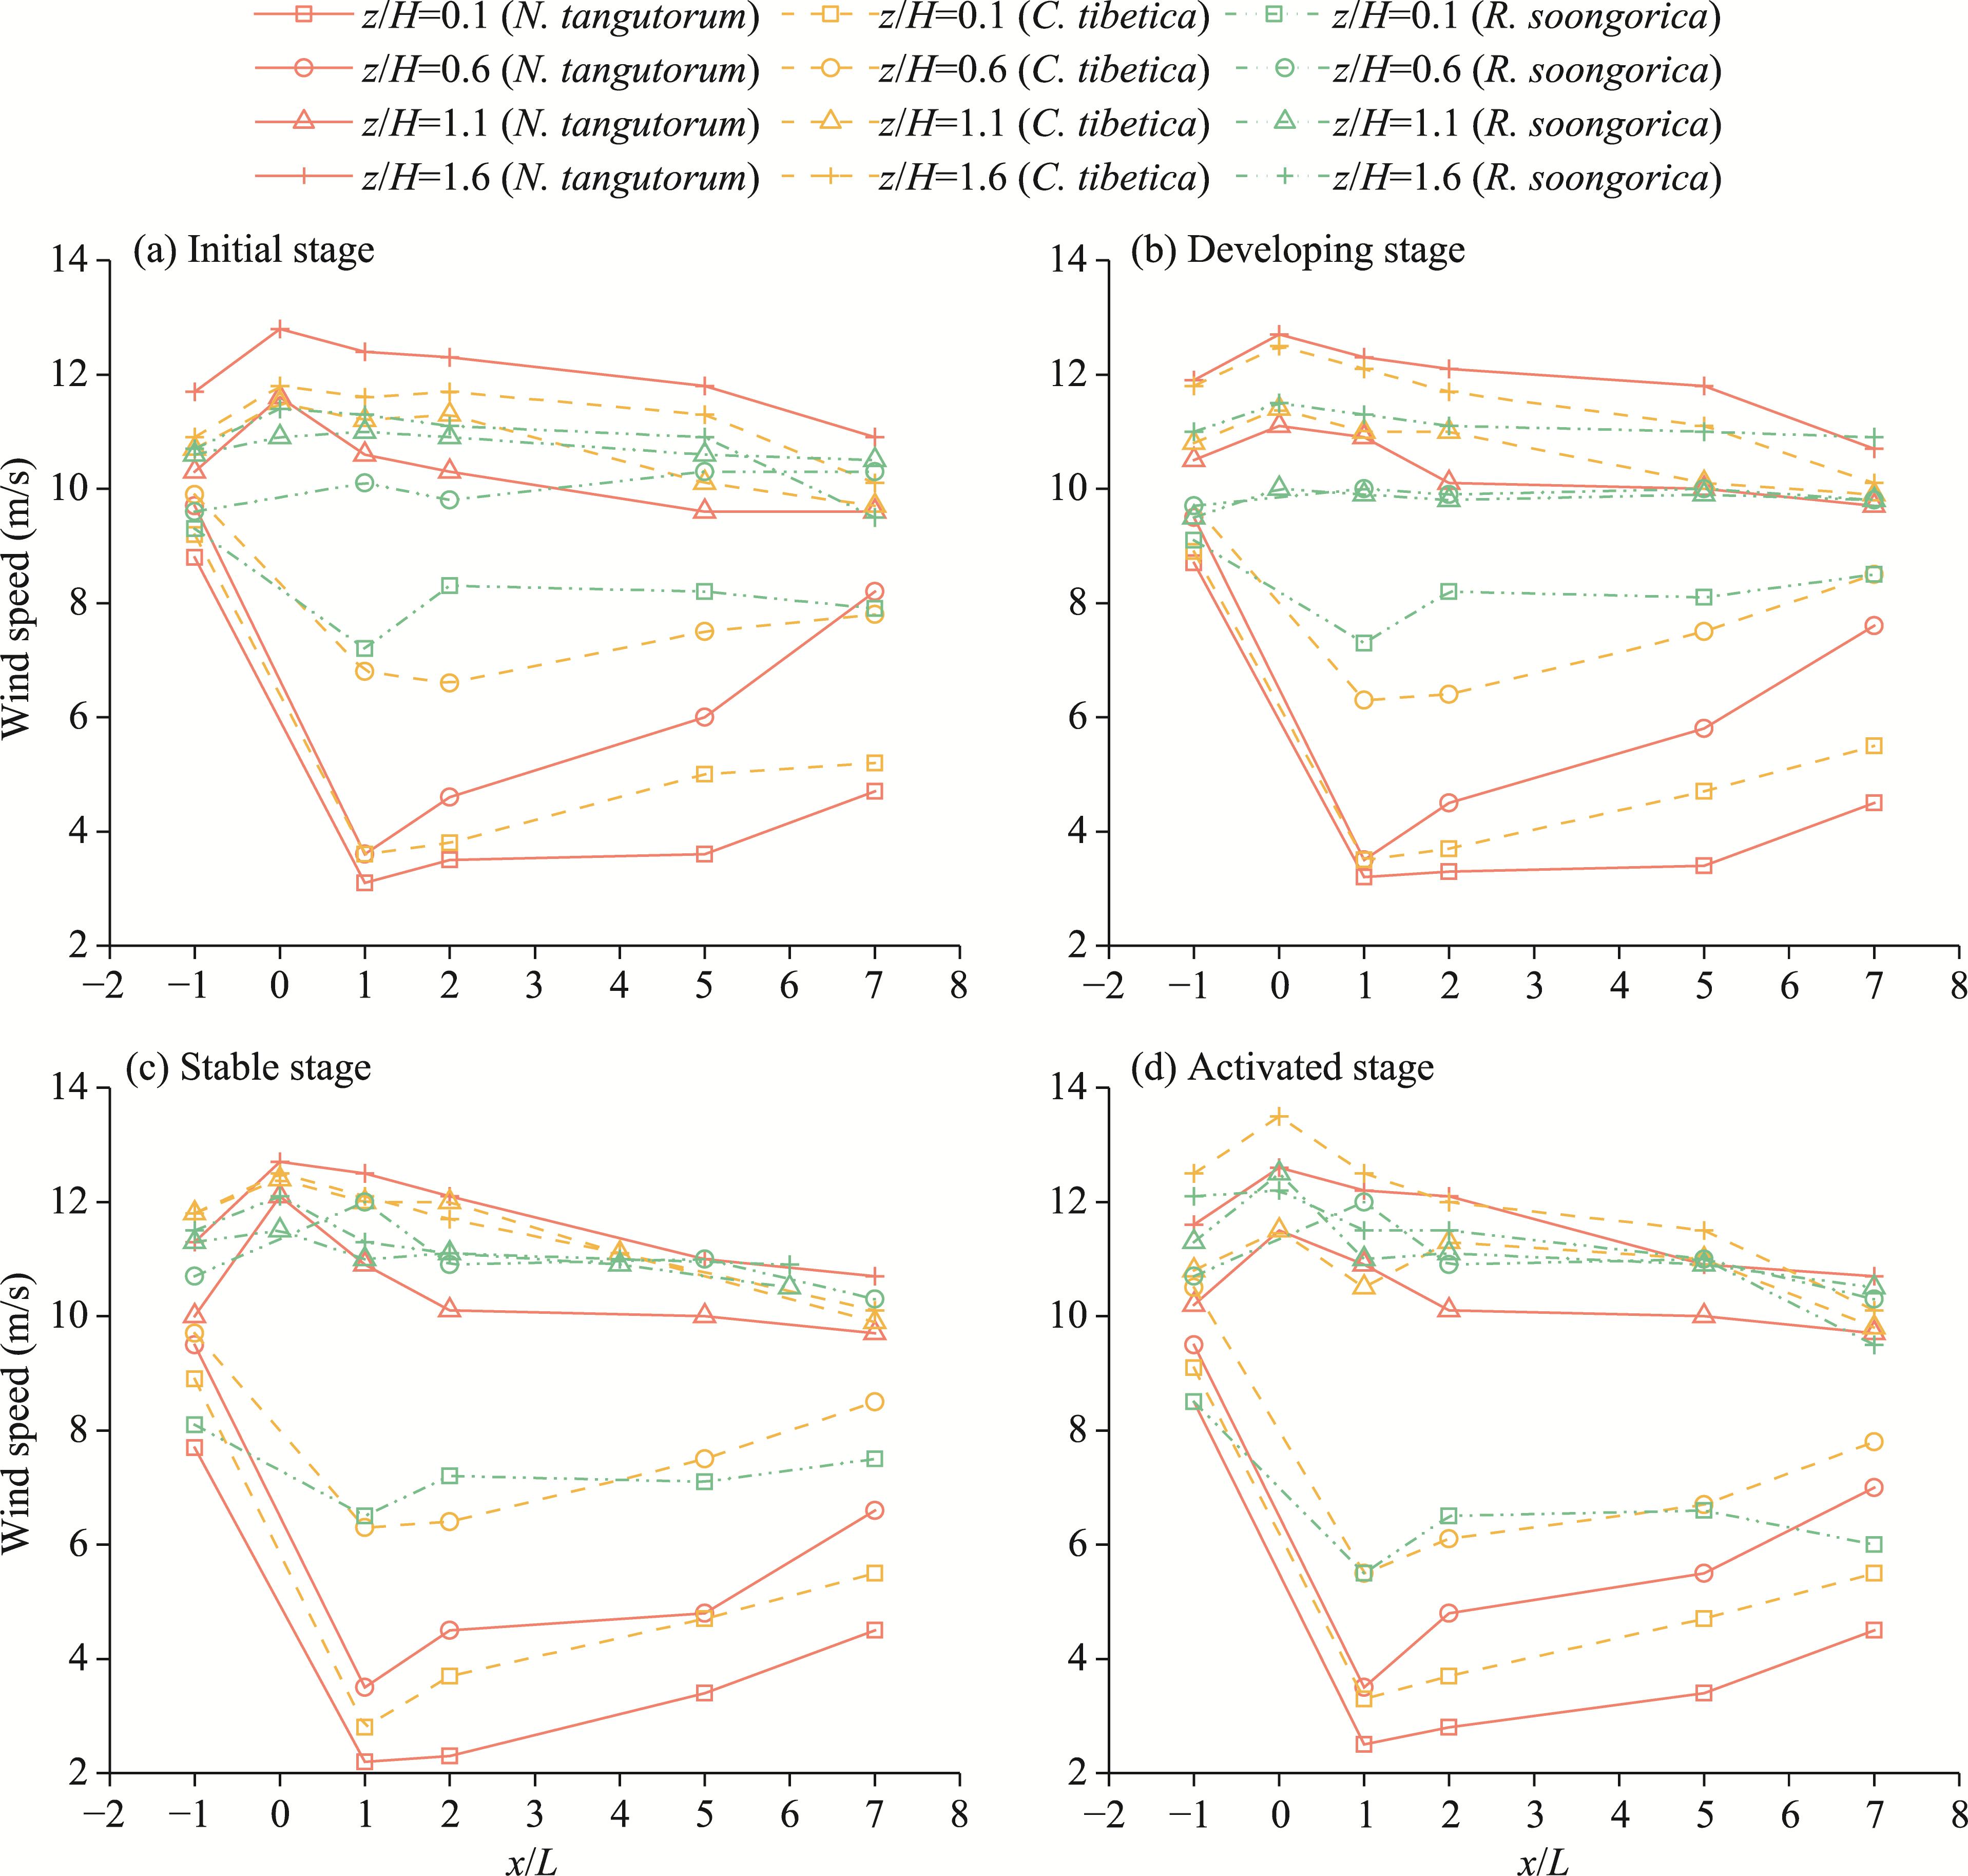
Fig. 8Variation in wind speed with x/L and z/H along the y=0 centerline of typical nebkhas at different developmental stages. (a), initial stage; (b), developing stage; (c), stable stage; (d), activated stage.
Fig. 9Wind speed distribution along x/L and normalized lateral distance (y/W) at z/H=0.3 for typical nebkhas at different developmental stages. (a1-a3), initial stage; (b1-b3), developing stage; (c1-c3), stable stage; (d1-d3), activated stage.
[1]
Ahmadi A, Neyshabouri M R, Rouhipour H, et al. 2011. Fractal dimension of soil aggregates as an index of soil erodibility. Journal of Hydrology, 400(3-4): 305-311.
doi: 10.1016/j.jhydrol.2011.01.045
[2]
An H, Zhao F Y, Li H N, et al. 2025. The typical sand-fixing plants in the Ulan Buh desert-oasis area significantly changed the distribution pattern of surface sediments. Frontiers in Environmental Science, 13: 1556083, doi: 10.3389/fenvs.2025.1556083.
[3]
Armstrong A C. 1986. On the fractal dimensions of some transient soil properties. Journal of Soil Science, 37(4): 641-652.
doi: 10.1111/ejs.1986.37.issue-4
[4]
Bosq M, Bertran P, Degeai J P, et al. 2018. Last Glacial aeolian landforms and deposits in the Rhône Valley (SE France): Spatial distribution and grain-size characterization. Geomorphology, 318: 250-269.
doi: 10.1016/j.geomorph.2018.06.010
[5]
Burylo M, Rey F, Bochet E, et al. 2012. Plant functional traits and species ability for sediment retention during concentrated flow erosion. Plant and Soil, 353: 135-144.
doi: 10.1007/s11104-011-1017-2
[6]
Chang Z F, Zhang J H, Shi X G, et al. 2018. Correlation between nebkhas formation ability and silhouette layer parameters of desert plants. IOP Conference Series: Earth and Environmental Science, 191: 012012, doi: 10.1088/1755-1315/191/1/012012.
[7]
Cheng L, Wu B, Pang Y J, et al. 2024. Shrub growth improves morphological features of nebkha: A case study of Nitraria tangutorum in the Tengger Desert. Plants, 13(5): 624, doi: 10.3390/plants13050624.
[8]
Du J H, Yan P, Dong Y X. 2010. The progress and prospects of nebkhas in arid areas. Journal of Geographical Sciences, 20: 712-728.
doi: 10.1007/s11442-010-0806-5
[9]
Fan B, Zhao C M, Zhang X W, et al. 2018. Impacts of sand burial and wind erosion on regeneration and growth of a desert clonal shrub. Frontiers in Plant Science, 9: 1696, doi: 10.3389/fpls.2018.01696.
pmid: 30619381
[10]
Fang J Z, Xiong K N, Chi Y K, et al. 2022. Research advancement in grassland ecosystem vulnerability and ecological resilience and its inspiration for improving grassland ecosystem services in the Karst desertification control. Plants, 11(10): 1290, doi: 10.3390/plants11101290.
[11]
Folk R L, Ward W C. 1957. Brazos River bar: A study in the significance of grain size parameters. Journal of Sedimentary Research, 27(1): 3-26.
doi: 10.1306/74D70646-2B21-11D7-8648000102C1865D
[12]
Furieri B, Russeil S, Santos J M, et al. 2013. Effects of non-erodible particles on aeolian erosion: Wind-tunnel simulations of a sand oblong storage pile. Atmospheric Environment, 79: 672-680.
doi: 10.1016/j.atmosenv.2013.07.026
[13]
Guo X Y, Yang G, Wang C G, et al. 2025. Improvement effects of different shrub sand fixation plantations on vegetation and soil in the Kubuqi Desert. Frontiers in Plant Science, 16: 1688154, doi: 10.3389/fpls.2025.1688154.
[14]
Hesp P A, Dong Y X, Cheng H, et al. 2019. Wind flow and sedimentation in artificial vegetation: Field and wind tunnel experiments. Geomorphology, 337: 165-182.
doi: 10.1016/j.geomorph.2019.03.020
[15]
Hesp P A, Hernández-Calvento L, Hernández-Cordero A I, et al. 2021. Nebkha development and sediment supply. Science of The Total Environment, 773: 144815, doi: 10.1016/j.scitotenv.2020.144815.
[16]
Kidron G J, Zohar M. 2016. Factors controlling the formation of coppice dunes (nebkhas) in the Negev Desert. Earth Surface Processes and Landforms, 41(7): 918-927.
doi: 10.1002/esp.v41.7
[17]
Latif Bhutto S, Miri A, Zhang Y, et al. 2022. Experimental study on the effect of four single shrubs on aeolian erosion in a wind tunnel. CATENA, 212: 106097, doi: 10.1016/j.catena.2022.106097.
[18]
Li M L, Avirmed B, Bayanmunkh G, et al. 2025a. Unveiling drivers and projecting future risks of desertification vulnerability in the Mongolian Plateau. Remote Sensing, 17(14): 2389, doi: 10.3390/rs17142389.
[19]
Li M T, Nie J S, Li Z J, et al. 2023. A middle Pleistocene to Holocene perspective on sediment sources for the Tengger Desert, China. CATENA, 228: 107119, doi: 10.1016/j.catena.2023.107119.
[20]
Li X M, Zhou J, Zhou W H, et al. 2025b. Hydrochemical characteristics of shallow groundwater and analysis of vegetation water sources in the Ulan Buh Desert. Water, 17(21): 3058, doi: 10.3390/w17213058.
[21]
Luo W C, Zhao W Z. 2015. Effects of wind erosion and sand burial on growth and reproduction of a clonal shrub. Flora, 217: 164-169.
doi: 10.1016/j.flora.2015.10.006
[22]
Meng R B, Meng Z J, Cai J L, et al. 2024. The role of typical low vertical lattice sand barriers in regulating the airflow field on wind-eroded surfaces of photovoltaic power plants. Frontiers in Environmental Science, 12: 1521144, doi: 10.3389/fenvs.2024.1521144.
[23]
Miri A, Dragovich D, Dong Z B. 2021. Wind flow and sediment flux profiles for vegetated surfaces in a wind tunnel and field-scale windbreak. CATENA, 196: 104836, doi: 10.1016/j.catena.2020.104836.
[24]
Niu F R, Pierce N A, Okin G S, et al. 2023. Sandblasting promotes shrub encroachment in arid grasslands. New Phytologist, 240(5): 1817-1829.
doi: 10.1111/nph.19238
pmid: 37658674
[25]
Pan X, Wang Z Y, Gao Y, et al. 2020. Windbreak and airflow performance of different synthetic shrub designs based on wind tunnel experiments. PLoS ONE, 15(12): e0244213, doi: 10.1371/journal.pone.0244213.
[26]
Pan Y Q, Kang P, Qu X, et al. 2024. Response of the soil bacterial community to seasonal variations and land reclamation in a desert grassland. Ecological Indicators, 165: 112227, doi: 10.1016/j.ecolind.2024.112227.
[27]
Qian G Q, Yang Z L, Tian M, et al. 2021. From dome dune to barchan dune: Airflow structure changes measured with particle image velocimetry in a wind tunnel. Geomorphology, 382: 107681, doi: 10.1016/j.geomorph.2021.107681.
[28]
Ren X Z, Yang X P, Wang Z T, et al. 2014. Geochemical evidence of the sources of aeolian sands and their transport pathways in the Minqin Oasis, northwestern China. Quaternary International, 334-335: 165-178.
doi: 10.1016/j.quaint.2014.04.037
[29]
Ren Y, Liu X J, Zhang B, et al. 2023. Sensitivity assessment of land desertification in China based on multi-source remote sensing. Remote Sensing, 15(10): 2674, doi: 10.3390/rs15102674.
[30]
Sharratt B, Feng G L. 2009. Friction velocity and aerodynamic roughness of conventional and under cutter tillage within the Columbia Plateau, USA. Soil and Tillage Research, 105(2): 236-241.
doi: 10.1016/j.still.2009.08.004
[31]
Shou W K, Musa A, Liu Z M, et al. 2017. Rainfall partitioning characteristics of three typical sand-fixing shrubs in Horqin Sand Land, north-eastern China. Hydrology Research, 48(2): 571-583.
doi: 10.2166/nh.2016.177
[32]
Sun L X, Li C L, Yu Y, et al. 2025. Quantifying desertification control efficiency in a hyper-arid region: Spatiotemporal dynamics and policy synergies in Hotan Prefecture of China during 2005-2023. Regional Sustainability, 6(6): 100275, doi: 10.1016/j.regsus.2025.100275.
[33]
Wang Y, Chen S L, He W C, et al. 2021. Shrub diversity and niche characteristics in the initial stage of reconstruction of low-efficiency Cupressus funebris stands. Forests, 12(11): 1492, doi: 10.3390/f12111492.
[34]
Wen Q, Dong Z B. 2016. Geomorphologic patterns of dune networks in the Tengger Desert, China. Journal of Arid Land, 8(5): 660-669.
doi: 10.1007/s40333-016-0092-x
[35]
Wu X W, Zou X Y, Zhou N, et al. 2015. Deceleration efficiencies of shrub windbreaks in a wind tunnel. Aeolian Research, 16: 11-23.
doi: 10.1016/j.aeolia.2014.10.004
[36]
Zhang C L, Wang X S, Zou X Y, et al. 2022. Field investigation of the fetch effect and essential conditions for saturated sand flow. Earth Surface Processes and Landforms, 47(9): 2299-2309.
doi: 10.1002/esp.v47.9
[37]
Zhang Z C, Han L Y, Pan K J, et al. 2020. Nebkha dune morphology in the Gobi deserts of northern China and potential implications for dust emission. Sedimentology, 67(7): 3769-3782.
doi: 10.1111/sed.v67.7
[38]
Zhao Y C, Gao X, Lei J Q, et al. 2020. Nebkha alignments and their implications for shadow dune elongation under unimodal wind regime. Geomorphology, 365: 107250, doi: 10.1016/j.geomorph.2020.107250.
[39]
Zhao Y C, Gao X. 2021. Morphodynamics of shadow dunes. Earth-Science Reviews, 222: 103840, doi: 10.1016/j.earscirev.2021.103840.
[40]
Zhu B Q, Zhang J X, Sun C. 2021. Physiochemical characteristics, provenance, and dynamics of sand dunes in the arid Hexi Corridor. Frontiers in Earth Science, 9: 728202, doi: 10.3389/feart.2021.728202.
[41]
Zhuo C X, Tong X, Hao B E, et al. 2023. Feasibility analysis using a porous media model to simulate the wind protection effect of windbreak forests. Land Degradation & Development, 34(1): 207-220.
doi: 10.1002/ldr.v34.1